S&P 500 consolidates near recent highs ahead of Amazon earningsThe markets remain in a risk-on mode, with major global indices rallying.
Earlier in Europe, the German DAX, the UK’s FTSE, and several other indices hit record highs. The FTSE outperformed due to weak UK economic data, which increased the likelihood of more rate cuts from the Bank of England. While the BoE cut rates as expected, two MPC members voted for a surprising 50-basis-point cut, causing the pound to drop sharply and boosting the FTSE.
From the U.S., unemployment claims came in slightly higher than expected. With the non-farm payrolls report due tomorrow, the U.S. dollar has pulled back from earlier highs. Given the positive risk sentiment, currency pairs like the Aussie dollar could be on the verge of a comeback.
The focus will turn to Amazon’s earnings, which are set to be released after the close.
Ahead of Amazon's results, the S&P remains in consolidation, attempting to form a bottom following recent volatility caused by Trump’s tariff threats. As long as major support levels shown on the chart hold, any minor pullbacks shouldn’t change the broader technical outlook.
short-term support comes in at 6042, followed by 6,000. Longer-term support is seen around 5830 area, which is critical to hold.
On the upside, resistance comes in around 6085 to 6100. Above here, there is nothing significant until we potentially reach new highs.
By Fawad Razaqzada, market analyst with FOREX.com
Tradeideas

31% higher since we called bottom on $TMDX31% higher since we called bottom on NASDAQ:TMDX
Where are my bulls at?!
We are just getting started on this name with massive upside potential!
$100 inbound!! 🎯
Not financial advice

EURO MOVE : NEXT TARGET IS 1.018According the 4 hour timeframe, as i can see Eurusd break to upside move. It continues to sell side move and may be it hits its lowest yet point soon.
I am bearish side now. previous target is not done . next is expected.

Need a Vacation with OOTO?This one just fired and vacation stocks likely don't care about semi-conductors. Who knows, maybe they even benefit from cheaper AI on a laptop computer!
This bull flag if it breaks out has a 7% profit target based on Fib Extension, with the algo backtest saying 5% take-profit and a 3.5% stop loss. If it hits 5%, I will go ahead and protect by selling half and then set trailer for 1.75% on remainder, with the intention of selling on the way up to 7%! But for now, I will just be happy if momentum continues to the upside!
The King Trading Momentum Strategy combines the 5 EMA crossing above the 13 EMA, RSI strength, favorable momentum as measured by ADX plus evaluating recent volume changes and even something that measures breakout momentum called Beta for this one! OOTO and over 100 equities are built into this script with optimal backtest take profits and stop losses and can be toggled on by simply checking a box (default they are turned off).

HIMS - About to go parabolic!Sorry, you missed it on NYSE:HIMS
The next earnings call will be game-changing, you'll never see a 2-handle on this name EVER again.
4-handle inbound! 🎯
Not financial advice

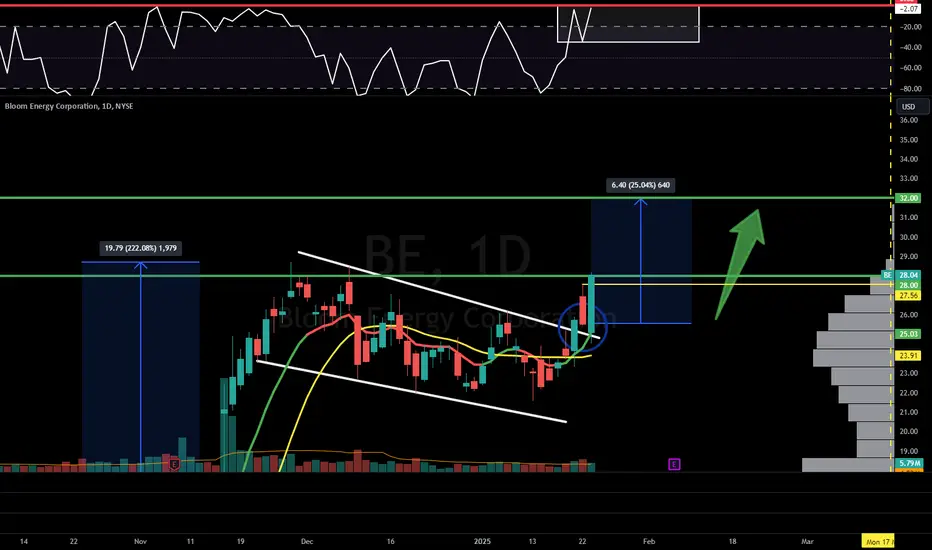
$BE - Is BE-ASTING! Free Swing Trade Idea is killing it!NYSE:BE is the next NYSE:OKLO NASDAQ:NNE
March 26 calls up 44% & counting! 🤯
$28 profit target obliterated!!!!💥
Called this trade out for free!
Not financial advice
$TMDX - Bottom is in, higher from here!If you are a NASDAQ:TMDX bull you are going to want to see this!
In my opinion, we've just bottomed!
🎯$80
Not financial advice

H5_L Screener Run Through! 22Jan2025In this video, I run through my H5_L Screener!
Todays date: 22Jan2025
Found some great trades and setups using my screener!
Not financial advice

DASH - High Five Trade of the Week!Trade of the Week #2: NASDAQ:DASH 🚪💨
Get ready to dig into a tasty DoorDash swing trade!
In this video, we cover:
🔍 In-Depth Trade Idea Breakdown
🎯 Precise Trade Execution
💰 Profit-Maximizing Tips
Don't miss out, friends! Watch now 👇
Not financial advice

HIMS - T1 Trade Alert! 38% UPSIDE💊 NYSE:HIMS T1 Trade Alert! 💊
While we never left NYSE:HIMS as an investment, we took a brief trading hiatus. But guess what?
WE ARE BACK!!!
🔨 HAMMER TIME, BABY!
🎯 Targets: $30, $35, $38
🖐️ H5 Trading Community was notified about this setup this morning!
NOT FINANCIAL ADVICE

UNH - Took the GREEN PILL! 15% Move Inbound!NYSE:UNH 💊
H5_Swing Trade:
Playing small with one $560 Call heading into earnings. Fundamentally undervalued and beaten down stock since their CEO was murdered.
Good earnings and the fact they are a safety play make me really like this play.
H5 Trade and WCB look great too!
🎯$623
⏳Before March
Not financial advice

$META long or short?Indecisive on this ticker. I like what Zuck is trying to do. This chart looks pretty nice. I’m seeing upside into the earnings and maybe this earnings NASDAQ:META will go up $50+ (hopeium). Let me know what you guys think. I want to see 700’s and honestly it could be insane, yet not so insane in this current market, to try and hit 800. Look at other tickers, NASDAQ:CRWD lost $200 in what a month? Then regained $200 or so in 2-3 months? NASDAQ:NVDA speaks for itself, NASDAQ:MSTR , these large MC names can do wild things.
Wallstreet

$FUN stops here; bearish expanding triangleTake a look. Will try to short this. Can even make a case for head and shoulders forming as well but for patterns sake there is a bearish expanding triangle here.
WSL.

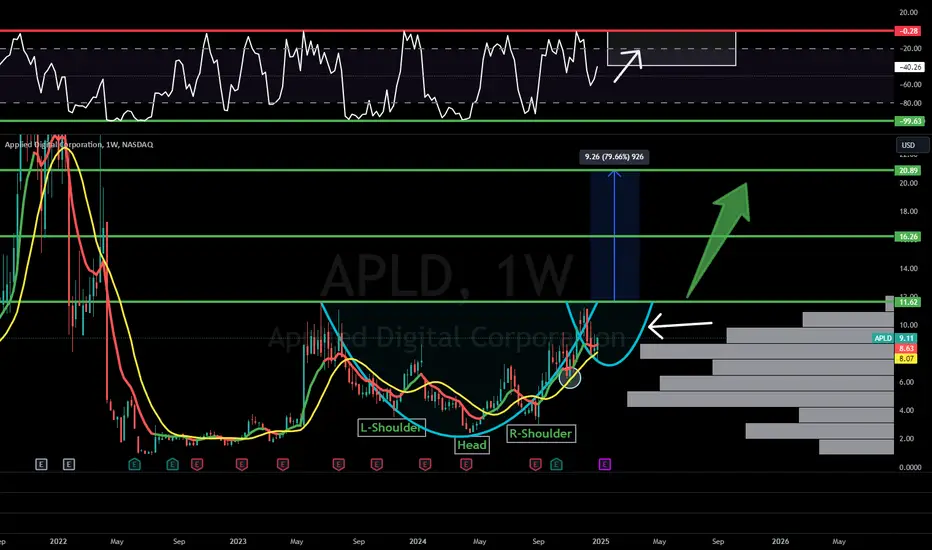
APLD - A name you NEED to add to your watchlist NOW!CHARTURDAY - NASDAQ:APLD
A good name to add to your watchlist friends!
Good:
-CupnHandle Pattern
-Inverse H&S
-Volume Shelf
-Bullish Wr%
Bad:
-Red H5 indicator
-No breakouts yet.
If we get a breakout and green H5 then...
🎯$16🎯$21
Not financial advice
Amazon: Ready to Explode in 2025! 40% UPSIDECHARTURDAY - NASDAQ:AMZN Ready to Explode in 2025!
A great fundamental and technical setup for 2025!
-Multi-year CupnHandle with successful retest and we haven't realized the measured move yet
-Green H5 indicator
-Volume shelf w/ free space
-Williams CB is thriving
Pulled back to 9ema and previous resistance to flip into support and bounced.
🎯$231🎯$280 🎯$310
Not financial advice

$REAX: The Moment of Truth - Ready for a Skyrocket or a Crash?NASDAQ:REAX : The Moment of Truth - Ready for a Skyrocket or a Crash? 📉🚀
🚨 A make or break moment here, friends! 🚨
Good:
At strong cup-and-handle retest area (Strong Support Zone) 💪 *Measured Move for cup-and-handle breakout hasn't been realized yet
Falling wedge pattern into support 📈
Bad:
Off the volume shelf and in the volume gap ⚠️
Red H5 Indicator 📉
Short Williams CB formed and thriving
🚀 Going to $8.20 or sub $4 🚀
Not financial advice.

HIMS: It's Hammer Time! 80% UpsideNYSE:HIMS 💊
Shorts had their fun in the sun, now it's our turn!
Weekly Hammer candle wicking right off the Cup&Handle breakout retest zone!
BULLISH! See you at $35+ SOON! 😘
Not financial advice

$NVDA sideways 2 months, what's brewing?I have a couple charts indicating to me that an upside move will happen, when? That's not up to me. It's been a while since NASDAQ:NVDA has had a 10% week, maybe it's to come soon? I see a inverted head and shoulders on a 4H chart and a little flagging going on here on the 1W? Interesting to see how this will play out.
WallStLsr

MOBILEYE: BUY the DIP or FOMO later! 10X OpportunityCharturday #7: NASDAQ:MBLY 🚘
#1 trade/ investment for me right now!
Weekly Analysis:
-H5 Indicator is GREEN
-Inverse H&S/ Triangle B/O hasn't been realized yet at $20.30. Only got $20.01 Price GAP fill.
-Sitting on a volume shelf with a MASSIVE GAP
-Williams CB is thriving
-Channel Up trend and at the bottom
Fundamentals on the company are huge with an amazing HONDA partnership being dropped on Jan. 7th based on my opinion which was formulated with all the data I have! I'm 99% sure of it! But it's still an opinion and not fact....YET!
Daily Analysis:
-CupnHandle breakout receded due to this weeks flash crash. MASSIVE BUYING OPP. IMO!
-Currently finished handle and next breakout of $19.15 & $20.09 and we won't see $18 ever again!
-Sitting on volume shelf with room to run
-Up trending Wr%
🔜🎯$20.30🎯$23🎯25
🎯$28⏲️Before 13JUN2025
Not financial advice.

FULL Trading Portfolio Update! How I'm positioningFULL Trading Portfolio Update! How I'm positioning for what comes next in the markets.
In this video, we will discuss:
-How I'm positioning my trading portfolio right now
-All my current H5 trades
-All trades I CUT loose
-What comes next!
Check it out now for all the updates and some great trade ideas
Not financial advice.

META pulled back, I'm taking advantage! 30% UpsideH5 TRADE - NASDAQ:META
If you want a great fundamental investment as a trade then let NASDAQ:META be your huckleberry friends! Called out this breakout two weeks ago but wanted wait for this retest to happen. Well, we got it!
-H5 Indicator is GREEN
-Ascending triangle breakout with a retest which formed a Bull Flag that broke out as well and now retested.
-Williams CB formed and thriving, even with the big pullback yesterday
-Sitting on a Volume Shelf with ATH free space above
Bought in with 25 shares and will add some options on open.
🔜🎯$706
🎯$780
Not financial advice

$HITI is presenting another buying opportunity here! NASDAQ:HITI
-We are still holding onto our support level and turning previous resistance into support. If we dip lower we are going back to $2.81-$3 to officially retest the cup & handle breakout before we head higher.
-H5 Indicator is GREEN
-Williams Consolidation Box is thriving
-9ema is catching up to the stock price
-Same thing as before got to wait for the IWM to make it's move higher before we get sustenance.

$NVTS - Presenting a buying opp. before it's massive 300% move! NASDAQ:NVTS
As I said from the beginning, this name is going to be a bumpy ride, but I believe it's presenting another buying opportunity as we pull back to level 2 support at $2.90ish, which is also where the 9ema and falling wedge retest area are. I'm not concerned because we haven't started moving big on the IWM yet, and until then, most small caps won't move unless they have a catalyst.
-H5 Indicator is GREEN
-Searching for out support to create our Williams Consolidation Box officially
-Two separate volume shelfs below.
Everything is still intact; you just have to be patient.
NFA
