XAUUSD SNIPER OUTLOOK – JULY 28, 2025🔥 Macro & Sentiment
The dollar remains dominant — DXY holding above 105 keeps gold under pressure. No fundamental support for bullish continuation unless major macro shifts. Risk flows are defensive, not aggressive. FOMC and US GDP data remain key drivers for direction this week.
BIAS:
• Short-term bearish under 3350
• Market still in distribution mode — every bounce gets sold
• Real buy interest only deep below 3315
🔻 INTRADAY SUPPLY ZONES (Short Only With Rejection)
1. 3382–3370 (H1/M30 Premium Supply)
🔹 H1 order block, FVG alignment, EMA21/50/100 convergence
🔹 Liquidity inducement above → then rejection
📍 Short only if rejection shows via engulf / upper wick.
2. 3355–3340 (Decision Zone / Micro Supply)
🔹 EMA100/200 alignment, former support flipped resistance
🔹 M30 FVG fully filled, structure flip from mid-July
📍 Short bias below. Long only if reclaimed with H1 close above 3355.
🔵 NEUTRAL / PIVOT ZONE
3. 3338–3326 (Decision Band – M30/M15)
🔹 Consolidation area post-BOS, internal liquidity sweeps
🔹 EMA21 base on M15, no clear dominance
📍 Wait for clean reaction. Bullish engulf = scalp long to 3355. Failure = slide to demand.
🟢 DEMAND ZONES (Buy Only On Strong Reversal Confirmation)
4. 3314–3302 (M30/M15 Deep Demand)
🔹 H1 OB + hidden FVG + fib 38.2%
🔹 First real demand zone where buyers may engage
📍 Long only if strong M15 confirmation: engulf + RSI cross + EMA5/21 angle change.
5. 3289–3272 (True Reversal Demand – H1/M30)
🔹 Full NY reversal origin (July 18), major FVG left unfilled
🔹 Institutional volume + liquidity grab zone
📍 Buy only on full flush + fast snapback with BOS on M15/H1.
🧭 BIAS & EXECUTION BY TIMEFRAME
H4 Bias:
Bearish while below 3350. No valid supply above until 3370+. Avoid longs unless price sweeps 3314 or 3272 and confirms.
H1 Bias:
Sell clean rejection at 3355 or 3370–3382. Only flip long above 3355 with full-bodied close.
M30 Bias:
Watch decision zone 3338–3326 for direction. No-man’s land in between — don’t force trades.
M15 Bias:
Scalp long from 3314 or 3272 only on full confluence (OB + RSI + EMA realignment). Short only confirmed rejections above.
📊 FULL INTRADAY KEY LEVELS (Top → Bottom)
Level Context
3405 Fib ext. 127% (HTF sweep target only)
3385 OB
3375–3350 Valid Premium Supply (H1 shelf)
3350–3340 Micro Supply / Flip Zone
3338–3326 Decision Zone – watch reaction
3314–3302 Deep Demand (H1/M30 confluence)
3289–3272 Extreme Demand Base
3260 Fib 61.8% + HTF support
3250 Minor volume node
3240 Final structural floor
✅ EXECUTION NOTES
⛔ Avoid entering inside 3340–3326 → fakeout zone
✅ Play only clean sniper triggers with structure
⚠️ Wait for macro — FOMC / GDP releases may fake both sides
💡 Patience wins. Pick your zone, wait for setup, strike.
Which zone are you watching to strike? Drop your bias below.
📍 Like, comment & follow GoldFxMinds for the most precise sniper maps on TradingView.
Disclosure: This plan is based on the Trade Nation chart feed. I am part of their Influencer Program.
Tradenation

DOW Options Ahead of EarningsAnalyzing the options chain and the chart patterns of DOW prior to the earnings report this week,
I would consider purchasing the 30usd strike price Calls with
an expiration date of 2025-9-19,
for a premium of approximately $2.36.
If these options prove to be profitable prior to the earnings release, I would sell at least half of them.
Disclosure: I am part of Trade Nation's Influencer program and receive a monthly fee for using their TradingView charts in my analysis.

XAUUSD H4 Outlook – Full Structure & Macro | July 21, 2025Hello, GoldMinds! 💙
After a volatile week, gold remains caught in a wide H4 range, ping-ponging between structural supply and demand. Let’s break down the current picture so you can navigate the next big moves with confidence.
🌍 Macro & Bias
Macro context:
Last week’s US CPI print triggered a temporary rally, but gold failed to hold above resistance and quickly reversed as the dollar strengthened. Next week brings Fed Chair Powell’s testimony, global PMI numbers, and jobless claims—all catalysts for new volatility.
Bias:
Neutral on H4:
Gold is consolidating inside a broad sideways range.
The market is waiting for a catalyst to break above 3375 or below 3310 before showing a real trend.
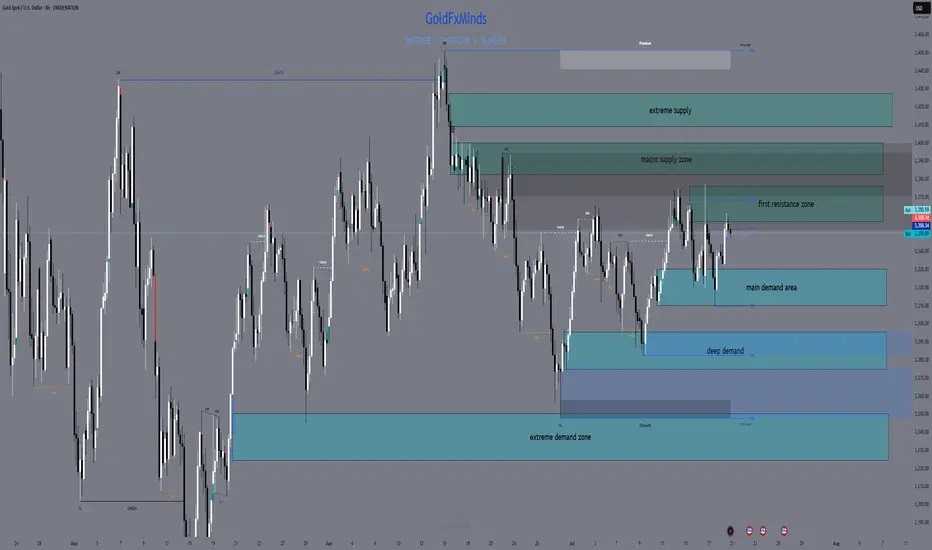
🔸 Structural Key Supply Zones (Above Price)
1️⃣ 3357–3375 | Main H4 Supply
Why it matters:
Aggressive NY and CPI rallies have been sold off here; price rejected every attempt to close above 3375. OB, liquidity cluster, inducement—this is the first real ceiling above price.
Trade logic:
Watch for M15/H1 reversal or exhaustion. No clean break = supply remains active.
2️⃣ 3384–3400 | Macro Supply
Why it matters:
All failed breakouts from early summer were stopped in this block. Liquidity pool and macro OB; every test led to sharp pullbacks.
Trade logic:
Avoid FOMO—only short with confirmation of rejection.
3️⃣ 3410–3425 | Extreme Supply
Why it matters:
The final upper ceiling for now. Any spike here is likely to see big profit-taking and volatility.
🔹 Structural Key Demand Zones (Below Price)
1️⃣ 3330–3310 | Main H4 Demand
Why it matters:
All major dips last week bounced here—bulls are active in this OB. It’s the base of the current “micro-range,” with clear LTF inducement and high volume.
Trade logic:
Look for bullish reversal (M15/H1) before trusting any long from here.
2️⃣ 3295–3275 | Swing Demand / Discount Zone
Why it matters:
The main structure support for July. Strong OB, historic liquidity sweeps—each deep flush has brought responsive buyers.
Trade logic:
Watch for reaction, but don’t knife-catch without a clear structure break.
3️⃣ 3250–3225 | Extreme Demand / HTF Liquidity Pool
Why it matters:
The “final line” for bulls. This zone has absorbed all major liquidations and created swing reversals since early spring.
📊 H4 Structure Logic
Current play:
Gold is stuck in a structural cage between 3375 and 3310.
Until price closes outside these edges, every spike is likely a liquidity hunt.
Pro move:
Only react to confirmation in these zones—don’t force trades in the mid-range!
🧠 Game Plan
Set alerts at each supply & demand zone.
Wait for confirmation: M15/H1 CHoCH, BOS, wicks, or volume.
Let the news come to you: Powell & PMI will likely force a test of an edge; be patient.
💬 What’s your bias for the week? Drop it below and tag a friend!
🚀🚀🚀 and Follow GoldFxMinds for sniper-level gold planning and deep-dive SMC education.
Posted using the Trade Nation broker feed as part of their influencer program for using their TradingView charts in educational content.
— GoldFxMinds 💙
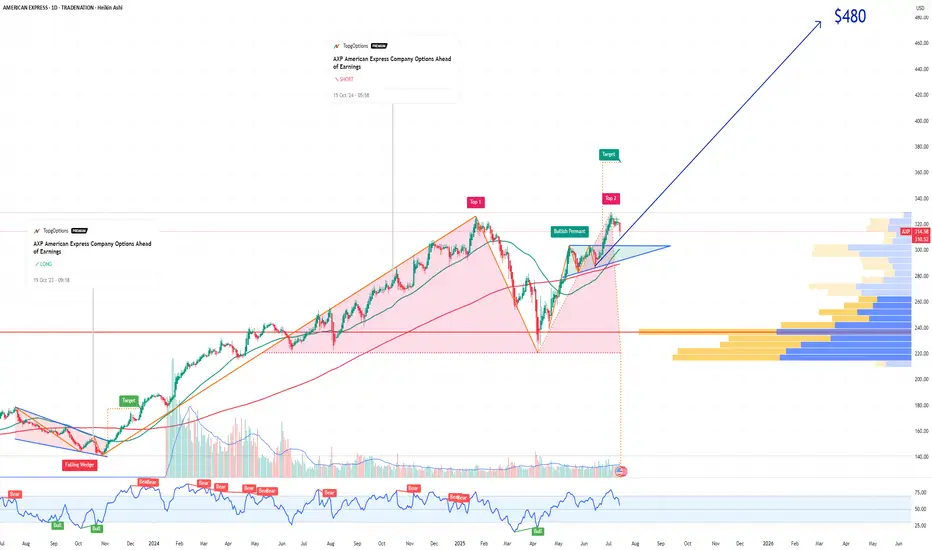
AXP American Express Company Options Ahead of EarningsIf you haven`t bought AXP before the rally:
Now analyzing the options chain and the chart patterns of AXP American Express Company prior to the earnings report this week,
I would consider purchasing the 480usd strike price Calls with
an expiration date of 2027-1-15,
for a premium of approximately $6.25.
If these options prove to be profitable prior to the earnings release, I would sell at least half of them.
Disclosure: I am part of Trade Nation's Influencer program and receive a monthly fee for using their TradingView charts in my analysis.
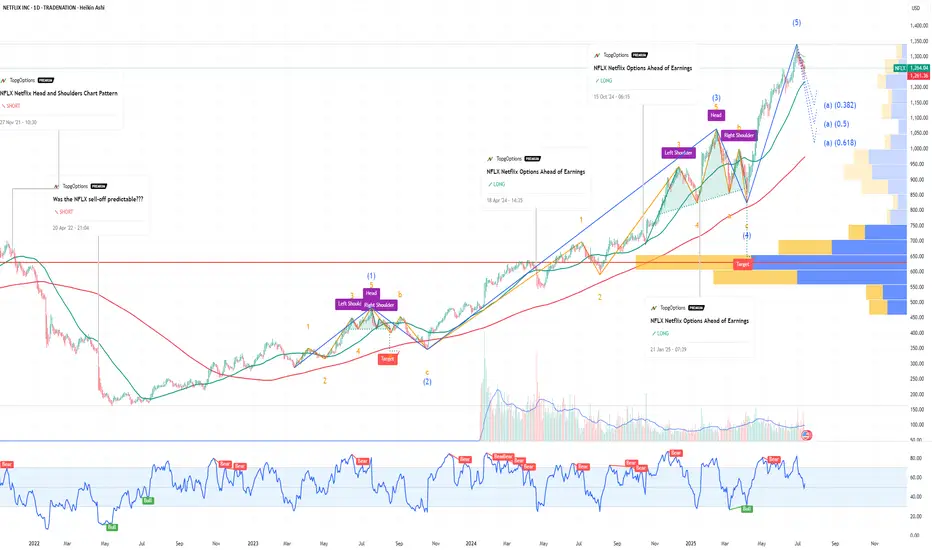
NFLX Netflix Options Ahead of EarningsIf you haven`t bought NFLX before the previous earnings:
Now analyzing the options chain and the chart patterns of NFLX Netflix prior to the earnings report this week,
I would consider purchasing the 1260usd strike price Puts with
an expiration date of 2025-9-19,
for a premium of approximately $71.10.
If these options prove to be profitable prior to the earnings release, I would sell at least half of them.
Disclosure: I am part of Trade Nation's Influencer program and receive a monthly fee for using their TradingView charts in my analysis.
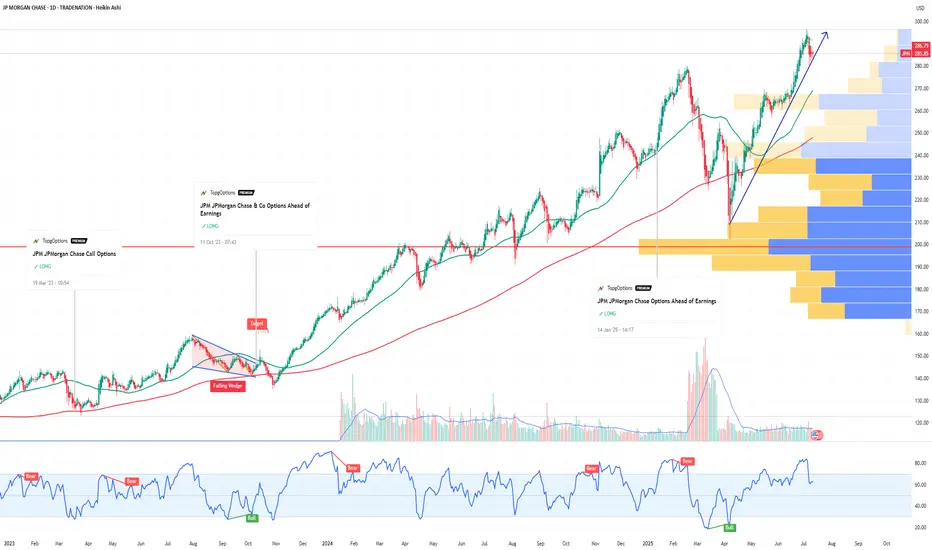
JPM JPMorgan Chase & Co Options Ahead of EarningsIf you haven`t bought JPM befor the rally:
Now analyzing the options chain and the chart patterns of JPM JPMorgan Chase & Co prior to the earnings report this week,
I would consider purchasing the 290usd strike price Calls with
an expiration date of 2026-1-16,
for a premium of approximately $20.20.
If these options prove to be profitable prior to the earnings release, I would sell at least half of them.
Disclosure: I am part of Trade Nation's Influencer program and receive a monthly fee for using their TradingView charts in my analysis.
GBPJPY sitting at resistance – Is a drop to 193.360 likely?GBPJPY is sitting right at a key daily resistance zone. This is a level where it has struggled to break through and reversed strongly to the downside. So this makes it definitely one to monitor, especially if you’re eyeing potential short setups.
If we start seeing signs that the price is getting rejected here: like long wicks, strong bearish candles, it could be the early indication of another move lower. My focus is on a moderate drop toward the 193.360 area, similar to what we’ve seen in past pullbacks. Nothing too dramatic, just a simple downside play if sellers step in again.
But if we get a strong breakout? That changes everything: it would hint that bulls are taking full control. This area is pretty important and could give us a better idea of where price is headed next.
Just sharing my thoughts on support and resistance, this isn’t financial advice. Always confirm your setups and manage your risk properly.
Disclosure: I am part of Trade Nation's Influencer program and receive a monthly fee for using their TradingView charts in my analysis.

AAPL Poised for Continued GrowthIf you haven`t bought AAPL before the rally:
What to consider now:
1. AI-Driven iPhone Upgrade CycleApple’s integration of Apple Intelligence, its proprietary AI platform, is set to catalyze a significant iPhone replacement cycle. Posts on X highlight positive sentiment around AI-driven demand, with estimates suggesting a 40% year-over-year surge in iPhone shipments in China during May 2024, signaling strong consumer interest. New AI features, such as on-device processing for enhanced privacy and functionality, are expected to drive accelerated hardware upgrades. Analysts, including Bernstein, project these features could boost upgrade rates, with even a 1% increase in upgrades driving meaningful revenue growth. With the iPhone 15 and future iterations leveraging AI, Apple is likely to capture pent-up demand, as noted by industry observers who see long-term revenue growth from its 7% year-over-year increase in active installed base.
2. Strong Ecosystem and Services GrowthApple’s ecosystem—spanning iPhones, iPads, Macs, and wearables—continues to drive customer loyalty and recurring revenue. The company reported record services growth in Q2 2025, with revenue reaching $95.4 billion, up 5% year-over-year. Services like Apple Music, iCloud, and Apple TV+ benefit from the growing active device base, which ensures sticky, high-margin revenue streams. This ecosystem strength mitigates concerns about short-term iPhone sales fluctuations, as Apple captures upgrade revenue over time. The seamless integration of hardware and services creates a moat that competitors struggle to replicate, reinforcing AAPL’s long-term growth potential.
3. Technical Bullish MomentumFrom a technical perspective, AAPL exhibits strong bullish patterns across multiple timeframes. TradingView analyses point to a rising bullish channel, with higher highs and higher lows signaling sustained upward momentum. Key bullish patterns, such as an ascending wedge and triangle, are forming around current price levels, suggesting potential breakouts. For instance, if AAPL clears $203.21 with volume, it could target $204.98 or higher, with some analyses eyeing $240 as a near-term resistance. Technical indicators like a rising RSI and MACD convergence further support short-term bullish momentum. Despite recent consolidation, reduced volatility and a strong setup pattern indicate AAPL is primed for a breakout.
4. Analyst Optimism and Market SentimentAnalyst sentiment remains overwhelmingly positive, with a consensus “Buy” rating and a 12-month price target of $228.85, implying a 14.05% upside from the current price of $200.66 as of June 2025. Hedge funds like Third Point see “significant” upside, driven by AI features that could meaningfully boost earnings. Bernstein’s raised price target to $240 reflects confidence in Apple’s ability to monetize AI through hardware and services. Posts on X also highlight investor optimism, with AAPL’s $350 billion market cap increase in a single day underscoring strong market confidence in its AI-driven growth chapter.
5. Global Expansion and Emerging MarketsApple’s growth in emerging markets, particularly India and China, bolsters its bullish case. Improved guidance for December 2023, driven by iPhone 15 adoption and India’s market potential, signals untapped opportunities. Apple’s ability to penetrate these high-growth regions, combined with its premium brand appeal, positions it to capture a larger share of global smartphone and tech markets.
Disclosure: I am part of Trade Nation's Influencer program and receive a monthly fee for using their TradingView charts in my analysis.

USD/CHF Bearish Rejection Setup – Short Opportunity1. Market Context & Structure
The USD/CHF currency pair is currently exhibiting a bearish market structure on the 1-hour chart. After a sharp decline from the 0.8360+ level, the price has attempted to recover but remains in a corrective phase. This recovery appears to be forming lower highs and is approaching a key resistance zone. The overall structure shows a series of sharp drops followed by weaker upward retracements, a classic sign of sellers still being in control. The current rise toward the 0.8300–0.8310 level is likely a corrective move, not a reversal, and could act as an ideal zone for a fresh bearish entry.
2. Key Technical Zones
Three key price zones define this setup. The first is the resistance zone between 0.8300 and 0.8310, marked with a red box. This area has previously acted as a strong supply zone where price faced heavy selling pressure, and it is likely to be respected again. The second important area is the intermediate support between 0.8210 and 0.8225, which could serve as a partial target for profit booking or re-entry on bounce. Finally, the major demand zone lies around 0.8160 to 0.8175, a level where price previously paused before resuming upward correction. These zones collectively provide logical stop loss and target levels for managing the trade with discipline.
3. Trading Plan (Sell Setup)
The trade idea here is to initiate a short position as the price enters the 0.8300–0.8310 resistance zone. This level aligns with the previous high and the edge of a well-defined supply area. A stop loss should be placed slightly above the resistance zone—around 0.8330—to avoid getting stopped out by minor spikes or false breakouts. For targets, the first take-profit can be at 0.8225, near the intermediate support zone. If bearish momentum continues, the next logical target is at 0.8175, which aligns with previous price rejections. This plan offers a clean setup with a favorable risk-to-reward ratio of at least 1:2 or higher, depending on the exact entry and target levels.
4. Confluences Supporting the Trade
Several technical factors strengthen the case for a short position at the identified level. First, the price is moving within a downtrend, confirmed by the lower highs and lower lows. The approach toward the resistance zone appears to be a corrective wave, not a breakout. Second, the chart shows a potential M-pattern formation, where the second peak aligns closely with the previous one, indicating a likely double-top scenario. Moreover, price previously reversed sharply from this resistance zone, and similar rejection candles could appear again. This confluence of trend, price action patterns, and zone-based analysis strongly supports the bearish outlook.
5. Expected Move
Based on the current structure, once price reaches the resistance at 0.8300–0.8310, a rejection is expected. This could lead to a pullback first to the 0.8225 support area. If this level is broken with momentum, a continued decline toward the 0.8175–0.8160 zone is highly probable. This move aligns with the overall bearish trend and would complete the projected wave structure shown in the chart. Traders should watch for signs of reversal (bearish engulfing, rejection wicks) at resistance to confirm entry.
6. Trade Management
Proper trade management is key to success with this setup. Once the position is live, it's recommended to book partial profits around the 0.8225 level to secure gains. The stop loss can then be moved to breakeven or entry price to make the trade risk-free. If price bounces from this level, re-entry opportunities can be evaluated with tighter stop-losses. If the move continues beyond 0.8225, the position should be held toward the 0.8175 target with trailing stop-loss adjustments. Also, traders should be cautious around high-impact USD or CHF news events, which can cause volatility and invalidate technical levels.
===================================================================
Disclosure: I am part of Trade Nation's Influencer program and receive a monthly fee for using their TradingView charts in my analysis.

EURUSD update 7.05.2025Short-term growth to the resistance zone (~1.1400-1.1420),
Then, there was a reversal and impulsive fall—a break of support, further decline to levels below 1.1200, possibly to a Value Area Low.
Conclusion:
This is a bearish scenario, with a trap for longists at the resistance area and an emphasis on liquidity capture under support levels.
Best regards, EXCAVO
_____________________
Disclosure: I am part of Trade Nation's Influencer program and receive a monthly fee for using their TradingView charts in my analysis.

XAUUSD Price Compression: Ready to Roar or Retreat?The 15-Min chart of XAUUSD is showcasing a classic symmetrical triangle pattern, characterized by converging trendlines—a series of lower highs forming the descending resistance (red zone) and higher lows creating the ascending support (green zone).
This price compression is typically seen before a major breakout, as the market consolidates and traders await a decisive move
Key Highlights:
🔻 Resistance Zone (Red):
Price repeatedly rejects the downward-sloping resistance line.
Each lower high is marked with red arrows, confirming seller dominance at those levels.
Also aligned near the 200 EMA (red line), which adds dynamic resistance.
🟢 Support Zone (Green):
Buyers have consistently stepped in at rising lows, forming a steady uptrend base.
This support is acting as a launchpad, compressing the price within the triangle.
Positioned near the 50 EMA (blue line), reinforcing this support region.
📈 EMAs (Trend Context):
50 EMA below 200 EMA indicates the broader trend remains bearish.
However, price consolidating near both EMAs suggests a potential trend shift if resistance breaks.
Breakout Scenarios to Watch:
✅ Bullish Breakout Potential:
A confirmed candle close above the resistance zone with volume may ignite a rally.
Immediate upside target levels: $3,360, $3,390, and potentially $3,420+.
Would indicate short-term trend reversal and fresh bullish momentum.
❌ Bearish Breakdown Risk:
A break below the ascending support line could trigger aggressive sell-offs.
Downside target levels: $3,290, $3,260, and deeper toward $3,210.
Would validate continuation of the prior downtrend.
📊 Trading Strategy Suggestions:
Breakout traders may wait for a confirmed candle close outside the triangle (with volume).
Range traders can look for bounce trades near support and rejections at resistance until breakout occurs.
Use tight stop-losses due to narrowing range and likely sharp post-breakout volatility.
Consider risk-reward ratio minimum 1:2 when targeting breakouts.
------------------------------------------------------------------------------------------
Disclosure:
I am a participant in TradeNation's Influencer Program and receive a monthly compensation for utilising their TradingView charts in my market analysis.
------------------------------------------------------------------------------------------

NZDUSD - Bearish Control Soon!Hello TradingView Family / Fellow Traders. This is Richard, also known as theSignalyst.
📈NZDUSD has been hovering within a big range between $0.55 support and $0.59 resistance.
Currently, NZDUSD is retesting the upper bound of the wedge marked in blue.
Moreover, the $0.59 is a strong daily resistance zone.
🏹 Thus, the highlighted red circle is a strong area to look for sell setups as it is the intersection of the upper blue trendline and green resistance.
📚 As per my trading style:
As #NZDUSD is hovering around the red circle zone, I will be looking for bearish reversal setups (like a double top pattern, trendline break , and so on...)
📚 Always follow your trading plan regarding entry, risk management, and trade management.
Good luck!
All Strategies Are Good; If Managed Properly!
~Rich
Disclosure: I am part of Trade Nation's Influencer program and receive a monthly fee for using their TradingView charts in my analysis.

SP500 In Reverse: Unpacking the latest markets setbackThe SP500 continued its decline on Friday. The downward price action is now very violent and could continue in the coming days as well. No signs of recovery still..

SP500 Plunges 8% in a day!! Oversold or more pain ahead?The SP500 has suffered a massive 8% drop, currently trading around 5158 at the moment, after market turmoil triggered by Trump's new tariff war. Panic selling has pushed the 30-minute RSIto an extreme oversold level of around 28, signaling potential short-term exhaustion.
Possible Scenarios:
🔹 Short-Term Bounce? The RSI suggests a possible technical rebound, with key resistance around 5200-5250 if buyers step in. Watch for volume confirmation.
🔹 Further Downside? If panic continues, the next major support lies at 5100, followed by 5000 psychological level, where institutional buyers might defend price.
⚠️ Caution: Markets remain highly volatile! A dead-cat bounce is possible, but uncertainty surrounding tariffs could fuel more downside pressure. Stay sharp!
📊 What’s Your Take? Will SP500 recover or break lower? Drop your thoughts below! 🚀🔥
#SP500 #StockMarketCrash #Tariffs #Trading #TechnicalAnalysis #RSI

EURUSD update 20.03After a successful swing long
that was taken
We've reached external liquidity
Now, I expect a correction to the green box; from it, we will go even higher—reaching liquidity from above.
The current correction will take some time to form. It may happen faster, but I have indicated the targets on the chart.
Best regards EXCAVO

EURUSD Surges to 1.10 levels post-Trump Tariffs: BUY or SELL?Current Situation:
EUR/USD spiked to 1.10 levels(up sharply) following Trump’s tariff announcement, defying initial expectations of short-term USD strength. This suggests markets are pricing in long-term risks to the USD (growth fears, retaliatory tariffs) faster than anticipated.
Key Drivers Behind the Move:
1. Tariff Backfire Risk: Investors may fear tariffs will hurt U.S. growth more than Europe’s, weakening the USD.
2. ECB vs. Fed Policy Shift: Bets that the **Fed could cut rates sooner** if tariffs slow U.S. inflation/growth, while the ECB delays cuts.
3. Retaliation Bets: Expectations of aggressive EU countermeasures (e.g., tariffs on U.S. tech/agriculture) boosting EUR sentiment.
---
Technical Analysis (EUR/USD Daily Chart)
- ✅ Breakout Confirmed : Price surged till 2024's resistance, now testing 1.10 levels (psychological levels).
- RSI: Overbought, suggesting short-term pullback risk.
#EURUSD #TrumpTariffs #ForexTrading #Breakout #USDweakness

EURUSD - Bullish No More!Hello TradingView Family / Fellow Traders. This is Richard, also known as theSignalyst.
📈 EURUSD has been overall bullish, trading within the rising channel, however it is currently retesting the upper bound of the channel.
Moreover, the red zone is the upper bound of its weekly range.
🏹 Thus, the highlighted red circle is a strong area to look for sell setups as it is the intersection of the structure and upper red trendline acting as a non-horizontal resistance.
📚 As per my trading style:
As #EURUSD approaches the red circle, I will be looking for bearish reversal setups (like a double top pattern, trendline break , and so on...)
📚 Always follow your trading plan regarding entry, risk management, and trade management.
Good luck!
All Strategies Are Good; If Managed Properly!
~Rich
Disclosure: I am part of Trade Nation's Influencer program and receive a monthly fee for using their TradingView charts in my analysis.
