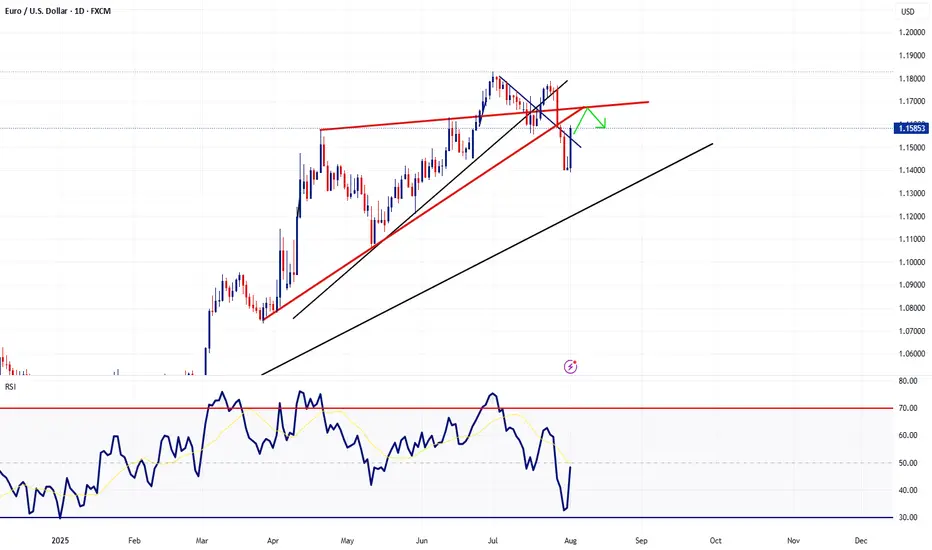
EURUSD - Scaling into Confluence ZoneTaking a look at EURUSD on the daily timeframe we had quite the rebound in EURUSD last Friday following the NFP report. However price action is now heading towards a cluster of resistance levels which is why I'm implement my scaling in technique using a specially designed and programmed EA that i use for MT5.
== TRADE PLAN ==
Scale-in with short positions and target a 0.5% growth on the account. In other words, once the basket arrives in profit by 0.5% CLOSE ALL.
Trade Safe - Trade Well
Tradeplan
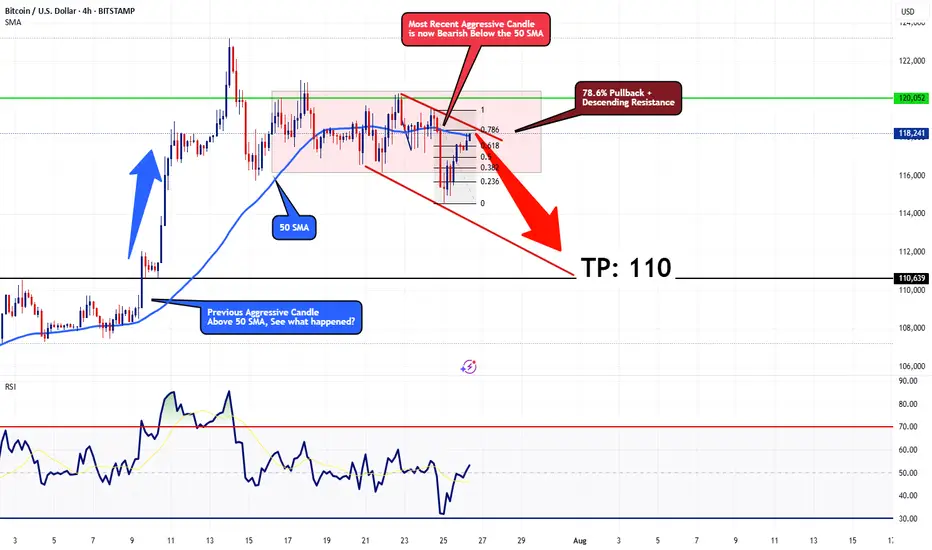
Bearish Outlook for BTCUSDOn the 4-hour timeframe, Bitcoin seems to be starting a corrective phase, likely moving toward the $110 mark. Current price action is facing resistance at a descending trendline, aligned with the 78.6% Fibonacci retracement level, which should limit any short-term upward moves. The price is also trading below the 50-period SMA, with a strong bearish candle from a few sessions back supporting the downward trend.
For a bullish outlook to take hold, Bitcoin would need to decisively break above the 78.6% Fibonacci level with a robust bullish candle closing above the 50 SMA. Until that happens, I remain bearish, with a target of $110.
This technical perspective aligns with the scenario where the Federal Reserve opts to maintain interest rates at 4.50% at this Wednesday's FOMC meeting
Stay cautious and trade wisely!
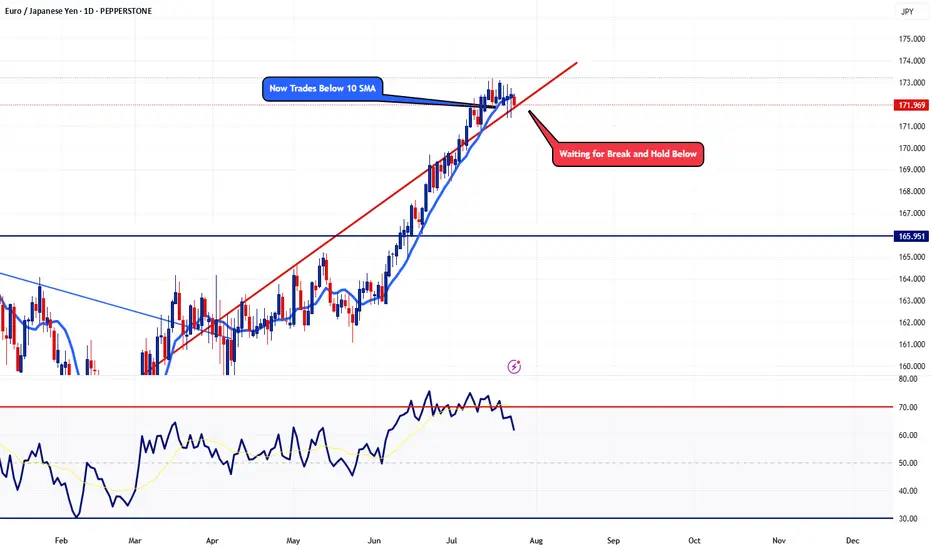
EURJPY - Potential Topping ActionTaking a look at the daily timeframe, price action is now trading below the 10 SMA. This pair has not traded below the 10 SMA since May 26. Now I'm just waiting for a few more confirmation before I'm fully confident. For now, adding a few small sells won't hurt.
Trade Safe - Trade Well
EURUSD Remains Under Pressure Following CPIThis morning, after the US CPI report was released at 8:30 AM EDT, EUR/USD surged briefly due to a slightly weaker-than-expected inflation reading. Despite this, signs of rising inflation persisted, leading EUR/USD to rise sharply before quickly retreating.
EUR/USD has seen an intermediate top at 1.1830 since early July. The euro is under pressure due to looming US tariffs (30% on EU imports, effective August 1) and mixed economic signals, like Eurozone industrial production rising 1.7% in May (vs. 0.9% expected). The pound (GBP) and other currencies are also reacting to tariff concerns.
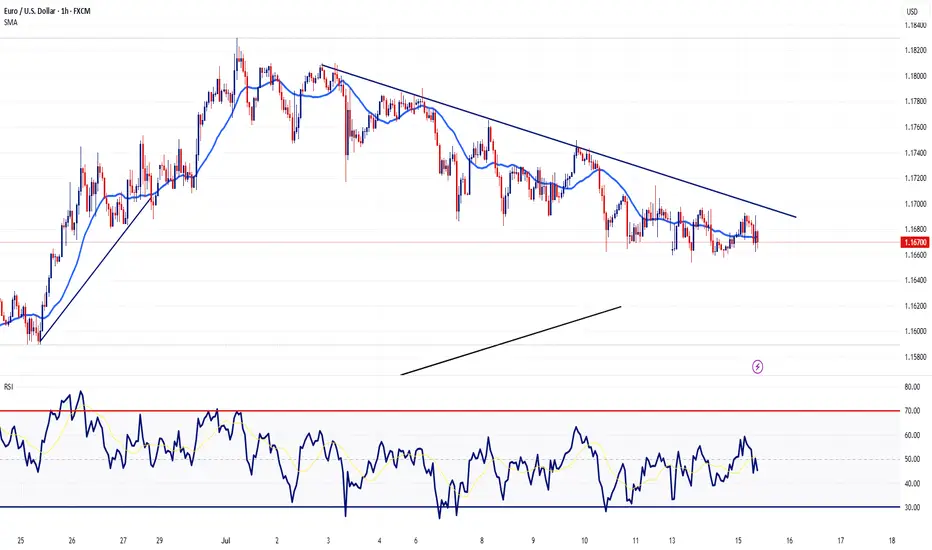
Taking a look at the 1hour chart, you can see we are still trading below a descending trendline. Taking everything into consideration, I'm positioning short sells whenever we get bounce higher.
That's it - That's all - Trade Safe
BTC - Zoomed Out ScenarioAs predicted DXY has broken down a major monthly bearish trendline - currently finishing a bearish retest before further free fall.
If this plays out we have 2-3 years of a weakening / correcting dollar, and a strengthening investment in assets such as Bitcoin.
This means an extended bull market spanning 2-4 years on Bitcoin and equities.
However - there is a mass amount of liquidity to the uber lows towards 10,000 on BTC.
Market is showing manipulated intention to hit these lows by keeping the price below this bearish cross section - and that’s why bitcoin hasn’t been moving up yet.
This tells me this is more likely than we all think to play out.
I’m trading the following:
Short - 108,200 to 35,000
Long - 35,000 to 80,000
Short - 80,000 to 10,000
Will update accordingly if the plan changes.
Happy trading.

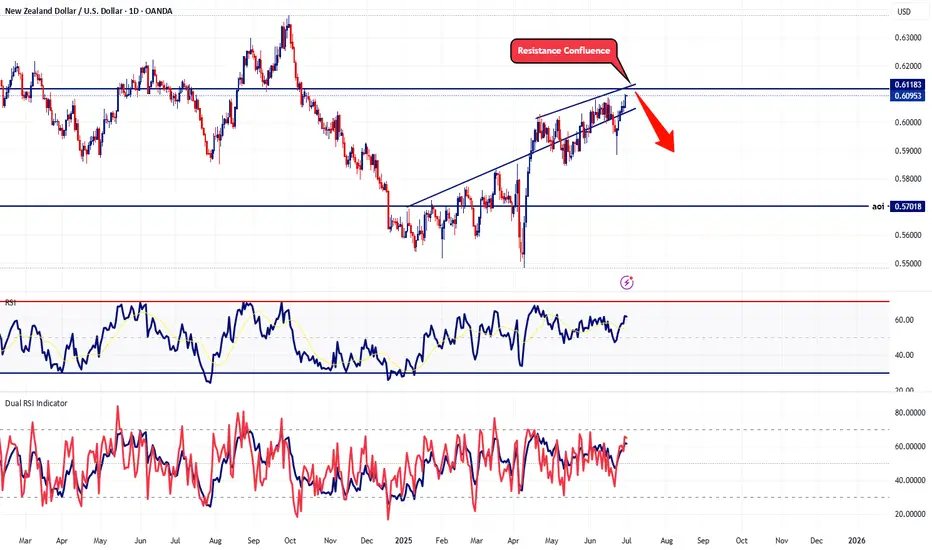
Preparing to Short Sell NZDUSD - Large LotsThis pair doesn't really get much attention but the fact is that the US is the strongest country of the majors while New Zealand is actually the weakest. When I pooled together all the economic data, these are the facts.
With that said, this pair is approaching a significant confluence resistance territory and it's highly unlikely to break above. Needless to say, I'm preparing to start scaling shorts with this pair. As I mentioned in the title, since this pair doesn't get much daily pip action, I'll be increasing my lot sizes to make up the difference.
That's it - That's all
Trade Safe
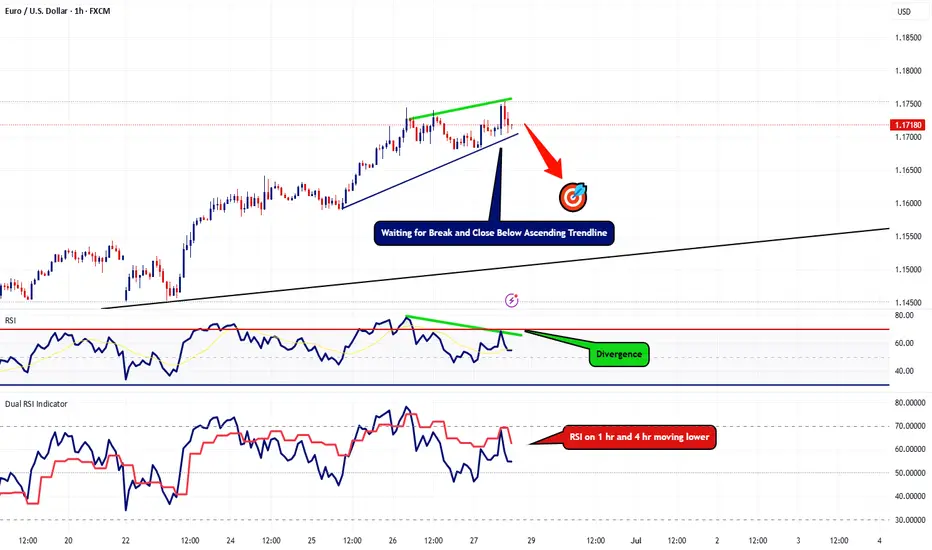
EURUSD Lots of Bearish Clues Popping UpThis is an update to my last post, I'm still waiting for that 4hr candle to close below the last. However, now I'm starting to spot more bearish indications on the 1hr timeframe.
First thing I'm noticing is the RSI divergence show that the bullish strength is weakening. RSI on the 4hr + the 1hr are heading lower. Now I'm still waiting for that 4 hour to close below the last but I also want to see this ascending trendline break and hold below as well.
In the event we break below this trendline, I'll be looking to go short with my target plotted on the chart.
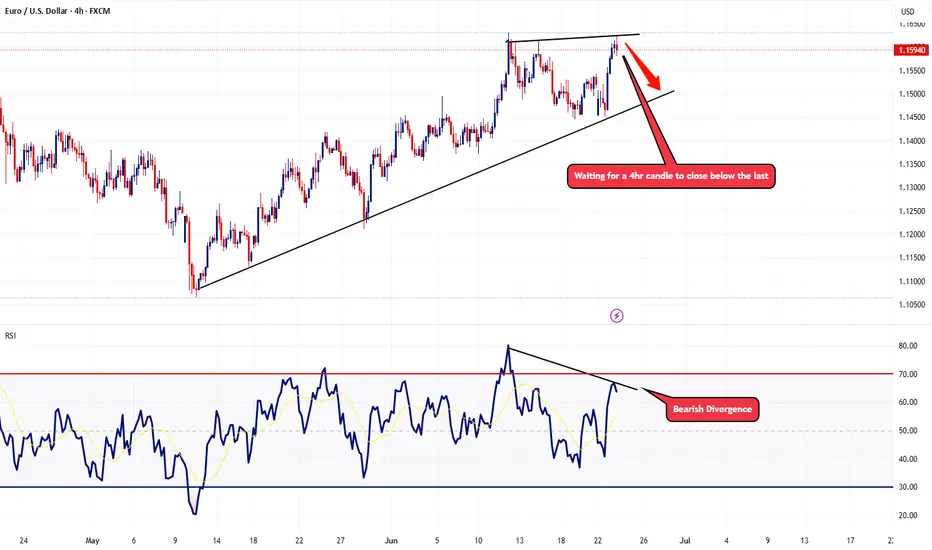
EURUSD Potential Topping ActionTaking a look at the 4hr chart, RSI is showing signs that the bullish momentum is starting to fade with the bearish divergence. In the event we get a 4hr candle that closes below the last, I'll be looking to start scaling some short positions with this pair.
Trade Safe - Trade Well.
Intraday Playbook ES Futures: Trade Setup & Context CME_MINI:ES1!
Big Picture Context
Please see related trade idea.
In this analysis, we refine our intraday levels to identify potential trade setups. We also review recent price action and present a high-probability long trade example that frequently offers favorable risk-reward dynamics when it plays out successfully.
See chart image below reviewing yesterday’s long trade opportunity.
Example Trade Setup: SFP Long
Time frame: 1 hour or 30 mins
• Entry: 5612
• Stop: 5595.50 (below SFP candle)
• Target: 5682 (mCVAH — confluence with recent highs)
• Risk: 66 ticks
• Reward: 280 ticks
• Risk/Reward Ratio: 4.2 R
Note: Past performance is not indicative of future results.
________________________________________
Intraday Market Structure Review
What has the market done?
• ES Futures have rallied and reclaimed a key technical level.
• Currently trading above:
o March 2025 low
o 2025 mid-year level
o Developing Value Area Low (VAL) for the 2025 Volume Profile
What is the market trying to do?
• Recover prior months' losses.
• Price action is climbing steadily, establishing higher lows.
How well is it doing?
• Despite headline risks, ES futures show resilience.
• Price has painted green candles in the full session for the past 10 consecutive days—a strong bullish structure.
________________________________________
What Is More Likely to Happen from Here?
Scenario 1: Pullback and Continuation Higher
A pullback toward the 0.618 Fib retracement and mCVAH confluence could offer another long setup, targeting the April 2nd high. This is further supported by NQ already reclaiming those highs, with ES still lagging but showing strength.
Example Trade Idea:
Time frame: 1 hour or 30 mins
• Entry: 5688
• Stop: 5680
• Target: 5724 (May 2 High)
• Risk: 32 ticks
• Reward: 144 ticks
• Risk/Reward Ratio: 4.5 R
Target may be adjusted if relative volume and delta support strong momentum toward April 2nd highs.
________________________________________
Scenario 2: Further Consolidation
• Sellers push prices back into last week's balance/value area.
• Market consolidates and builds energy for a likely next leg higher.
• No short setup is presented, as current risk and stop placement do not justify initiating short positions.
Important Notes:
• These are example trade ideas not intended to be a recommendation to trade, and traders are encouraged to do their own analysis and preparation before entering any positions.
• Stop losses are not guaranteed to trigger at specified levels, and actual losses may exceed predetermined stop levels.

Play on Levels
Plan1
Buy around 118 - 121
Sell around 130 - 132
Stoploss 110
Plan2
Buy above 142
Sell around 149-150
Stoploss 136

Yen Outlook: Preparing for the Coming Week! During the recent short trading week, we did not observe significant changes in the portfolios of major players. No outflows or overbought conditions—this indicates that the targets remain unchanged, and we are getting closer to the 0.0072 mark. 📊
I recall how, back in mid-December of last year, we noticed the first signs of volume accumulation in the portfolio. It felt like discovering a new horizon! We shared this insight with our subscribers, allowing us to prepare a plan in advance and identify well-founded entry points for the rise of the yen futures. 🚀
Currently, as we maintain a long position on the futures (or a short on the dollar/yen pair), it is essential to keep in mind the boundaries of the expected volatility range.
We have marked these on the chart: the yellow rectangle for Monday and the red rectangle for the upcoming week. 📅
Given the sustained positive sentiment surrounding yen futures, opening a long position as the price approaches the lower boundary of the range could present an excellent opportunity . As indicated by the arrows on the screenshot, don’t miss your chance! 🎯
Summary, we see that the yen continues to be in focus, and we have a clear action plan. We are holding our long position, monitoring the range boundaries, and preparing for the opportunities the market presents. 🌈
No Valuable Data, No Edge!

CADJPY - Buy with Target at 108This is a pretty good setup when taking everything into consideration. BOC on Wednesday likely to add additional strength to the Loonie from the tariffs. Earnings also adds more fire power towards this pair gaining in value along with Gold, looks like it wants to top off.

GBPUSD - The Trend is Your FriendWaiting for a bullish pullback to sell around the 1.29 handle.
Trade Safe - Trade Well. God Bless...

EURUSD Likely to Trend LowerPotential head and shoulders build up for EURUSD with the latest sentiment from Trump and is continuation pattern with the tariffs. This Friday earning season kicks off which may soften EURUSD from dropping off a cliff. Also talks of 1.25% cuts from the Fed by year end may add some additional cushion for this pair. For this reason, my downside target remains on the ascending trendline.
Trade Safe - Trade Well

BTC Under Pressure. More downside RiskBTC trading in a descending channel on the daily timeframe. Trade wars are weighing down equities as well as Bitcoin. Until the tariff narrative changes, expect further downside with BTC.
Trade Safe - Trade Well. DM for account management
~Michael Harding

EURJPY - Buy Trade SetupIf risk-on sentiment prevails, I expect to see further upside with EURJPY towards the 165 handle. Should technicals breaks back below the most recent bullish breakout, I most likely will lose confidence confidence and trim my lose. For now, I'm bullish ~ Know thy self
Leave a comment below, let me know what you think. Share with friends. Check out my profile for more awesome trade plans and setups. DM for copy trading, use any regulated FX broker.
Trade Safe - Trade Well
~Michael Harding

AUDNZD - Sell Trade SetupTaking a look at AUDNZD on the daily timeframe, price action has pulled back to a key level of resistance. Unless something significant happens, there's no rational or fundamental reason for this pair to breakout to the upside. For this reason, I'm interested in short selling this pair.
Leave a comment below, let me know what you think. Share with friends. Check out my profile for more awesome trade plans and setups. DM for account management
Trade Safe - Trade Well
~Michael Harding

EURJPY - Sell Trade SetupLooking to go short. Waiting for slight pullback to upside to then sell.
Leave a comment below, let me know what you think. Share with friends. Check out my profile for more awesome trade plans and setups
Trade Safe - Trade Well.
~Michael Harding CEO at LEFTURN

EURUSD Sell Setup Target 1.06 HandleLooking to go short. Waiting for slight pullback to upside to then sell.
Leave a comment below, let me know what you think. Share with friends. Check out my profile for more awesome trade plans and setups
Trade Safe - Trade Well.
~Michael Harding CEO at LEFTURN

AUDCAD - Sell Trade SetupLooking to go short. Waiting for slight pullback to upside to then sell.
Leave a comment below, let me know what you think. Share with friends. Check out my profile for more awesome trade plans and setups
Trade Safe - Trade Well.
~Michael Harding CEO at LEFTURN

US30 - Trade Setup for Next WeekStrong selloffs usually have a pullback with a possible opportunity to enter on the continuation trend to the downside. With US30, I'm waiting for this setup to play out to short sell in the upcoming trading week.
Trade Safe
~Michael Harding

NZDCAD - Where I see it going nextJust based on simple TA, I foresee this pair moving in a similar direction as displayed on the chart. Let's see accurate I am at future forecasting this pair.
That's it - That's all
Trade Safe.

GOLD Would you like SeekingPips Live Market XAUUSD analysis?🟢SeekingPips🟢 has just learned that I am able to make CHART ANALYSIS VIDEOS in LIVE market conditions on this platform.🌎
(Yes I am a bit of a DINOSAUR 🦕)
🟢Marking up charts and sharing is great but ANALYSING & marking up charts in live market conditions is a different beast.✅️
⚠️That is one way to filter the TRADERS from the MARKETERS.
🟢SeekingPips🟢 focus is always on the things that matter most I'm really not interested in the FANCY STUFF & NEITHER SHOULD YOU BE.
⭐️I ALWAYS preach TIME over PRICE showing it in real-time is like magic when you see it for yourself⭐️
🌍I am happy to do so maybe twice a week if the interest is there.👍
✅️I'm willing to show the practice what I preach in video format.✅️
ℹ️ I need to see the interaction on my post and chart shares to know that it will be worth the time and effort.
🟢SeekingPips🟢 is still working his way around some of the great tools for use on this platform, I am still being advised every week by some of my followers of some of the tools here on TradingView.
Would shared VIDEOS be appreciated here?❔️
