Traderchamp

CADJPY BEARISH SETUP💱 CAD/JPY Reversal Watch: Bearish Pressure Builds Below Resistance
4-Hour Candlestick Chart – Analysis as of June 30, 2025
The CAD/JPY pair is showing signs of weakening momentum after repeated failures to break above the key 106.000 resistance level. This suggests growing downside pressure and increased chances of a corrective move in the near term.
🔍 Key Technical Levels
🟥 Current Price: 105.481
🚫 Resistance Zone: Around 106.000 — multiple rejections signal seller dominance
🛡️ Key Support Level: 104.000 — acting as the downside magnet
📉 Downward Arrow: Suggests bearish directional sentiment remains intact
🧠 Technical Interpretation
📌 Price action is forming a lower high, a classic sign of a potential short-term reversal.
📌 Repeated failures near the 106.000 mark highlight resistance strength and declining bullish interest.
📌 A drop below 105.000 could intensify downside momentum, with the 104.000 support as the next major level.
📌 For bulls to regain control, the pair must reclaim 106.000 with solid buying volume.

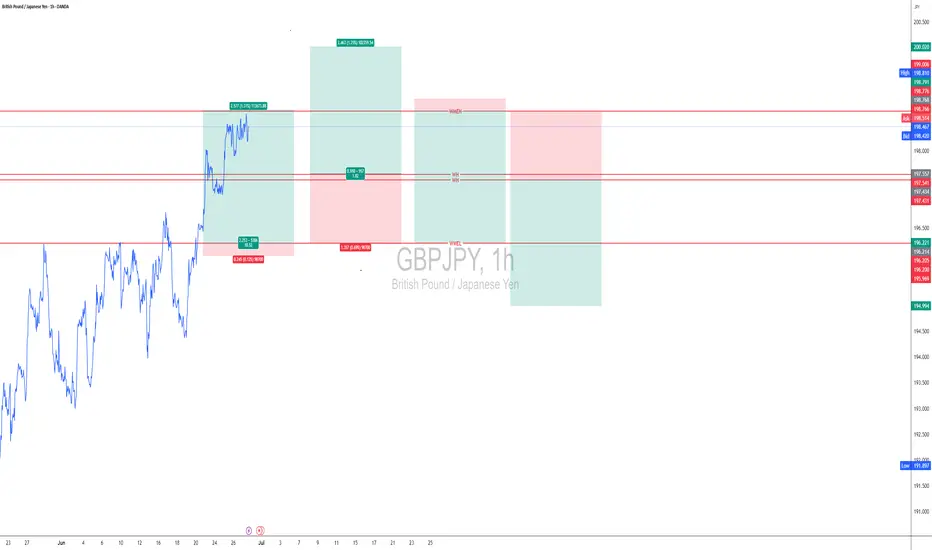
ANALYSIS FOR THE UP COMING DAYS AND WEEK FOR GBPJPY -GJ
Trading involves speculation and probabilities, making market direction predictions challenging. Mastering a strategy that works for you is crucial. Currently, I focus on my strategy to consistently profit.
Here's my analysis for the upcoming days: WH and WL levels indicate market direction. If the price closes above WH by Tuesday, expect an upward trend; if below WL, expect a downward trend.
For trading decisions, enter at WMEL or WMEH levels, or trade between them if you prefer and experienced. Always manage your risk carefully.
Don’t worry about the names, these are the names I have given my strategy:
Week High-WH
Week Low- WL
Week High Margin of Error High - WMEH
Week High Margin of Error Low – WMEl
197.5414432 WH
197.4305568 WL
196.2045568 WMEL
198.7674432 WMEH
GRIFFAIN BEARISH SETUPGRIFFAIN/USDT (1H Chart) – Distribution Phase Signals Short-Term Bearish Reversal
The 1-hour chart of GRIFFAIN/USDT on Binance displays a distribution pattern at the recent high, suggesting bullish exhaustion and an imminent correction. Price has now broken below the consolidation range, confirming a shift in intraday sentiment.
🔍 Key Technical Insights:
Distribution Zone Formed: Price stalled at the top with several failed attempts to push higher, forming a range – a classic sign of distribution before reversal.
Bearish Breakdown: The bearish candle has breached support, initiating a potential downward move toward the 0.5 Fibonacci retracement level.
Key Level to Watch:
Next Target: $0.0400 (50% Fib level + historical demand zone)
Further Support: $0.0360 (Fib 0.786 region)
📉 Outlook & Expectations:
Short-term bias remains bearish below the $0.0458 zone. As long as price stays below the distribution range, expect continuation toward the $0.0400 support area, aligning with key structural and Fibonacci levels.
This setup is ideal for intraday or short-term swing traders watching for pullback entries or breakdown continuation.

XMR BEARISH SETUPWith the recent bearish momentum we have witnessed a breakout on support and the recent pullback can trigger another selling pressure as a continuation of the major bearish trend to the downside.

ZECUSDT BEARISH SETUPIdentified a trend breakout under the daily timeframe which has a potential for a retest back on the key zone highlighted. Expecting a continuation in the bearish trend to follow up price target close to $40.

BITCOIN BEARISH SETUPBitcoin (BTC/USDT) – Breakdown from Double Top Confirms Bearish Trend Continuation
The 4-hour chart of BTC/USDT (Binance Perpetual Contracts) presents a textbook double top formation followed by a confirmed breakdown below structural support levels. The bearish trend has already met its first target, and technicals suggest the move could extend lower toward the key demand zone around $96,000.
🔍 Key Technical Highlights:
Double Top Pattern: Clear double top structure formed between $109,000–$110,000, followed by a strong rejection.
Support Break: Price broke down below key support at ~$105,000, triggering a sell-off and validating the bearish reversal.
Bearish Retest: After the breakdown, price retested the broken trendline (highlighted with a red zone) and failed to reclaim the range.
First Target Hit: Price achieved the first projected support zone at around $101,000.
Next Target: Based on measured move projection and previous structure, the next downside target lies near the $96,000 mark.
📉 Outlook:
The structure remains bearish as long as BTC trades below the broken support-turned-resistance zone (~$105,000). Momentum favors continued downside toward the next key zone unless a significant bullish reversal signal emerges.

CSE ASI BEARISH SETUPThe monthly chart of the CSE All Share Price Index (ASI) reveals a technically significant scenario: the index is currently testing the upper boundary of a long-term ascending channel while also aligning with the 1.618 Fibonacci extension, both of which signal potential reversal pressure ahead.
Key Observations:
Long-Term Resistance: The price is testing the channel’s upper resistance line near the 17,000 – 17,700 zone, where rejection often occurs historically.
Fibonacci Confluence: The current high coincides with the 1.618 Fibonacci extension, a critical level where long rallies often stall or reverse.
Bearish Candlestick Pattern: The formation of a potential bearish reversal candle near the resistance zone is an early signal of seller interest.
Expected Retracement Levels:
Initial support lies at the 0.382 and 0.5 Fibonacci retracement zones, around 15,000 – 14,000.
Deeper correction could target the 0.618 level (~13,000), which aligns with previous breakout structure and the channel midline.
Conclusion:
The ASI appears overextended after a strong bullish leg and is currently showing signs of exhaustion at the top of a multi-year channel. Unless price breaks above and sustains above 17,700, a correction toward the 13,000–14,000 zone is likely, supported by Fibonacci retracement levels and the channel structure.
This presents a potential medium-term bearish outlook for investors and swing traders, with caution advised around current highs.

AUDNZD BULLISH SETUPThe 4-hour chart of AUD/NZD shows a strong bullish breakout from a prolonged consolidation phase, followed by a healthy retest of the breakout level, suggesting the pair is gearing up for further upside.
Key Observations:
Consolidation Breakout: After spending several weeks in a tight consolidation range between 1.0760–1.0800, the price has convincingly broken above the range resistance near 1.0810.
Key Level Retest: The breakout zone (previous resistance) is now acting as new support, confirmed by multiple rejections (highlighted area).
Bullish Momentum: Structure is forming higher highs and higher lows, indicating continuation of upward trend.
Upside Target: With the breakout holding, the next logical target lies near the resistance zone around 1.0910, which served as a previous swing high.
Conclusion:
AUD/NZD is showing bullish strength after breaking out of consolidation and holding above the retested key level. As long as 1.0800–1.0810 support holds, the pair remains poised for a bullish continuation toward the 1.0900–1.0920 resistance zone. A break below this level would invalidate the setup and bring price back into the previous range.

AUDCHF BEARISH SETUPThe AUD/CHF 4-hour chart is presenting a classic Head & Shoulders pattern within a well-defined bearish descending channel, signaling a likely continuation to the downside if neckline support fails.
Key Observations:
Bearish Channel in Play: The broader trend remains bearish, with price action respecting both channel boundaries.
Head & Shoulders Formation: A visible Head & Shoulders pattern has formed near the top of the channel, with the neckline around 0.5275.
Neckline Break Risk: Price is currently testing the neckline area (highlighted in red). A confirmed break below would likely trigger bearish momentum.
Downside Target: A break below the neckline could push AUD/CHF toward the support zone near 0.5220, in line with the lower boundary of the channel.
Trend Structure: Lower highs and lower lows continue to dominate, reinforcing the bearish bias.
Conclusion:
AUD/CHF remains technically weak, and the emerging Head & Shoulders breakdown may act as a strong continuation signal within the existing downtrend channel. A clear close below 0.5270 could open the door for a further drop toward 0.5220. Caution is warranted for bulls unless a significant reversal signal emerges.

AUDCAD BEARISH SETUPThe 4-hour chart for AUD/CAD shows a well-respected bearish descending channel, where price action remains capped below a strong dynamic resistance. Price recently rejected a key resistance zone near 0.8900, signaling a potential continuation to the downside.
Key Observations:
Bearish Channel Intact: Price continues to respect the upper and lower bounds of the descending channel.
Key Resistance Rejection: The pair tested the 0.8900 resistance area and faced immediate rejection (highlighted in red), forming a lower high.
Break of Trendline: A rising trendline from the recent low has been broken, reinforcing bearish pressure.
Support Zone in Sight: If bearish momentum continues, the next major support lies around 0.8780 – 0.8800, offering a possible target area.
Short-term Setup: Minor upward retracement may retest the broken trendline, but unless 0.8900 is breached, the bias remains strongly bearish.
Conclusion:
AUD/CAD remains under bearish control within the descending channel. The recent rejection from the upper boundary and break of the rising trendline suggest a high-probability move toward the 0.8800 support zone. Traders should look for confirmation of lower highs or bearish engulfing patterns to position short.

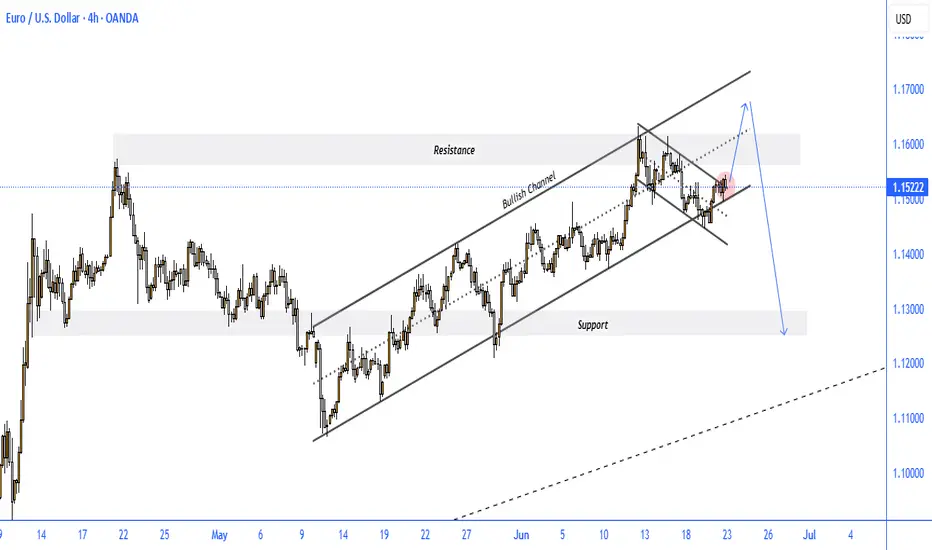
EURUSD BEARISH SETUP
The EUR/USD 4-hour chart reflects a significant technical setup, showing price action within a bullish ascending channel that has recently broken to the downside, forming a falling wedge pattern—typically a bullish continuation signal.
Key Observations:
Bullish Channel Broken: The price broke below the ascending channel earlier this month, signaling initial weakness.
Falling Wedge Formation: A bullish falling wedge has developed, and the pair is now testing its upper boundary near 1.1522, attempting a breakout.
Resistance Zone: The price is approaching a key resistance area between 1.1550 – 1.1600, which aligns with previous highs and the wedge's upper edge.
Scenario Projection:
A temporary bullish breakout toward the resistance zone is expected.
If the pair gets rejected from this resistance, a sharp decline toward the major support area near 1.1300 is likely.
Bearish Confirmation: A clear rejection at the resistance zone followed by a break below the recent minor support (red zone) would confirm the bearish move.
Conclusion:
While short-term bullish momentum may push EUR/USD slightly higher, the confluence of resistance levels suggests a high probability of rejection. Traders should watch for reversal signals in the 1.1550–1.1600 zone, as failure to break higher could lead to a bearish move toward 1.1300 in the coming days.
ETH BULLISH SETUPEthereum has recently broken out bullishly on higher timeframes, signaling a potential move toward the key resistance zone around $3,460. This level holds significant technical importance. The breakout above the hourly flag pattern confirms bullish momentum. As long as price holds above $2,300, the setup remains valid. A drop below this level would invalidate the current bullish outlook.

SMOT BEARISH SETUPWe have witnessed a major resistance zone under the monthly timeframe with multiple price rejections formed close to this area. We are expecting a retracement next, if the price remains unbreakable above the highlighted zone.

GOLD BEARISH SETUPIdentified a breakout on the support / neckline on the head and shoulder pattern under the hourly timeframe. We witness a possibility of a filling the imbalance created inside the 1hour candles close to 3273-3250 region with the continuation of bearish trend expected.

BTC BULLISH SETUPBTCUSDT is looking for a reversal and to take the bullish trend extended towards the FVG formed on top. Under the lower timeframes we have a valid reversal indication identified.

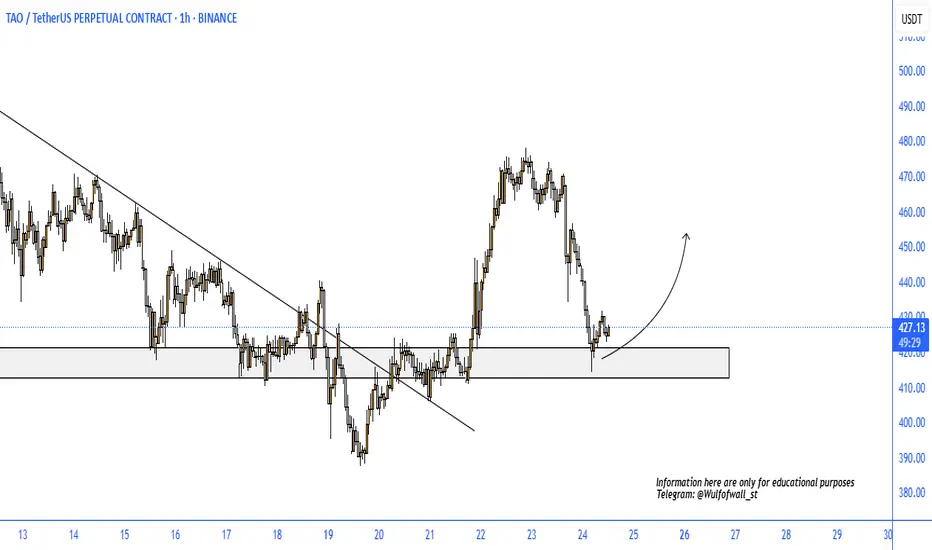
TAO BULLISH SETUPTAOUSDT on a major hourly support, where we are looking for a possible short term reversal for a high accuracy opportunity.
GOLD POSSIBLE REVERSAL ON TREND LINE SUPPORTGOLD holding on a major daily trend line support after a massive decline since last friday! Expecting a recovery with a bullish reversal from the lows of $2970's

Bearish Projection - XAUUSD📉Bearish Projection - XAUUSD
📌On the 4-hour timeframe, the recent bullish trend appears to have completed its fifth wave, reaching the upper boundary of the structure. Additionally, Fibonacci extensions have surpassed the 2.618% level, indicating a potential retracement or corrective phase. Given the strong rally from $2832 to $3146, we anticipate a pullback toward the $2990 - $2945 zone, aligning with the 50%-61.8% Fibonacci retracement levels.
The recent surge in gold prices, driven by escalating trade tensions and geopolitical uncertainty, has led to significant resistance breakouts across multiple timeframes. With the US Jobs data release** scheduled this week, we could see increased momentum supporting a bearish correction for XAUUSD.
➡️Daily Support - 3010-3000
➡️Key Level - 3056-3044
➡️Expected Price Region - 2990-2945
➖➖➖➖➖➖➖➖➖

MASSIVE IMPACT ON GOLD OVER KEY FUNDAMENTALS**Gold (XAUUSD) Market Analysis – Key Fundamentals Driving Volatility**
Gold (XAUUSD) has experienced significant volatility due to major fundamental events impacting the financial markets. The recent large-scale liquidations in stocks and cryptocurrencies, along with the Bybit exchange hack, have contributed to heightened risk sentiment. Additionally, the ongoing US tariff disputes with Canada, Europe, and China have created further uncertainty, weighing on global economic stability.
Following a sharp decline, gold saw a strong recovery after the release of weaker-than-expected Non-Farm Payroll (NFP) data, which raised concerns about the strength of the US economy. On the daily timeframe, a noticeable **market structure shift** has taken place. Price action has filled Fair Value Gaps (FVGs) and tapped into an Order Block (OB), leading to a correction and potential imbalance in the market.
At present, we anticipate a move to the downside, provided key fundamentals align with expectations. The primary factors to monitor include Ukraine’s agreement to a ceasefire, the upcoming **US Consumer Price Index (CPI) data**, and the impact of **US-Canada trade tariffs**. If these events unfold as expected, we may see gold decline toward the established support zones at **$2830 and $2780**.
However, a bullish breakout above the highlighted **4-hour Order Block (OB) in the $2925-$2945 region** would invalidate this bearish outlook. In such a case, gold could push higher, breaking the current market structure.
### **Fundamental Impact on Gold and the Economy:**
1. **Stock & Crypto Liquidations** – Risk-off sentiment has supported gold’s recovery but added volatility.
2. **Bybit Hack** – Raises concerns about crypto security, leading investors to seek safe-haven assets like gold.
3. **US Tariffs (Canada, Europe, China)** – Trade tensions create uncertainty, impacting the US dollar and global demand.
4. **Ukraine Ceasefire** – A reduction in geopolitical risks may weaken gold’s appeal as a safe-haven asset.
5. **US CPI Data** – Inflation data will shape Federal Reserve policy, directly influencing gold prices.
### **Conclusion:**
Gold remains highly sensitive to macroeconomic and geopolitical events. A **sustained rejection** below the $2925-$2945 region supports further downside, targeting $2830-$2780. However, any breach above this level could signal renewed bullish momentum, leading to higher price levels. Traders should closely monitor fundamental developments before confirming a directional bias.

XAUUSD Update – Key Levels in Play!🚀 XAUUSD Update – Key Levels in Play!
📉 Major Support & Rebound
As predicted in our recent analysis, gold found strong support at $2880, triggering a bullish reversal. This move has sent XAUUSD soaring back above $2950, securing a +2.58% gain in the process.
🔥 Technical Setup & Key Observations
✅ Head & Shoulders Formation on Hourly – A clear bearish structure is forming, but confirmation is still required.
✅ Failed Breakout at $2940 – Gold attempted to push higher but failed to hold above resistance, moving back into the range.
✅ Critical Support at $2925 – This is the key level to watch. A confirmed break below could trigger a further drop toward $2900.
📊 What’s Next?
🔹 Bearish Scenario – If price breaks $2925, expect a decline toward $2900, with further downside possible.
🔹 Bullish Invalidations – If XAUUSD reclaims $2940, the head & shoulders pattern fails, and we could see a renewed rally toward $2960+.
🔹 Watch Volume & Momentum – Increased selling pressure will validate the bearish move, while strong buying at key levels may shift the trend.
🎯 Trading Plan & Strategy
📌 Short positions on a confirmed $2925 break, targeting $2900.
📌 Long positions only above $2940, with targets at $2960 and beyond.
📌 Stay cautious—this is a key inflection zone, and price action will dictate the next move.
💡 Gold’s next major move is in the making—are you positioned correctly? 🚀📊

XAUUSD Trade Recap & Next Big Opportunity!⭐️ Premium Club Short Trade @ 2929 - Target Achieved! 💰
Our recent short position from 2929 played out perfectly, hitting all targets with an impressive +290 pips in profit! 🎯
📉 Scalping the Golden Zone
As expected, we capitalized on the key support zone, securing an additional 100-120 pips on a quick long scalp. These fast-moving plays continue to deliver solid returns!
➡️ What’s Next for Gold?
Strong Support Zone Identified – Price has reached a critical demand area, signaling a potential short-term pullback.
1H Order Block Retest – We anticipate a retracement or a possible tag-in before further movement.
Risk-Reward Setup – A well-structured long entry from this zone could yield another profitable trade when markets open Monday.
Major Resistance in Place – Despite a bounce, selling pressure remains strong, and Friday’s momentum suggests further downside in the near term.
📈 Trading Plan:
🕹 Look for long setups at the identified support with a tight SL & proper R:R.
🕹 Keep an eye on the 1H bearish price action for confirmation of a continued move down.
🕹 If resistance holds firm, we could see another strong sell-off later in the week.
💡Stay ready for the next high-probability setup! 🚀

GOLD BEARISH PROJECTIONGold remains in a strong bullish trend, driven by escalating geopolitical tensions. We've seen multiple all-time highs forming as bullish momentum continues. Despite this, the stock market remains resilient at its highs, indicating that investors are not yet aggressively seeking safe-haven assets.
Currently, I’m focusing on the symmetrical triangle and the bullish channel that has formed. Given the price action, a pullback or retracement is likely, especially as the price tests the upper boundary of the channel. A strong rally followed the bullish breakout from the triangle, suggesting that this short-term surge may be reaching its conclusion. I anticipate a pullback to the 38%-50% Fibonacci retracement levels, as indicated on my chart. These levels align with the lower boundary of the channel, which has served as a key support line throughout the recent bullish trend.
