Traderecap
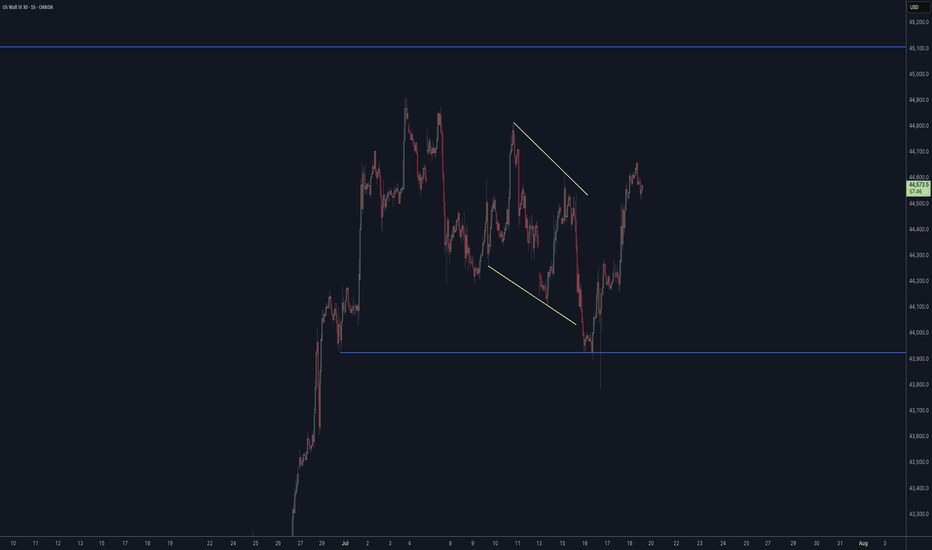
post market analysis/Trade recap 6/28/24Market Recap:
Great technical analysis this week with my predictions in the market.
Yesterday my levels of:
5583.00 (bullish) & 5518.50 (bearish) were almost spot on.
Price went bullish to the level of:
5584.25
Price retreated back to the levels of:
5518.25
Trades Recap:
Not so solid on the trade entries as I got faked out, not seeing the gap being filled rather than an anty setup. That is okay, however soon after I also missed a real Anty setup. It could have been a much better trading day but all in all I am not upset and feeling good for next week.
Sunday I will be posting an analysis for the following week and potential levels to be looking out for. These are levels that I believe have merit and strength.
EURUSD Trade Recap 11th August 2023Breakeven taken on EURUSD last Friday, very happy with the management. Full explanation in the recap.
🧠Emotional Log
---
**Pre-Trade**
I understand all the confluences within my thesis, I accept this risk as I know if it is a loss I clearly understand exactly why I took to the trade. My stop is protected and if price takes me out there is a chance it is forming something else anyway. Do not be greedy, but also do not hesitate. These are the trades I must allow myself to take.
**During Trade**
My stop is protected, allow price to do its thing. My entry is valid, and I understand structure over candlesticks. I utilised the timeframes as best I could, working from the 1H structure filtering down to the 15M without jumping in. Do not choke the trade, mini 90% rule is in play so let price do its thing.
**Post-Trade**
I understand that price created a mini scoop for a much sharper entry, however, how can we guarantee this will always happen. My entry was valid, and stop was protected, I understood the 90% rule kicking in and managed risk accordingly to price action on the 1H. Nothing more I could have done in this situation and capital was protected.
USDJPY Trade Recap 19th July 2023How am I feeling pre-trade?
I am feeling confident in my mind, I forecasted the risk entry and not allowed little things to put me off the trade. Normally I would be saying things like ‘its gone past the hook’, ‘there needs to be a nice retrace or pin bar’ but ultimately it has all of the ingredients to sell. Ascending channel, meets AT hook with a 1H retrace candle. I am happy I did not allow these past issues to overcome my decision, this is also helping with my entry criteria and structure over candlesticks.
BOIL Day Trade Recap and ReviewBOIL the 3x Leveraged ETF of natural gas futures has been highly volatile. Volatility yields high
profits if there are good entries and trade management. This past Friday BOIL was doing a
reverse split ( 20 shares become one) which I considered to be an opportunity for high profit
because a higher number of traders would have eyes on the chart.
The 15-minute chart is shown here with an anchored VWAP from 2 days earlier. At market open
price reversed a downtrend after the reverse split in the premarket. It got support from the line
one standard deviation below the mean VWAP. My first considered entry was the second green
HA candle in the reversal with a stop loss at the pivot low of the red candles. However
I passed on this entry and instead entered upon price crossing the mean VWAP. The entry
was supported by the indicators showing Z score and volatility. The entry was made more
precise by analysis on the 5-minute chart. The stop loss was set at the value of the close of the
last candle to close below VWAP. After that, trade management was routine. Every time
price went up 1% I raised the stop loss by the same amount until getting up 6% Once at that
level, I changed to a trailing stop loss of 2% so I could pay attention to other trading chores.
At the same time, I set an alert for when the price crossed to above two standard deviations
above the mean anchored VWAP. I did this because this is the overvalued overbought area
where institutional traders will set sell orders either short selling or closing profitable
trades. The resultant reversal would diminish my unrealized profits. In this case, I got
the alert and closed the position without the trailing loss. The trade resulted in a profit
of 12% without use of leverage or margin other than the leverage imbedded in BOIL inself.
EUR/JPY, USD/JPY and USD/CAD on watch for me today.EUR/JPY:
• If price pushes up to and ideally just above our rayline, then regardless of how it does so I'll be waiting for a convincing impulse back down followed by a tight flag and then I'll be looking to get short with a reduced risk entry on the break of the flag.
• If this setup doesn't present itself then I will simply wait until another setup which meets my plan materialises.
• If there's any ambiguity then I will not place this trade.
USD/JPY:
• If price continues to correct between now and I'm awake to place the order then I'll be looking to get short with a reduced risk entry on the break of this tight one hour flag.
• If this setup doesn't present itself then I will simply wait until another setup which meets my plan materialises.
• If there's any ambiguity then I will not place this trade.
USD/CAD:
• If price breaks the upper descending trend line of our most recent piece of structure, it does so impulsively and in a convincing manner and a subsequent tight flag forms, then I'll be looking to get long with a reduced risk entry on the break of the flag.
• If this setup doesn't present itself then I will simply wait until another setup which meets my plan materialises.
• If there's any ambiguity then I will not place this trade.
EUR/JPY: 16/05. Good input for the sellerEUR/JPY is heading towards the neck and shoulder line after the cross broke out of the 20-day Exponential Moving Average (EMA) at 147.68. However, it still hesitates to achieve a decisive breakout that could invalidate the pattern. As the Asian session begins, EUR/JPY is trading around 147.95, down 0.06%.
EUR/JPY remains skewed to neutral, although in the near term, will be tilted slightly to the downside. The Relative Strength Index (RSI) indicator shows a pause in the uptrend as the RSI is flat in the bullish zone, while the 3-day Rate of Change (RoC) is neutral.
Although EUR/JPY spot price tests the head and shoulders neckline, the pattern remains intact. The confluence of the neckline and last year's high of 148.45 could make it difficult for buyers while being a good zone for EUR/JPY sellers. OANDA:EURJPY
SELL EURJPY zone 148.00 - 148.10
SL: 148.35
TP: 147.00
Midweek Review: New Pairs, New TradesHey everyone Dean here from WealthTIP, were our tip for wealth is to trade, invest, and prosper. So today we looking at a few pairs that could be offering some interesting opportunities before the week ends. To see what we looking at simply watch right through and let me know what you think.
Trade Recap - XAGUSD Review the trade I've taken on XAGUSD
My trading style is a combination from all of these methods:
Top down analysis
Chart pattern analysis
Supply & demand
Let's start with the analysis which I did on 30 Dec 2021.
Monthly
Bullish flag pattern is formed. With this pattern, there's potential price to break the flag and impulsive to the upside.
Currently on Monthly low in a corrective phase. Monthly low indicate that probability price could go more to upside than downside.
Historical price also show that on this region, price tend to go impulse to upside.
I would target the price to reach the beginning of correction (beginning of flag).
Weekly
Price hasn't break previous bearish structure. The probability for price to go up only for short term and then to the downside again is there. I should aware of the scenario where Bullish W pattern could play-out.
Current price is on Weekly low. Never buy on weekly low because historically the price tend to go upside.
There is double bottom pattern that indicate currently on resistance.
Bullish candle already appear, indicate that the bull is there. So lower potential to catch the falling knife.
The conclusion is there's more probability going to upside than to the downside.
Daily
Bullish M pattern with consecutive bearish candle on the 4th leg. This pattern indicate the bullish momentum.
Clear trend-line (white). Historically price respect the trend-line, so there's probability that it still will respect the trend-line.
Bullish candle appear showing that the bull is there. So lower potential to catch the falling knife.
I draw fibonacci from 3rd leg of Bullish M pattern and will find Supply & Demand zone below 61.8. Also use -27 as Daily target profit.
Clear Supply & Demand zone (white). S&D is a zone that could act as both resistance & support. On this zone I will wait for the entry confirmation on 4H timeframe.
4H
Bullish M pattern with false break on fib completion -68. This pattern inside the bigger timeframe pattern indicate that it align with the bigger timeframe trend, which is uptrend.
Inverse H&S could play-out. This is my confirmation for entry position. I will wait on Supply & Demand zone (grey)
I wait for deceleration and bullish indication before place my entry to minimize the risk.
Place my Stop Loss on the lowest wick that on my S&D zone.
Will increase my position along the way if the price go according my analysis.
Current price
1 Jan 2022
No Forecast (WTICO/USD Trade Update).The market as it has for the whole of October is looking great frame a higher time frame perspective but very poor from a lower time frame one, at least in terms of opportunities which meet my plan. So this is just a quick trade update for you where the short trade that I placed yesterday on WTICO/USD is concerned.
Patience always pays folks and I'm in this game for the long haul, not with the intention of "getting risk quickly" like a large percentage of my fellow market participants are but with the intention of continuing to generate wealth for myself and my family steadily and when you let the market come to you as opposed to you chasing the market you'll feel empowered as I always do and this is going to increase your confidence in your trading ability as it has mine and it's this confidence and this mindset which is going to set you up for success as a trader.
Have a great weekend!
AUD/CHF and EUR/USD on watch for me today.AUD/CHF:
• If price pushes up to and ideally just above our upper rayline and the last part of the move is corrective, then I'll be looking to get short with a risk entry either after a phase line break, or just below a one hour or a fifteen minute rejection from it.
• If my entry requirements are not met then I will simply wait until another setup which meets my plan materialises.
• If there's any ambiguity then I will not place a trade on this pair.
EUR/USD:
• If price corrects and a tight flag forms, or price impulses up still further and a subsequent tight flag forms, then I'll be looking to get long with either a reduced risk entry on the break of the flag or a risk entry within it.
• If my entry requirements are not met then I will simply wait until another setup which meets my plan materialises.
• If there's any ambiguity then I will not place a trade on this pair.
No Forecast (GBP/USD Trade Update).Good morning guys and girls,
I'm now back at my office desk at my home address in Scotland. I still need to catch up on a few things and set my recording equipment up which I'll be doing later today, but once I've done so I'll be able to start making videos for you again from tomorrow onwards.
For now here's a quick update on my GBP/USD trade. I was tagged out a few seconds after 8:00 AM this morning for +1.88%. Since price had previously twice come very close to my stop loss before pushing back up in my forecasted direction I moved my stop back down by a couple of pips whilst I was sat waiting for my train at London King's Cross station to give my trade just a tiny bit more room to breathe so that my stop loss made sense relative to where this new swing low had formed. I don't normally give back profit if I've already locked it in, but I will if it makes sense to do so and I'm only giving back a tiny amount such as +0.07% as I was in this instance. Price then subsequently pushed up leaving me running at around +4.00% profit at one point and a question I always ask myself when I have a lot of profit exposed to the market is, "Would I be comfortable having this much profit exposed to the market if I was trading a one million pound account?", which if I was trading a one million pound account would have meant that this trade would have been in profit by £40,000 with the possibility of price taking me out for £12,900. So after asking myself this I decided to lock in below the big wick that had formed on the one hour chart which was also a notable inflection point on the four hour chart. I could have locked in on the break of the subsequent tight flag that had formed on the one hour chart, but an amendment I made to my trading plan a while back was to not lock in on the break of tight flags if price has broken them correctively, because the testing I've done and my experience have taught me when this happens price will usually turn such tight flags into larger versions of themselves before price finally commits in my forecasted direction and given that the profit potential of this trade was just over +30% not locking in too tightly made sense. i.e. I was happy to be a bit more aggressive and lock in some of the +4%, but not too aggressive and by not being too aggressive give this trade a little more room to breathe.
So I'm very happy with this trade which puts me in profit for the month and therefore obviously the quarter, a trade which I'll be documenting later today as one of my five daily goals and I look forward to bringing you videos once again from tomorrow onwards.
Have a great day and I'll speak to you tomorrow!
Nothing on watch for me today.Good morning all,
I hope you're doing well.
So I was tagged out of my EUR/GBP trade for break even yesterday and now as I'd expected it would if I was tagged out price looks it might be pushing back down to the bottom of our higher time frame structure, so I'm very happy with how I placed and managed this trade and all we as traders have to do after a trade is document and journal it and then role the dice again and our let our edge over the market play out over a large enough sample size of trades just as a casino does when it comes to hands or spins.
Where today is concerned I think the market once again looks like it needs a little development across the board where how I look to trade is concerned, so because I'm running my trading career like a business and I'm not looking to get rich quick I'm happy to watch from the touchline again as it were and wait for the market to show its hand. I think AUD/JPY could be a possible candidate for my Friday Forecast, but we shall see how this pair develops as today unfolds.
Have a great day and remember that in trading just as in life, patience always pays!
CAD/JPY on watch for me today.CAD/JPY:
• If price pushes down to and ideally just below the lower descending trend line of our most recent piece of structure and the last part of the move is corrective, then I'll be looking to get long with a risk entry either after a phase line break, or just above a one hour or a fifteen minute rejection from it.
• If price only pushes down to and ideally just below our upper rayline and the last part of the move is corrective, then I'll again be looking to get long with a risk entry either after a phase line break, or just above a one hour or a fifteen minute rejection from it, but I'll be hiding my stop loss below the lower descending trend line of our most recent piece of structure for extra protection.
• If price pushes down to and ideally just below our rayline and it does so impulsively, then I'll be waiting for a convincing impulse back up followed by a tight flag and then I'll be looking to get long with either a reduced risk entry on the break of the flag or a risk entry within it.
• If my entry requirements are not met then I will simply wait until another setup which meets my plan materialises.
• If there's any ambiguity then I will not place a trade on this pair.
EUR/NZD and AUD/NZD on watch for me today.EUR/NZD:
• If price only pushes up to and ideally just above our lower rayline and the last part of the move is corrective, then I'll once again be looking to get short with a risk entry either after a phase line break, or just below a one hour or a fifteen minute rejection from it but I'll be hiding my stop loss above our upper ascending trend line for extra protection.
• If price pushes up impulsively to and ideally just above our lower rayline or I miss the risk entry opportunity from the top of our most recent piece of structure, then I'll be waiting for a convincing impulse back down followed by a tight flag and then I'll be looking to get short with either a reduced risk entry on the break of the flag or a risk entry within it.
• If my entry requirements are not met then I will simply wait until another setup which meets my plan materialises.
• If there's any ambiguity then I will not place a trade on this pair.
AUD/NZD:
• If price pushes down to and ideally just below the lower trend line of our most recent piece of structure and the last part of the move is corrective, then I'll be looking to get long with a risk entry either after a phase line break, or just above a one hour or a fifteen minute rejection from it.
• If my entry requirements are not met then I will simply wait until another setup which meets my plan materialises.
• If there's any ambiguity then I will not place a trade on this pair.
EUR/GBP and EUR/NZD on watch for me today.Good morning guys and girls.
I hope you're doing well.
So my NZD/JPY trade which I liquidated on Sunday night would now (had I not liquidated it) be running at just over +8.00% profit with +7.81% locked in which would have been my most profitable live trade of all time in both percentage and monetary terms. Am I frustrated by this? Not at all. In fact I actually feel motivated because I previously never even used to miss these moves because I didn't know how to forecast them in the first place and one of the reasons I feel motivated is because I was backtesting yesterday and based on something which I discovered on my charts plus one other tweak which I've made to aid my psychology I know that had I been in this trade today I most definitely would not have liquidated my position. Furthermore this is the second +7.00% move that I've missed in one week, so it's only a matter of time before these bites turn into catches!
I'm not in any trades at the moment but my forecast for today I've listed below. I only have two pairs on watch today because we've seen some big moves this week and after big moves I typically prefer to let the market show its hand rather than trying to catch a bunch of falling knives. I've just added EUR/GBP to my Tuesday Forecast but this might not be ready by the end of the day, but since I only have one other pair on watch I thought I'd add it into the mix as a bit of a hedge.
Have a great day!
EUR/GBP:
• If price corrects and a tight one hour flag forms then I'll be looking to get long with a reduced risk entry on the break of the flag.
• If my entry requirements are not met then I will simply wait until another setup which meets my plan materialises.
• If there's any ambiguity then I will not place a trade on this pair.
EUR/NZD:
• If price pushes down to and ideally just below our rayline and the last part of the move is corrective, then I'll be looking to get long with a risk entry either after a phase line break, or just above a one hour rejection from it.
• If my entry requirements are not met then I will simply wait until another setup which meets my plan materialises.
• If there's any ambiguity then I will not place a trade on this pair.
EUR/USD, EUR/NZD and USD/CHF on watch for me today.Good morning one and all.
I hope you're doing well, you had a great weekend and that you're feeling focussed for the week ahead.
So I closed my NZD/JPY trade down manually last night for break even (or +0.1% profit to be price) once price broke back with in our larger flag and then closed within it on the one hour chart and then immediately after I had price dropped like a stone in the direction I previously required it to. If I hadn't then I'd currently be running at around +2.7% profit, but that's trading for you. We document and journal the trade and then we move on to the next one.
My forecast for today is listed below and I currently have an order set on EUR/USD which I'm currently monitoring closely to make sure that my stop loss is in the right place encase I'm triggered into the trade.
Have a great day!
EUR/USD:
• If price impulses up, it does so in a convincing manner and a tight one hour flag forms, then I'll be looking to get long with a reduced risk entry on the break of the flag.
• If my entry requirements are not met then I will simply wait until another setup which meets my plan materialises.
• If there's any ambiguity then I will not place a trade on this pair.
EUR/NZD:
• If price corrects and a tight one hour flag forms then I'll be looking to get short with a reduced risk entry on the break of the flag.
• If my entry requirements are not met then I will simply wait until another setup which meets my plan materialises.
• If there's any ambiguity then I will not place a trade on this pair.
USD/CHF:
• If price pushes up above our lower rayline, it does so impulsively and in a convincing manner and a subsequent tight flag forms, then I'll be looking to get long with a reduced risk entry on the break of the flag.
• If my entry requirements are not met then I will simply wait until another setup which meets my plan materialises.
• If there's any ambiguity then I will not place a trade on this pair.