Traderprosignals
Btc / UsdtBITSTAMP:BTCUSD
1. **Current Price Zone (\~108,000):**
* Price is consolidating just under a supply zone (red rectangle), showing potential rejection from the upside.
* The price briefly pushed above the rising trendline but failed to hold it.
2. **Bearish Structure Forming:**
* Price action suggests a **lower high** and potential **head-and-shoulders** pattern.
* Red squiggle indicates a likely **short-term bearish movement** — a drop to the **demand zone** around **105,700–106,900**.
3. **Demand Zone/Order Block:**
* Marked below near **105,741** with label **"Order"**, showing where potential buy orders may sit.
* This is the first major area where price might find support.
4. **Downside Levels:**
* **106,933** and **105,741**: Potential short-term supports.
* **98,332 (Weekly level)**: If the structure breaks fully, price could revisit this major demand zone.
5. **Upside Resistance:**
* **Red supply zone above 109,000** acts as strong resistance — if BTC breaks that with volume, bullish bias resumes.
---
### 📉 **Short-Term Bias:**
* **Bearish** unless BTC breaks and holds above **109,000**.
* Expecting a pullback toward **106.9k** or **105.7k**, which may offer **buy-the-dip** opportunities.
Disclaimer : Not Financial Advice

VEA - Hits Target with PrecisionToday, price tapped the target perfectly.
This setup played out exactly as forecasted — clean market structure, precise entry zone, and strong momentum

#WALUSDT continues its bearish momentum 📢 As long as the price stays under $0.6000 — short BYBIT:WALUSDT.P bias remains valid.
📢 Watch for further weakness!
📉 SHORT BYBIT:WALUSDT.P from $0.5794
🛡 Stop loss: $0.6000
🕒 Timeframe: 1H
✅ Overview:
➡️ The chart shows a clearly formed and broken Bearish Rectangle, confirming a short setup after price exited the range to the downside.
➡️ The $0.6090 support level has turned into strong resistance.
➡️ Entry at $0.5794 follows a textbook breakdown and retest structure.
➡️ Target area aligns with the volume-based support near POC $0.515, offering solid R:R.
🎯 TP Targets:
💎 TP 1: $0.5725
💎 TP 2: $0.5665
💎 TP 3: $0.5600
📢 Bearish structure confirmed with increased volume.
🚀 BYBIT:WALUSDT.P continues its bearish momentum — downside potential remains active!


#ADAUSDT remains strong—expecting further upside!📈 LONG BYBIT:ADAUSDT.P from $0.8106
🛡 Stop Loss: $0.8066
⏱ 15M Timeframe
✅ Overview:
➡️ BYBIT:ADAUSDT.P is trading in an accumulation zone, breaking the local resistance at $0.8106, which could act as a long entry point.
➡️ POC (Point of Control) at $0.7971 confirms strong buyer interest below the current levels.
➡️ The price maintains an upward structure, and a breakout above $0.8106 could lead to further upside.
➡️ Rising volumes confirm bullish activity and potential growth.
⚡ Plan:
➡️ Enter long above $0.8106, confirming the breakout.
➡️ Risk management via Stop-Loss at $0.8066 to protect against false breakouts.
🎯 TP Targets:
💎 TP1: $0.8138
🔥 TP2: $0.8195
⚡ TP3: $0.8266
🚀 BYBIT:ADAUSDT.P remains strong—expecting further upside!
📢 BYBIT:ADAUSDT.P is showing a solid bullish impulse. A breakout above $0.8106 could lead to a test of $0.8138 – $0.8266.
📢 However, if the price drops below $0.8066, it may signal a return to the consolidation zone.

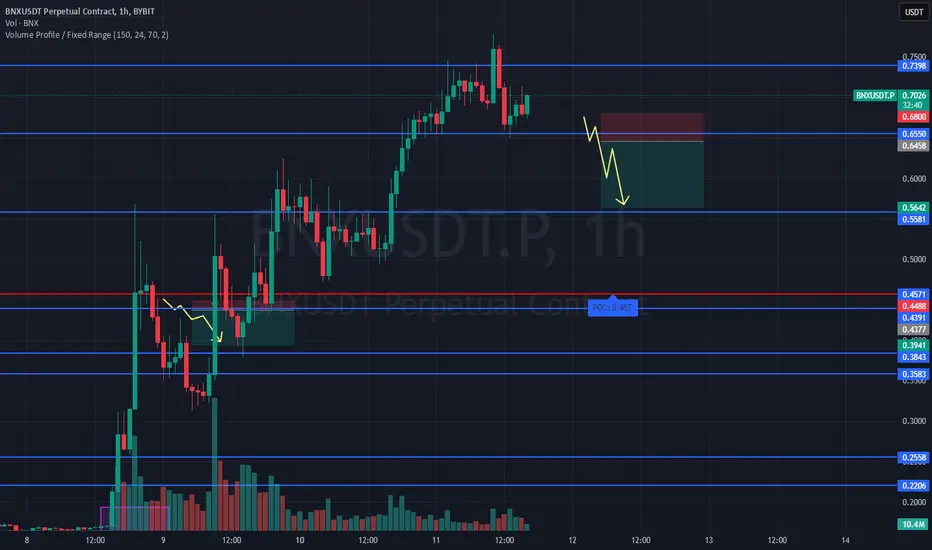
#BNXUSDT is weakening expecting a drop📉 SHORT BYBIT:BNXUSDT.P from $0.6458
🛡 Stop Loss: $0.6800
⏱ 1H Timeframe
✅ Overview:
➡️ BYBIT:BNXUSDT.P is near resistance at $0.6853, showing signs of weakness.
➡️ A pullback is expected after failing to hold above $0.6550.
➡️ Targeting support levels at $0.6060 → $0.5642.
⚡ Plan:
✅ Bearish scenario confirmation – price needs to break $0.6550 and stay below it. If confirmed, the short position remains valid.
✅ Critical resistance level – $0.6853. If the price moves above $0.6800, the trend may shift bullish, invalidating the setup.
✅ Volume analysis shows weakening buying interest, supporting the possibility of a correction.
✅ Profit-taking zones – $0.6060 → $0.5642. If price slows down around $0.6060, a bounce is possible, so partial profit-taking is recommended.
✅ Alternative scenario – if price bounces from $0.6060, a long position with a tight stop could be considered.
📍 Take Profit targets:
🎯 TP1: $0.6060 – testing the nearest support level.
💎 TP2: $0.5642 – deeper correction zone.
🚀 BYBIT:BNXUSDT.P is weakening — expecting a drop to $0.5642!
📢 A break below $0.6550 confirms the bearish scenario.
📢 Holding below this level strengthens the case for further decline.
📢 If price surges above $0.6800, the setup is invalidated.
WHEAT – Signs of Weakness, Could a Short Be Next?PEPPERSTONE:WHEAT is within a clear resistance zone that has times before led to bearish reversals. In any case, this zone marked by previous price rejections, could once again attract selling pressure.
If bearish confirmation occurs—through rejection wicks, bearish engulfing candles, or a decrease in buying volume—we could see a decline toward the 544,00 level.
However, I’ll be watching for strong support reactions or signs of exhaustion before confirming the next move.
Just my take on support and resistance zones—not financial advice. Always confirm your setups and trade with solid risk management!
What’s your take on the potential trend of this chart? I’d love to hear your perspective in the comments.
Best of luck , TrendDiva

GBPPLN - A Potential Buying Opportunity towards 5.03500OANDA:GBPPLN is in a key support zone, which has multiple times seen strong bullish reversals and notable buyer interest. The recent bearish pressure has brought the price into this critical area, presenting a potential buying opportunity.
I expect a move toward 5.03500. However, if this support zone is breached, the bullish outlook would be invalidated, potentially resulting in additional downside movement.
-Target Price: 5.03500
-Support Zone Breach: Invalidates bullish outlook, potential decline
-Risk Management: Crucial for position sizing and protection

Dent/UsdtBINANCE:DENTUSDT
So, right now **Dent (DENT)** is sitting at a price of **0.01362** 💰. If the price **holds steady** at this level, it suggests that **buyers** are still in control and there's potential for the price to keep rising. If this momentum continues, **Dent** might face some resistance at **0.001503**, **0.001754**, and **0.001875** 🚫. These are key levels where the price could slow down or struggle to break through. At these points, some traders might choose to sell, which could cause the price to temporarily pull back. So, it's important to watch those levels closely to see if Dent can push past them.
But here's the flip side: if the price **fails to hold** at **0.01362** and starts to drop below, it could hit a **support level** at **0.001223** 🔑. This is where the price could **stabilize** for a bit, as some buyers may step in and try to **prevent further decline**. If it doesn’t hold at 0.001223, however, things could get more **volatile**, and the price might continue to fall until it finds another point of support.
This is where the market can get **tricky**, because **sentiment** (what traders are feeling) can shift quickly. You’ll need to keep an eye on the **market trends**, **news**, and **volume** (how much the coin is being traded), as these can give you hints on whether the price is likely to **break through resistance** or **bounce off support**.
---
### Bottom Line:
- **Dent’s price** is currently at **0.01362**.
- If it holds, it may face **resistance** at 0.001503, 0.001754, and 0.001875.
- If it drops, **support** at **0.001223** could be the next level to watch.
Just remember, this isn’t **financial advice**—it’s more about keeping an eye on the **overall trends** and **market behavior**. Always do your own research, and stay informed! 📚💡

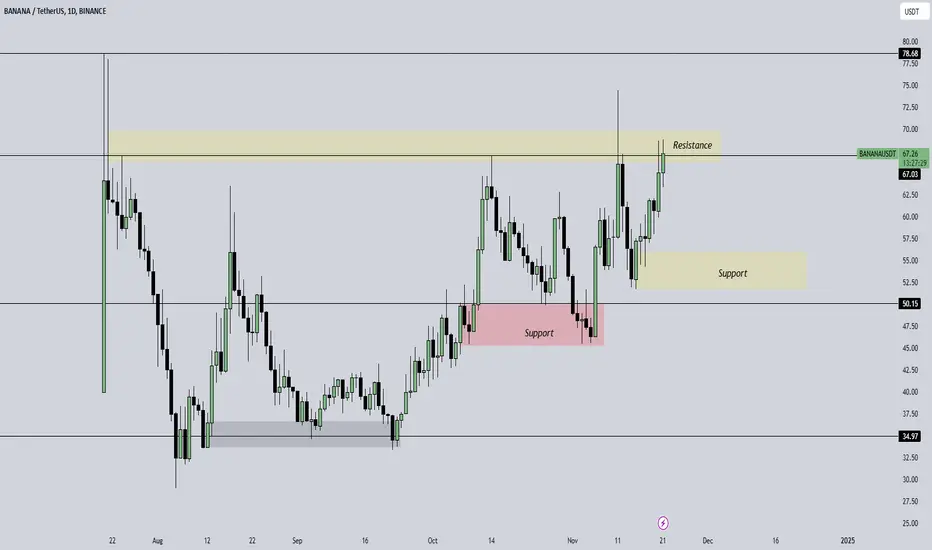
Banana /UsdtBINANCE:BANANAUSDT
### 📊 **Current Price: 67.17**
- BANANA coin is currently at **67.17**, which places it in an important price zone. This price level is crucial to watch closely for any signs of a breakout or breakdown.
---
### 🔨 **Resistance Levels: 78.72**
- The **78.72** level represents an **important resistance zone**. Resistance is where the price tends to face selling pressure, making it harder for the price to move higher.
- **Why this is significant**: For BANANA to continue its upward movement, it needs to break through the **78.72** resistance level. However, as you mentioned, breaking through this level is likely to be a "difficult road map." The market may experience some struggles here due to previous sellers at this price point.
---
### 🔄 **Key to Success: Break and Retest Resistance**
- **Break and Retest**: This is a critical trading concept. Once the price breaks through resistance, it often comes back to test that level again to confirm that it has become new support.
- **Example**: If the price rises above **78.72**, it may retrace back down to that level (or slightly lower) before continuing upward. This "retest" helps to confirm that the breakout is valid and not a false signal.
- **Why this matters**: If the price fails to retest and hold above the broken resistance, it might indicate weakness, and the price could drop back below resistance, which could lead to a reversal or continued consolidation.
---
### 📉 **Support Levels: 54.35 / 48.00 / 42.34**
- **Support levels** are crucial for identifying potential price floors where the market might find buying interest. If the price falls below the current level of **67.17**, the following support zones can provide critical price points to monitor for potential reversals:
1. **54.35**: A strong potential support level where buying interest might show up, preventing the price from dropping further.
2. **48.00**: Another support level where there could be buying pressure if the price falls lower.
3. **42.34**: The lowest support you’ve identified, which could act as the final line of defense for the price before a significant downward move.
---
### 🛣️ **Price Scenario Breakdown**
- **Scenario 1: Price Holds Above 67.17**
- If the price holds at **67.17** or rises above, the next goal is to break through **78.72**. Once this resistance is breached and retested, the potential for an upward trend increases, but patience is key.
- **Scenario 2: Price Fails to Hold 67.17**
- If the price fails to hold **67.17** and starts moving downward, watch for a potential test of the **54.35** support level. If this level doesn't hold, the price may drop further, testing **48.00** and **42.34**.
---
### 💡 **Conclusion: What to Watch For**
- **Breaking Resistance (78.72)**: The key level to watch is **78.72**. If the price can break this resistance level and then successfully retest it, the market might continue upwards. This breakout confirmation is essential for the continuation of the bullish move.
- **Falling Below Support**: If the price fails to hold **67.17** and falls toward the support zones, the **54.35**, **48.00**, and **42.34** levels will be critical. If those levels fail, further downside risk could occur.
### 🚨 **Reminder**:
This analysis is not financial advice! Always perform your own research and use proper risk management in your trades. Markets can be volatile and unpredictable.
#XAUUSD/H4 Model 2 peaks appear, gold's correction rhythmAnalysis of the gold trend in the Asia-Europe session on 14/08/2024:
After forming a double bottom pattern at 2380, gold experienced a nearly 100-point increase. Yesterday, the PPI did not help gold break through the resistance zone of 2473-2475. If gold breaks the area of 2458-2460, it will officially confirm the double top pattern.
However, today's CPI is still a mystery. Is this a correction phase or just a fake breakout? The long-term trend remains a BUY, but short-term SELL trades can be made at the peak area.
Key price levels to watch: 2473-2475, 2444-2447, and 2430-2434.
Recommended orders:
Plan 1: SELL XAUUSD zone 2473 - 2475
SL 2479
TP 2468 - 2458 - 2445.
Plan 2: BUY XAUUSD zone 2444-2447
SL 2441
TP 2455 - 2468 - 2485 - 2509.
Plan 3: BUY XAUUSD zone 2430-2433
SL 2427
TP 2444 - 2458 - 2468 - 2509.

XRP Road MAPPrice Levels and Resistance Lines: The chart shows several horizontal resistance lines at different price levels such as $0.6025, $0.6135, $0.7915, $1.0260, $1.3437, $1.9716, and $4.1853.
These lines are likely previous support and resistance levels where the price had significant interactions.
Trend Lines:There are yellow downward and upward-sloping trend lines indicating bearish and bullish trends, respectively.
The price has broken out of these trend lines multiple times, indicating shifts in the market sentiment.
Pattern Formation: The chart shows a large triangle pattern with converging trend lines, suggesting a potential breakout.
Smaller triangular patterns within the larger trend indicate periods of consolidation before the breakout.
Measured Moves: Two measured moves are highlighted with blue rectangles, both showing a substantial 932.15% increase. These moves are indicative of significant upward momentum.
The first move shows a price increase from approximately $0.19 to $1.97.
The second projected move indicates a potential price increase from around $0.60 to the $4.18 target.
Volume: The volume bar at the bottom indicates trading activity. Higher volume during breakouts and significant moves suggest stronger momentum.
Current Price Action: The current price is around $0.6026, and it recently broke out of a consolidation pattern.
The breakout suggests a bullish trend with potential targets at higher resistance levels.
Key Observations:
Support Levels: Around $0.59, $0.53, and $0.43.
Resistance Levels: $0.6135, $0.7915, $1.0260, $1.3437, $1.9716, and $4.1853.
Trend: The recent breakout suggests a bullish trend, with potential significant upward movement if momentum continues.
Conclusion:
The XRP/USDT pair appears to be in a bullish phase, with potential targets at higher resistance levels. Traders should watch for confirmation of the breakout and volume to gauge the strength of the move. Monitoring support and resistance levels will be crucial for making informed trading decisions.

$AXL looks like it is ready to go long!NYSE:AXL is breaking out this falling wedge pattern, and RSI is also showing bullish divergence.
Entry Point: Start accumulating once the price exceeds $0.97.
Targets:
Midterm Goal: 60% increase
Long Term Goal: 170% increase
Trading Options: AXL is available for trading in both spot and futures markets. You can purchase it on the spot market, or if you prefer to go long on futures, consider setting a stop-loss at $0.78.
About NYSE:AXL
Axelar aims to provide secure cross-chain communication for Web3. This project offers a decentralized network and a suite of tools to assist developers of decentralized applications (dApps) in achieving seamless cross-chain interactions via its protocols, tools, and APIs.
DYOR, NFA
#Crypto #altcoin

S&P500 3 Months Trading Channel Hey guys, didn't post new set-ups because the market is quite boring right now.
But explored some ETF and found an idea for stable trades. As we know, ETF's and some pairs are like to move in long channels, which is pretty easy to trade.
Here at the S&P500 we can see the raising channel from 5th January and I mark the zones, where you can open long positions, as the channel is raising I will recommend to trade only long positions.
What we're looking for before open the position:
1) The price have to cross the support level of the channel
2) As a help you can use Awesome Oscillator (if the oscillator is changing color and starting to raise up) you can use this as confirmation to open the position.
IMPORTANT! Don't forget to follow RM strategy. Use SL orders a bit lower from price crossing the support line!
Trade stocks and ETF at BingX with no special requests, only using crypto by my link: bingx.com

SEI break out to $1.20 Incoming or break down to $0.59SEI broke out to 1$ and got a pull back as expected on previous post. Because of an overall bullish market, I see it finding some support here already and bouncing back up to test those highs again. If it fails to do so, expect it to lay on the 100sma $0.59 (yellow line) for support.

NZDUSD SELL | Sell Setup| Short Trading AnalysisHello Traders, here is the full analysis.
Watch strong action at the current levels for SELL . GOOD LUCK! Great SELL opportunity NZDUSD
I still did my best and this is the most likely count for me at the moment.
Support the idea with like and follow my profile TO SEE MORE.
Traders, if you liked this idea or if you have your own opinion about it, write in the comments. I will be glad 🤝
Patience is the If You Have Any Question, Feel Free To Ask 🤗
Just follow chart with idea and analysis and when you are ready come in THE GROVE | VIP GROUP, earn more and safe, wait for the signal at the right moment and make money with us💰

LINKUSD (W1): Buy stop at 1.68 for this year!COINBASE:LINKUSD LINKUSD (W1) shows positive signals.
With signs of slight correction after a strong price increase. We can expect a return and stronger growth of Chainlink coin.
Specifically, the signs are shown as follows:
The level of price increase is fast and strong: Increases nearly 200% after 12 candles or 84 days
Volume increases when price is pushed up: Volume is above the 50-session average when price increases sharply
Weak bearish correction: Price is always greater than the Fibonacci retracement level 0.382
So, let's set up a buy order when the price reaches 16.8.
Stop loss at 13.5 and wait to see how far the market will take this currency exchange rate.
Merry Christmas!

EURUSD H1 / Looking for a SHORT Trade, see why ... 📊Hello Traders!
This is my perspective for EURUSD H1. At the moment, the Liquidity level was taken, next, we have a very important resistance level at the price of 1.09600, and also at the same level we can see an Order Block. In case of confirmation, I expect a bearish dominance until the price of 1.08100.
Traders, if you liked my idea or if you have a different vision related to this trade, write in the comments. I will be glad to see your perspective.
______________________________________________________________________________
Follow, like, and comment to see my content:
www.tradingview.com

USOIL:i think it will continue to fall
Hello traders, I think crude oil will continue to fall, what do you think?
From the 4 hour chart
Near 79 is the support level of the last few rebounds. I think it can be regarded as a short-term watershed. If this support level is broken, the downside will open below. Conversely, if support is formed here again, you can wait to buy short positions near 80.7. From a margin perspective, the downside is significantly higher than the upside. Judging from the current K-line distribution, the signal of peaking at the high level is obvious, so I think it will fall below here, and then accelerate the decline.
Therefore, in terms of strategy, 79sell tp is around 77.3, and it will be around 76 after breaking the position
If you agree with my point of view, welcome to follow
TVC:USOIL FX:USOILSPOT BLACKBULL:USOIL.F

XAUUSD:I think it will rise first and then fall
Hello traders, I think gold will first go up to around 1966-1970, then if it can't break through 1970, it will start to fall, what do you think?
From the 4-hour chart, there is a little pressure around 1962 above, but the upward trend is strong, so I think this position will still break through, and then look at the important pressure before 1970 above. It is more difficult to break through 1970, and it is an opportunity to short.
The specific strategy is: if you want to buy more at the current point, please hold a small amount, TP1966-1970, or wait and see with a short position, and wait for shorting around 1970
Short near 1970, near tp1935
If you agree with my point of view, welcome to follow
COMEX:GC1! TVC:GOLD OANDA:XAUUSD

BTC SHORT trade setupSince it could not hold on to 30k, needs to test monthly open area (target 29K) This area also aligns with 0.618 retracement level. Stop loss should be wide because of possible stop-hunt in the fair value gap area above entry.

How to achieve quick profits through short-term trading?Many friends enjoy short-term trading, mostly due to the short holding time, quick results, and the thrill of the process. However, short-term trading is the most challenging among all trading methods and requires careful consideration.
Today, I will share my early experience of short-term trading with you. Specific methods and strategies will be provided in the later part of this article, which are closely related to practical applications and, I believe, will be helpful for you.
The article is quite lengthy. If you find it helpful, please give it a thumbs-up at the end of the article. Thank you.
Advantages and disadvantages of short-term trading
Short-term trading does not have a strict definition standard. When the market moves quickly, positions can be closed within a day, but if the market moves slowly, it may take two or three days to close the position, all of which belong to short-term trading.
On charts, I usually consider trades at the 5-minute, 15-minute, and even 1-hour level as short-term trades.
The advantages of short-term trading are:
(1) Short holding time and quick results. People are naturally curious about the unknown and want to know the results quickly. Short-term trading fits human nature, making it easier to control emotions.
(2) High trading frequency, providing a thrilling experience. Many traders are restless and want to trade multiple times a day, short-term trading meets this human need.
(3) The decay cycle of the short-term trading system is short, and the distribution of trading results is more evenly distributed, making it easier to execute. Sometimes, even with a losing streak of 5 times, the long-term trading strategy may take over a month to recover, while the short-term trading strategy may only take two or three days. Thus, short-term trading is less torturous to human psychology during a losing streak.
Disadvantages of short-term trading:
(1) High trading frequency requires more time and energy and is not suitable for part-time traders.
(2) Frequent trading generates high trading costs. Therefore, short-term traders need to pay attention to their commission fees. I have seen many futures traders who have had their accounts charged two or three times, or even ten times, the commission fees. How can they make a profit like this?
(3) Requires higher professionalism and attention to trading details. Short-term trading is more sensitive to changes in the market. Sometimes, when the market changes, you don't have much time to think and must act decisively. People with more procrastinating personalities are not suitable for short-term trading. Additionally, the margin of error for short-term trading is relatively low. Long-term trades do not require very precise entry points, and being off by 5 or 10 points does not have a significant impact on the overall trade. However, in short-term trading, being off by 5 or 10 points can be the difference between profit and loss.
Therefore, short-term trading is a delicate operation, and all trading details must be clear and easy to execute. Short-term traders also need to possess qualities such as attention to detail, boldness, calmness, and decisiveness.
So, how can you quickly profit from short-term trading? Next, I will share two strategies.
2.Plan One: Choosing Volatile Markets with Large Amplitude for Short-term Trading
As a short-term trader, we only need to capture a small segment of market volatility, and it doesn't have to be the overall trend, as long as the market volatility is fast and the amplitude is large.
The faster the market volatility and the larger the amplitude, the easier it is to make profits. For the same 100-point profit, it may take only one day to achieve it when the volatility is fast and the amplitude is large, while it may take several days to achieve it when the volatility is slow and the amplitude is small, resulting in a much lower trading efficiency and different challenges to our mentality.
Therefore, the amplitude of the product is the key to making profits in short-term trading. We need to selectively engage in short-term trading and not try to swallow all profits. There are two specific strategies to consider.
Strategy One: Directly select high amplitude products for short-term trading.
Different products have their own characteristics when operating in the market. Some products have fast volatility and large amplitude, while others have slow volatility and small amplitude. Before engaging in short-term trading, we must select the most suitable products.
For example, in the same breakout trading opportunity, products with high volatility and larger amplitude can achieve greater profits more quickly.
As traders, we all understand that the faster we can lock in profits, the more confident we feel. Therefore, selecting the right products makes short-term trading easier.
Moreover, if you choose a slow-moving product, your holding time will be longer, and your position may be occupied, which will reduce the utilization rate of your funds and affect the final profit. Short-term trading is about paying attention to details and maintaining a strong mindset, as even the smallest details can determine your success or failure. Therefore, do not be careless.
FXOPEN:XAUUSD FOREXCOM:EURUSD
