Traders
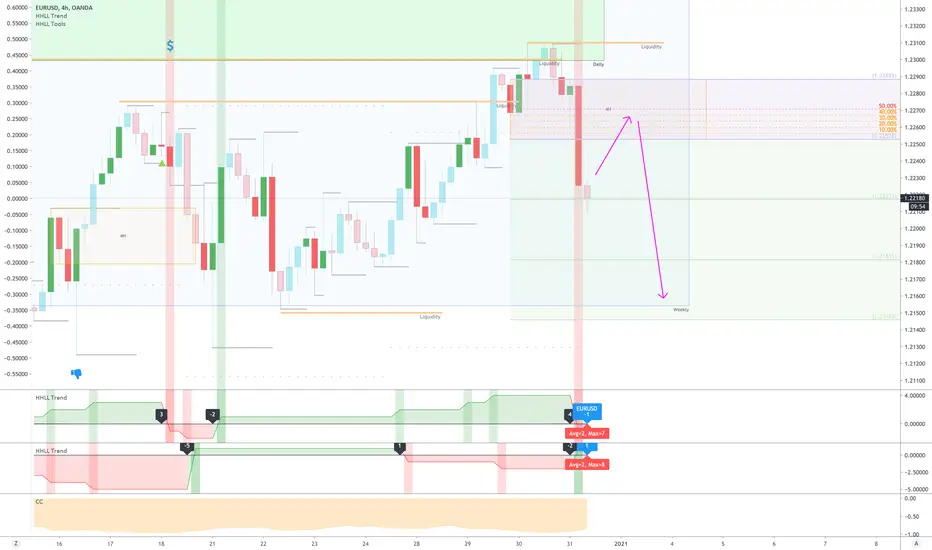


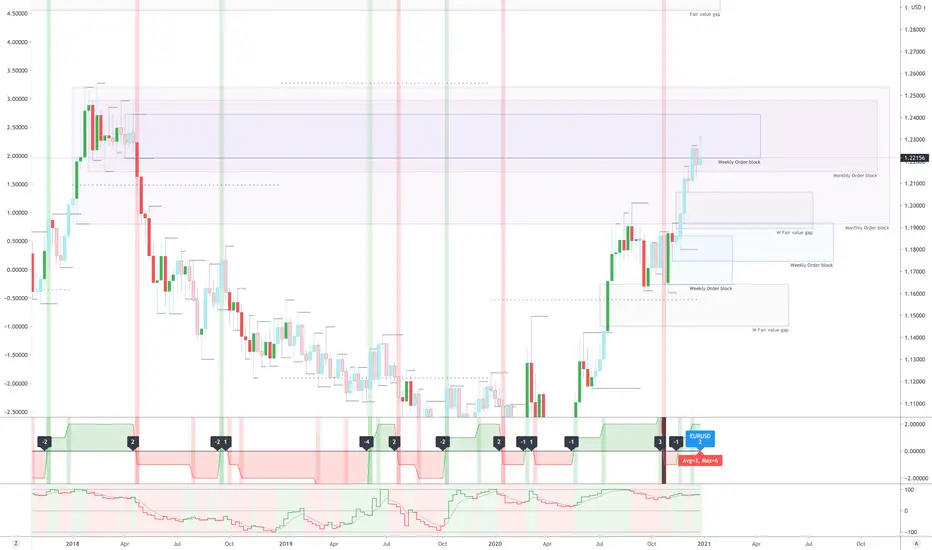
EURUSD (weekly) : At the point of potential inflectionEURUSD is hitting some weekly order blocks and is at a potential inflection point. It could go higher searching for liquidity, or could turn down from here.
Interesting point to note, US Dollar / DXY is also at an important (& opposite) inflection point. So is GBPUSD.
Follow me for more analysis & trade ideas!
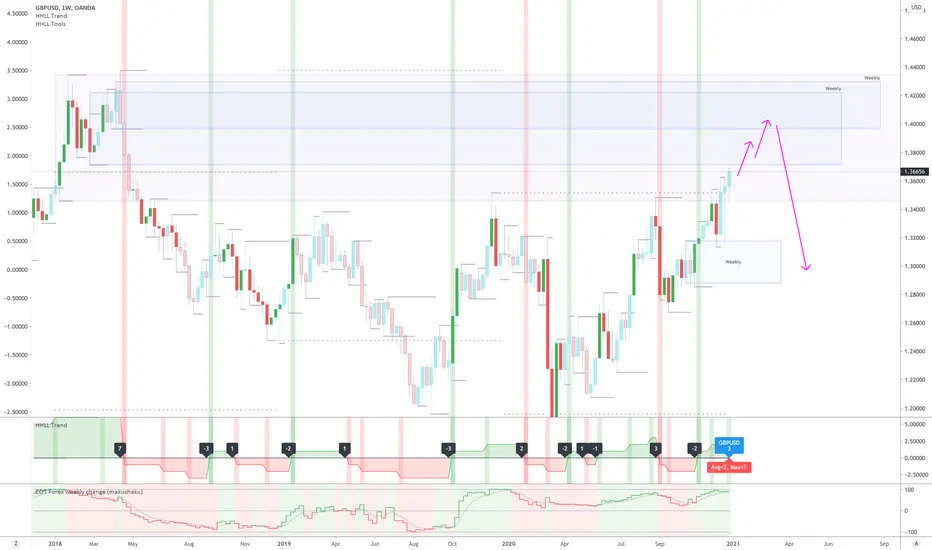
GBPUSD (W) is approaching some very potent bearish orderblocksGBPUSD is nearing some very potent bearish order blocks on the weekly chart, which can cause price to bounce back (at least temporarily).
Also, the price delivery while going up is very clean and has no apparent open bullish order block. So if it falls, there's nothing to support it.
Also, DXY and EURUSD are at their support & resistance (respectively). So this all seems in sync.
Please keep in mind, these are weekly zones - not to be used directly for trading. Instead, use them to keep a watch on price on your smaller timeframes.
Expected direction : Up (till it reaches bearish order blocks) and then Down
DXY (Dollar Index) Some areas of potential reactionHere are some areas on DXY / Dollar Index / DX1! which are potential areas that could trigger a reaction.
Remember, don't trade these zones by themselves - but use a lower timeframe, like Daily or 4H to find the trading opportunities.
These zones on the weekly chart are a reference to what are some primed areas based on the history played out!

USDCAD (4H) : Trapped shorts behind a liquidity run!There's a liquidity buildup happening behind recent lows on 4H on USDCAD.
Right behind the liquidity is an area where a bunch of shorts are trapped.
This zone could be a great place to take a long position.

USDCHF (4H) : Trapped longsLongs are trapped, will result in a short trade when they exit.
Remember : risk management is the key!

DXY (Dollar Index) Long term movement prediction for 2021DXY / DX1! / FX:USDOLLAR / Dollar Index is searching for liquidity, bouncing up and down in the process.
This is my long term prediction on how it could move - given no major economic shifts.
Option 1
DXY breaks below the Q1 2018 lows, collects liquidity
It then runs up to fill in the fair value gap from Q3 2020
It then falls down and get rejected from Q3 2014 lows as those trapped shorts exit - creating a rally
It then falls down again below Q3 2014 lows to collect liquidity
Heads back up again in search of liquidity
Option 2
DXY creates a short term low just before Q1 2018 liquidity run, so that it can trap even more traders
It then runs up to fill in the fair value gap from Q3 2020
It then falls down, collects the liquidity below Q1 2018 lows
Get rejected from Q3 2014 lows as those trapped shorts exit - creating a rally
It then falls down again below Q3 2014 lows to collect liquidity
Heads back up again in search of liquidity

ZB1! / TLT : US Treasury Bond Futures : HTF Bias (Option 2)US Treasury Bonds (ZB1! or TLT) are nearing some very sensitive + bullish zones on the weekly chart.
Here's another way this can play out in next few weeks!
Alternative way this could play out :

ZB1! / TLT : US Treasury Bond Futures : HTF Bias (Option 1)US Treasury Bonds (ZB1! or TLT) are nearing some very sensitive + bullish zones on the weekly chart.
Here's one way this can play out in next few weeks!

My trading strategies : Trade against the trapped trader!STRAT 11 : Basic premise
As price continues in a trend, more and more traders keep piling into the same direction, hoping that the trend will continue and they will make money. However, at some point, the trend sharply reverses, breaking the market structure in opposite direction and trapping a whole bunch of retail traders in the direction of trend which just got reversed.
We create a zone which identifies these trapped traders and then patiently wait for them to exit, and trade with limit orders in the direction of their exit.
You can add additional confirmation signals from DXY's directions for the instruments which are highly correlated to DXY (EURUSD, USDCHF, etc)

Analysis EUhello traders, EU going to retest to some parts of the support or maybe tries to fill in some gaps below. Thanks for reading !

DXY (US Dollar) : Trapped tradersDXY (US Dollar) is trapping traders on both sides of the price : giving us both long and short trades when these traders exit.
Hoping for a Short trade first, then a long trade!

GBPUSD (4H) : Trapped sellersThe recent gap up in GBPUSD left a bunch of sellers trapped below the monthly lows.
When price comes back to them, they would love an exit - giving us a long entry!
Also : DXY seems to be moving lower, thereby confirming the up direction in GBPUSD.

LuckyTraderi advice you also to follow one of my friends for best forecasts results
more ideas, more views, better results!
Happy Tr4Ding !

GC1! (GOLD / XAUUSD) : Traders trapped on a daily chart?Who's bullish on Gold / GC1! / XAUUSD ?
I've highlighted zones in green which represent a high probability of trapped traders. These are daily zones - so would need further drilling to create trade zones.
If price will bounce, there's a high likelihood of it bouncing from these zones!

DXY : That feeling when you miss a successful entry by a hair!That feeling... - when everything you analyzed, played out exactly as expected - BUT you missed the entry by a hair!
:-(

EURUSD (4H) : Trapped sellers => LONG trade!Sellers are trapped in the zone as shown on EURUSD 4H
DXY has already started moving down, confirming the UP direction in EURUSD.
When price comes back to them, they would need an exit - giving us a LONG trade!

DXY (Dollar Index) 4H : Trapped buyers waiting to exitDXY is currently bearish on all timeframes - D, W, M and it has now trapped a bunch of buyers in a false breakout on 4H - who would love an exit when price comes back to them!
For reference, DXY on Daily

USDCAD (4H) short : trapped traders zone!DXY has already started breaking lower lows -
USDCAD is also now doing the same. It just broke a lower low.
If an entry does not develops before a significant leg develops, abandon the trade - as it would then have created equal highs above the trade zone.


GBPUSD Analysis After ELECTION Explained the strong bullish move in the market
and what to expect after elections
