BTC in much needed correction & possible buying zones BTC is in massive correction. It was expected after great bullish run. I published short trade a while ago - I was a bit quick on that, I admit, but my target still remains the same. I see BTC under $10.000.
I marked some retracement points. We touched first one just below $13.000, marked at support line from 10 DEC low and exactly on 0.5 fib. retracement.
Fibonacci retracement is a very popular tool among technical traders and is based on the key numbers identified by mathematician Leonardo Fibonacci in the thirteenth century. However, Fibonacci's sequence of numbers is not as important as the mathematical relationships, expressed as ratios, between the numbers in the series. Fibonacci retracement is created by taking two extreme points (a major peak and trough) on a chart. This time I used 12 NOV low at $5,739 on 4h chart and a peak at $19,800. Supports and fib. numbers are aligned perfectly, showing us next possible resistance zones $12,800, $11,166, $6,700.
Tradershub

GNTUSD for next leg upGolem is confirming positive momentum, RSI, MACD both in bullish mode. GNT is ready to blow again to next two targets.

ETH support zone for next leg upETHUSD is probably ready for next leg up. Support is on 0.382 fib level, RSI is picking up & MACD is gaining momentum. Place SL under support, target new all time high.

XRP poised for more upside potentialXRPUSD had a massive run in last days. Begining of the run was pretty easy entry as XRP broke up from channel resistance area on daily chart. Now XRP in forming a new pattern with more upside potential. I'm looking at 1h chart which is showing Ascending Broadening Wedge, which is one of six Broadening Wedge patterns to be found in price charts. It’s pretty popular, and can provide good risk and reward trades. The broadening aspect of them suggests increasing price volatility and increasing volume this spells out opportunity. RSI is gaining strength, MACD is positive, which also indicates this coin has some more bull run potential.
There are a couple of ways how to trade XRP now. Price made a high, and fell back to resistance. We are now looking for higher highs and higher lows in a tight range. On the higher highs price touches, a rising trend line, this forms the upper boundary to our pattern. The higher lows make a lower rising trend line, this forms the lower boundary to our pattern. The breakout direction for top & bottom is random. The trade is to buy when price touches the lower trendline and sell at upper resistance or wait for a breakout. Very often these patterns have partial rises and partial declines that are followed by a breakout. The breakout occurs when price closes on the outside of the pattern, above the upper trendline or below the lower trendline. SL should be placed under the lower support channel.

NEOBTC in good position for quick tradeNEO is one of the last coins that did not perform a rocket jump in last week. RSI is slowly picking up, MACD in positive territory. NEOBTC pair is placed just on support line. This is a great entry point, SL should be placed under support. Target to next resistance area market on chart. Ascending triangle pattern should break here and move up to resistance.

ETH with perfect set upETHUSD has perfect set up for rebound back to upper ressistance level. If momentum stays positive we should easily go over it. MACD & RSI, placed perfectly with bullish momentum and also volume is getting better.
NEO next leg upNEO sits on lower support line and ready to go to upper resistance channel. Break above that would take it to new all time high.

BTC targeting $18.000 again.Bitcoin futures are now available for trading under the ticker symbol "XBT" on the CBOE Futures Exchange, LLC (CFE). The Bitcoin value rose on the opening of CBOE’s futures markets and the trading volume immediately spiked at precisely 23:00 UTC when the futures trading opened. At the time of writing the Bitcoin price is trading at $16,730, representing a gain of more than 20% in the last 24 hours. CBOE launched three futures contracts, with the settlement price being bitcoin’s trading price on January 1st, February 1st and March 1st, respectably. January is trading at $17.700 with 2.700 contracts traded, while the February and March contracts are traded on level $19.100, but with only a fee contracts exchanged hands. The massive amount of orders caused the CBOE website to perform slower than usual, unable to handle the massive amount of traffic. Futures would probably help stabilize the price of Bitcoin, as well as bring closer to adoption by Wall Street. We may even see approval for future products like a bitcoin ETF. For now spot is trading lower then JAN futures, if we knew divergence would occur, the play would be to buy actual and sell futures short. BTC its trading closer to previous high at $18.100 across major exchanges this is an important mark to watch.

LTC forming a bullish patternA symmetrical triangle is a chart formation where the slope of the price’s highs and the slope of the price’s lows converge together to a point where it looks like a triangle. During this formation the market is making lower highs and higher lows, neither the buyers nor the sellers are pushing the price far enough to make a clear trend. LTC is forming a bullish pattern and might clear the upper resistance and continue to grind higher. If we get a clean break, LTC could reach $200 very soon. SL should be placed just under the support. RSI & MACD both in bullish mode, which is strong sign that buyers are in control.

NEO in nice trend channelNEOUSD is trading in nice trend channel, closing on lower support $33. Buy here and wait to $49 level.

OMGUSD in good buy areaOMG just closed down on support. Here should be enaugh buying power before me move back up again. Once we get over resistance, this coin should see new hights.

VTCUSD VTC testing lower support before moving higher again. On 1H chart MACD is negative, RSI is also in negative zone, but should find support under 40 level. I expect the support will hold and we should move higher to first target $12 and then $13.

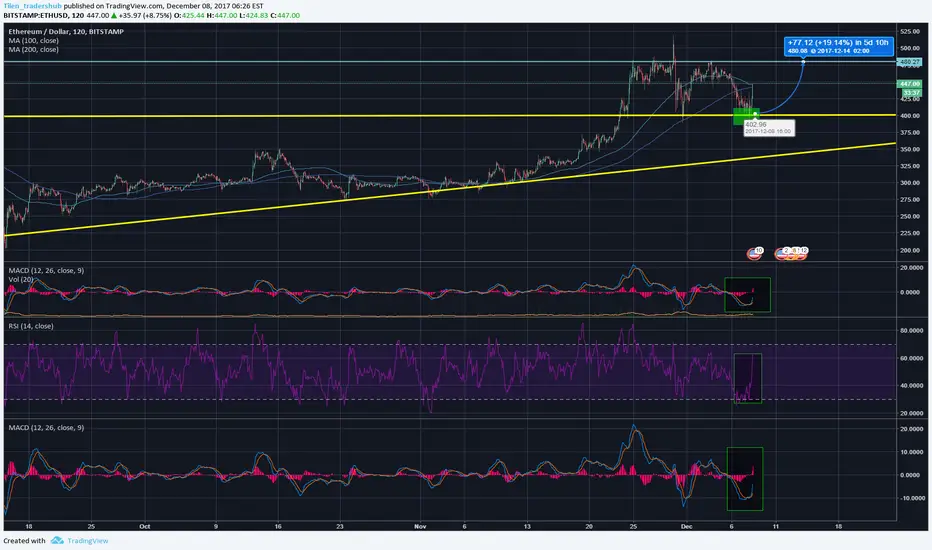
ETHUSDETHUSD had a nice run from my last analysis, hit target at $500, then fell back to fib 0.5 from last run up. It is trading just above support at $400. Any close under this level would take us back to trendline at $340. That support is strong one as it is running basically over the whole year. Weekly and daily charts are still looking nice and bullish, trend is solid. On shorter time frame (1H) MACD is negative, RSI just under 50, which shows some negative sentiment, but its picking up in last 24h. Testing lower support zone would not change long term picture, but would only prove healthy grow of this coin. My target for Ethereum is still $600.

XRPUSDXRPUSD hit my target at $0.28. This proved again as major resistance level. From there is was quick fall to lower support at $0.23 where it is now trading. Overall selling pressure could take Ripple to lower trendline just above $0.21 level, if that doesn’t hold, then $0.18 is last strong support. On the bull side, break above $0.28 will take this coin to new heights.

OMGUSDOMGUSD closed down on trendline which looks like a good support zone. As long as we are above it, any dips are good buying opportunities. Place stop loss under trendline. Daily and weekly charts are in nice bullish trend. On shorter time frame there is still some selling pressure, RSI is just above 50, MACD is getting in positive territory.

ETHUSD with bullish bias getting closer to resistance $400ETHUSD is getting closer to my target $400 published a while ago. This pattern in from the book. It was really easy to see it coming. Lower ascending trendline with higher lows acting as support, and with upper horizontal trendline with two, almost flat highs, acting as resistance. Once we get over this, ETH will form new massive breakout range which could take price way over $500 and eventually to $600 (if whole market stays in bullish mode).

IOTA closing down to first strong supportIOTA was one of the best plays in last weeks. I recommended it just on the break up from triangle pattern at 0.37. Hope you entered position. It had massive run towards 1$ and now is in normal consolidation mode. I’m looking for re-enter levels around $0.62 - $0.64 where we have 0.5 fib. retracement and also support line from the last run. SL set under 0.59. Target +$1.2.

BTGUSD short chart viewBitcoin gold short chart view is showing us some support below, but not a strong one as this is new coin with lots of bears inside who wants to sell and move to BTC or other coins. If we move again to resistance - yellow mark, I would be seller here and wait again for a pull back. Expect some wild runs on this one as we need to get clear picture where this is going. Have your fingers on trigger and don't get carried away with huge pump&dumps.

IOTA is heading to test ATHIOTA succesfully broke up from descending triangle pattern, which was a great entry point and has reached first resistance target at 0.62. Even though descending triangle is bearish pattern, technical analysis isn’t necessarily about the pattern itself, but also it’s about the psychology of what’s going on within the pattern. As well, when bearish patterns fail (like IOTA now), they can produce extremely quick and powerful bullish moves. The bullish momentum still looks strong and could push price higher, most probably to test ATH BITFINEX:IOTUSD at $1.04. There is some resistance area at $0.74, but not so strong. Bulls could take IOTA to ATH very soon if market conditions stay positive.

ETH trending higherETH has been building momentum since the last test of lower trendline on 15/9. Since then it has a steady growth and I expect that it will break up from the ascending triangle chart and go above previous high $400. From the market perspective and relative valuation I'm positive that we will see ETH trading above $500 in next months to come. Last resistance area (yellow) is at $340-344 level, after that test of upper triangle resistance level. Any drop and price consolidation on trendline is buying opportunitiy.
