Lean Hogs Break Below the 200 Day Moving AverageLean Hogs
Technicals (August): It was the last trading day of the month and quarter, which may have been the main catalyst for breaking lean hogs below what we have labeled a “MUST HOLD” support level, defined by the 200-day moving average and trendline support. This will now act as our pivot pocket, 103.00-103.95.
Resistance: 108.125**, 109.45***, 110.075-110.225**, 111.30***
Pivot: 103.00-103.95
Support: 101.30-101.60**, 98.00-98.65****
Futures trading involves substantial risk of loss and may not be suitable for all investors. Trading advice is based on information taken from trade and statistical services and other sources Blue Line Futures, LLC believes are reliable. We do not guarantee that such information is accurate or complete and it should not be relied upon as such. Trading advice reflects our good faith judgment at a specific time and is subject to change without notice. There is no guarantee that the advice we give will result in profitable trades. All trading decisions will be made by the account holder. Past performance is not necessarily indicative of future results.
Trades

Feeder Cattle Rally on Weaker Corn MarketsFeeder Cattle
Technicals (August): Feeder cattle were able to catch a rally yesterday, thanks in part to the corn market collapsing following a “neutral” USDA report. Though it was nice to see a rally, the recent price action relative to the sharp decline in corn has been less than impressive. Not that it has to be a 1:1 correlation, but we would have expected to be a little closer to the 180 neighborhoods. Stiff resistance comes in from 175.35-175.65. This pocket represents the 100 and 200 day moving average, along with what was previously (recently) trendline support. A conviction close above this pocket may be what the Bulls need to work back towards the upper end of the recent range.
Resistance: 175.35-175.65****, 176.80-177.075***
Pivot: 171.45 -172.40
Support: 169.40**, 167.325**
Futures trading involves substantial risk of loss and may not be suitable for all investors. Trading advice is based on information taken from trade and statistical services and other sources Blue Line Futures, LLC believes are reliable. We do not guarantee that such information is accurate or complete and it should not be relied upon as such. Trading advice reflects our good faith judgment at a specific time and is subject to change without notice. There is no guarantee that the advice we give will result in profitable trades. All trading decisions will be made by the account holder. Past performance is not necessarily indicative of future results.

Will Cattle Futures Rally to Meet the Cash Market?
Thursday’s Slaughter is estimated at 124,000. 2,000 more than last week, and 7,000 more than the same week last year.
Thursday’s Cutout Values
Choice: 264.00, Down .88 from the previous day.
Select: 240.57 Down .24 from the previous day.
Choice/Select Spread: 23.43
5 Area Average Cattle Price
Live Steer: 145.85
Live Heifer: 143.55
Dressed Steer: 234.01
Dressed Heifer: 233.98
Live Cattle
Technicals (August): August live cattle made new lows for the move in yesterday’s session but were able to recover and finish the last trading day of the month/quarter/half in positive territory. With the cash market remaining firm, some of the pressure may be attributed to technical selling and end of the month/quarter positioning. We remain optimistic that live cattle will be able to work back towards some of those key moving averages, north of 135.00.
Resistance: 134.85-135.25 ***, 135.975-136.60**, 138.75**, 140.275**
Pivot: 132.45-132.775
Support: 129.975-130.725****
Futures trading involves substantial risk of loss and may not be suitable for all investors. Trading advice is based on information taken from trade and statistical services and other sources Blue Line Futures, LLC believes are reliable. We do not guarantee that such information is accurate or complete and it should not be relied upon as such. Trading advice reflects our good faith judgment at a specific time and is subject to change without notice. There is no guarantee that the advice we give will result in profitable trades. All trading decisions will be made by the account holder. Past performance is not necessarily indicative of future results.

ETH UPDATE 4h TF.And here. Newbies are about to see ETH in 3 digits again. ETH breakdown, Retested the rising wedge and moving towards the support. We shall wait some for time to Long eth again from weekly bottom. Follow me for Trades and Market updates.

USDCAD are you taking a break to sell?Hello traders, we found a downtrend on H4 usdcad accordingly with the structure that was broken. we have a fib level of 50 and 61.8 waiting to be tested to meet the sellers on this pair. It can possible generate a sell trade if, a bearish reversal candlestick pattern come through the zone of 50 and 61.8 fib closing bellow EMA.

NKELooks like we may be retracing from the previous C wave. Sell volume decreasing on the last two candles with some bull volume coming in on the current candle. RSI is in oversold territory on the weekly, daily, and 8 hour. Current candle is a flat bottom so far. MacD may also be losing momentum. The current candle has formed bullish right after an indecision candle at a support area. Strong wickage at this level looking back towards May 12th. Looking to see if we can retrace 1 to 80% of previous high a month or more out. Let's see what happens! Might be a good idea to wait until next week. The market been green the last two days.
What do you think? Let's have a great day!

Lean Hogs Catch Their Breath
Lean Hogs
Technicals (July): July lean hogs were able to breakout above trendline resistance and the 50-day moving average which led way to an extension to our next resistance level mentioned in yesterday’s report, we’ve defined that wide ranging pocket as 112.825-114.00. Previous resistance will now act as support, that comes in near 110.50-111.475.
Resistance: 112.85-114.00****, 117.025-117.85**
Pivot: 110.50-111.475
Support: 103.35-103.70****, 101.30-101.60**, 97.375-98.00****
Futures trading involves substantial risk of loss and may not be suitable for all investors. Trading advice is based on information taken from trade and statistical services and other sources Blue Line Futures, LLC believes are reliable. We do not guarantee that such information is accurate or complete and it should not be relied upon as such. Trading advice reflects our good faith judgment at a specific time and is subject to change without notice. There is no guarantee that the advice we give will result in profitable trades. All trading decisions will be made by the account holder. Past performance is not necessarily indicative of future results.

Live Cattle Retreat. Will Support Hold?Live Cattle
Technicals (August): August live cattle were under pressure all day yesterday, trading down to the low end of our first support pocket, 134.85-135.35. Yesterday’s low was 134.85. If the Bulls cannot defend this pocket through today’s session, it may open the door for another leg lower, with the next support pocket coming in near 132.45-132.775. On the support side of things, the Bulls want to get back out above yesterday’s high and the 100-day moving average, 135.975 and 136.60.
Resistance: 137.90-137.95**, 138.75**, 140.275**
Pivot: 135.975-136.60
Support: 134.85-135.35***, 132.45-132.775**, 129.975-130.725****
Futures trading involves substantial risk of loss and may not be suitable for all investors. Trading advice is based on information taken from trade and statistical services and other sources Blue Line Futures, LLC believes are reliable. We do not guarantee that such information is accurate or complete and it should not be relied upon as such. Trading advice reflects our good faith judgment at a specific time and is subject to change without notice. There is no guarantee that the advice we give will result in profitable trades. All trading decisions will be made by the account holder. Past performance is not necessarily indicative of future results.

Can Feeder Cattle Rebound with Lower Corn Prices?
Feeder Cattle
Technicals (August): Feeder cattle futures failed against our resistance pocket from 175.50-176.125 which put them in reverse. August feeders filled the illusive gap, which was a gap lower on June 13th but a gap higher on June 21st. Yesterday’s failure to get out above technical resistance was somewhat of a caution flag as it did mark lower highs, but no significant damage was done to the chart. Trendline support and the 50-day moving average remain intact, that comes in from 171.45 (50 dma)- 172.40 (trendline support from the May 23rd lows.
Resistance: 175.50-176.125**, 176.80-177.075***
Pivot: 173.75-174.02
Support: 171.45 -172.40****, 169.40**, 167.325**
Futures trading involves substantial risk of loss and may not be suitable for all investors. Trading advice is based on information taken from trade and statistical services and other sources Blue Line Futures, LLC believes are reliable. We do not guarantee that such information is accurate or complete and it should not be relied upon as such. Trading advice reflects our good faith judgment at a specific time and is subject to change without notice. There is no guarantee that the advice we give will result in profitable trades. All trading decisions will be made by the account holder. Past performance is not necessarily indicative of future results.

BTCUSDLooks like we are close to the end of the C wave on the daily timeframe. Sell volume is decreasing on the 2 hour timeframe with the current candle painting bullish (doji) at the moment with that in mind. We are in a session high volume area on the 2 hour timeframe. On the daily, we are potentially recovering and entering a retracement to the current wave and I want to see if we can retrace anywhere between 38% to 61% of wave C. The macd is also showing signs of momentum loss on the bear sentiment. The current daily candle opened higher than the previous candle's close. Let's see what happens.
What do you think?

AAPLI wanted to publish this earlier. I did enter this trade at open so be careful of any pullbacs. Looks like we may be done with the C wave of the elliott wave.I want to see if price can retrace wave B between 50 to 61%. The current daily candle has some buyer volume in and the previous candle is bullish with high sell volume. Keep in mind that RSI is oversold and may be crossing the 20 threshold. The Mac D is also on the bottom side and may start to lose bearish momentum. Let's see what happens.
What do you think?

EURGBPLooks like we have a strong wick rejection right at the 200 ema on this timeframe. We could potentially be at the start of the C wave retracement toward previous low. We are oversold on the RSI and the Mac D is just about to cross so we might be a tad bit early on this trade and could possibly gain more bullish before the retracement is true just being honest. That is a possibility. If you look at the volume profile to the right, you will see that the current price is in a high sell volume zone. The selling pressure is starting to shift down a bit with a red candle open on the weekly. The bulls are still fighting so let's see how this looks by the end of the week. I only want to see if we can retrace 38% of the previous low. However, due to price action and wave analysis, I left the 61% and 100% targets there just in case.
What do you think?

VTI (Total Stock Market)On an analysis earlier that I published, the DXY may be ready for a retracement to the previous wave low. Now reeling back in on the VTI Looks like we may be close to being done with the C phase on this timeframe. Wave C has so far retraced Wave B up to 161%. I don't want to get too greedy until we see economic indicators start to peak out. However, I would like to see if we could reach the 38% retracement of Wave C in the near future. We still ended the week with large sell volume. However, on the 12 hour time frame, some of that sell volume has started to weaken down a bit. We may be early on this assumption. The K and D of the RSI has reached an oversold point. They haven't crossed up past the 20 level just yet. The MacD has crossed the zero line but hasn't shown any indication of momentum shift just yet. I want to be careful with price targets here so I will only keep it at the 38% level for responsible trading. Let's see what happens!
What do you think?

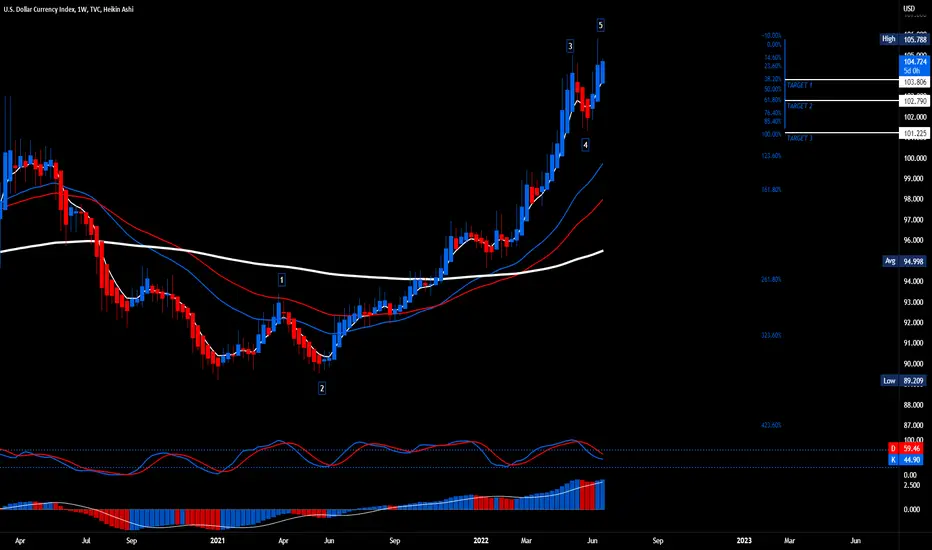
DXYLooks like we are in the middle of wave 5 of the Elliott wave. It may take a while for this wave to "potentially" retrace to the previous low of wave 4 up to 38%, 61%, or 100%. I would love to see that. I personally believe that we are getting closer to peak inflation although there are other factors contributing to the dollar's strentgh. From last week's reading, we might have open lower than the close. I see strong wick rejection from last weeks candle and would like to see if the bears start to take control. Our K and D of the RSI have started a cross down from overbought position on the daily timeframe and has already started the momentum downwards on the weekly. The MacD is losing momentum on the 12 hour timeframe so even though it hasn't shown true weakness yet on the weekly or daily in regards to a true momentum shift, we may be a bit early on this. Let's see what happens!
What do you think?
NZDUSDLooks like we are in the middle of a C wave of the Elliott wave. I want to see if this current wave (if valid) can reach the 61% or the 100% of wave B's high. Price jumped bullish at the double bottom located where the circle are. We may be a tad bit late to this trade. However, there is low sell volume on the current candle as we are also oversold on the RSI while making an attempt to cross up past the 20 level. Our Mac D zero line has crossed and may lose some momentum down the road. Let's see what happens!
What do you think?

AUDUSDPotential Double Bottom on Daily Timeframe. We may be in the C phase of the Elliot Wave so I want to see if we can retrace the previous B wave at the 38%, 61%, or 100% level. The current daily candle has low sell volume. We are also at and oversold point of the RSI as it is attempting to cross up past the 20 level. MacD has also crossed the zero line and may lose bear momentum in the near future. Let's see what happens.
What do you think?

EURCADAfter a very good rally up yesterday .. one should expect like a correction or retracement right , also with a clear change of character on the 15m in london session creating a good liquidity to be taken out during the NY session i think this might be a good trade
Note .. take partials and set BE ones it clears the retracement of liquidity leg , alway pay yourself right 😍😘😘😘

GOLD looking likely to rebound, but expect manipulation...The zone/region just above $1,850 should provide an area of support for a potential rebound and recover some of its earlier losses this week.
I wouldn't jump in long at this point as we are looking to experience more manipulation in sight of the fed interested rate decision later tonight. But at this price point we could see a new leg to the upside approaching. Especially as we are now resting on the 200 DMA.

ETHUSD (Mobile)Inverted head and shoulders. Quick 38% to 61% move before next retracement wave. Inverted wave 4 coming up!
Let’s see !

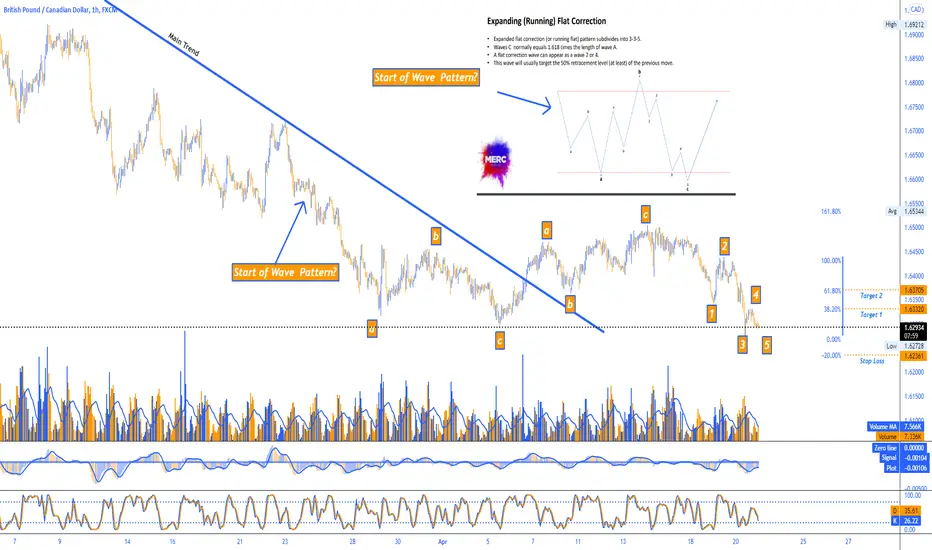
GBPCADMight be looking at an expanding running flat correction wave here. Phase "1" may be a bit over extended but the pattern may still be valid. We also have strong support at this level and is in accumulation stage potentially. Maybe we can get between 38 to 61% of the most recent high at some point down the road. I might've got n a tad bit early as the RSI hasn't reached an oversold point just yet. However, should be interesting how this plays out. Stop loss is set regardless for risk management.
GMLooks like we are in a WXYXZ Wave.
MacD and RSI overbought.
I want to see if price can reach the Y phase. However, I only want to see price make it between $40-$41. Small move but testing out a theory here. Which is 38% - 61% towards the "y"

DXYI want another pullback in the markets. But the market don’t care what I think . Hopefully this works out and we get a pullback large or small .
We could be at the end of the C phase and am looking for a retracement to the "5" wave 38% to 61%. Mac D and RSI is matching with the zero signal line having crossed over towards the down side.
What do you think?

GBPUSDWorking on Elliot waves so correct me if wrong.
Looks like we are nearing an end to the w-wave phase and entering the "x" phase. If so I would like to see a retracement of 38-61% of the "x" at the most recent double top. The 4 hour is oversold but the daily isn't yet. Could have more room to drop but I want to scale in now for a long term hold.
What do you think?
