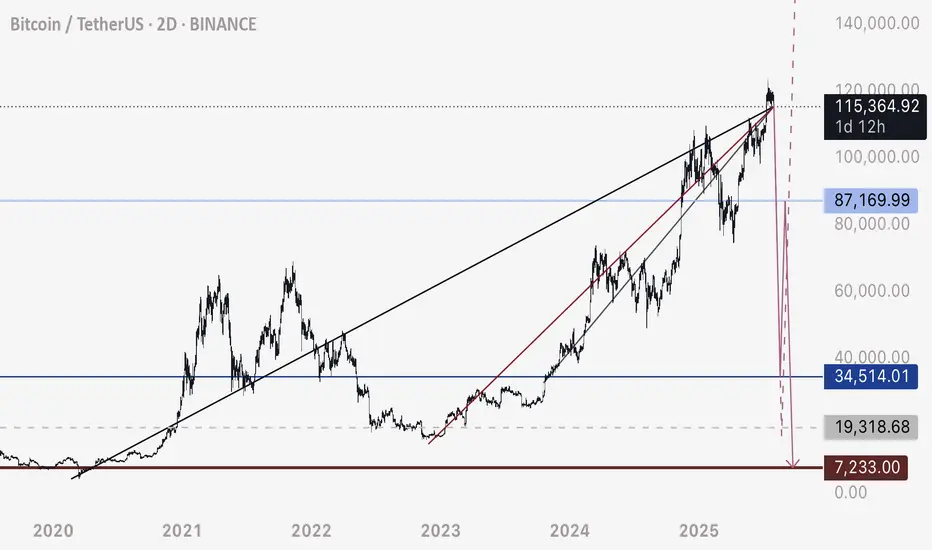
BTC - Not the End of the DropRather the beginning. Bitcoin has fallen below this bearish intersection. Anticipating price to fall rapidly on one of these two pathways to the Uber low liquidity levels.
DXY is retesting a major bearish breakdown - this is the conduit that will justify a flash crash of this magnitude prior to a 3-5 year bull run.
Happy trading.
Tradesetup
HOW TO TRADE 'BIG CANDLE"This is an educational video showing a trade set up based on big candles.
This video is for information/education purpose only. you are 100% responsible for any actions you take by reading/viewing this post.
please consult your financial advisor before taking any action.
----Vinaykumar hiremath, CMT

GBP/JPY: A Key Short Setup Forms as Momentum FadesHello traders,
Taking a look at GBP/JPY on the 4-hour timeframe. After a significant run, the price action has stalled, and we're seeing clear signs of fading momentum. This is creating a well-defined consolidation zone, which may present a key opportunity for a short position.
The Technical Picture 📊
1️⃣ Price Consolidation: GBP/JPY is currently trading sideways within a tight range, highlighted on the chart. This period of indecision and balance between buyers and sellers often precedes a significant directional move. The structure suggests a phase of distribution may be underway.
2️⃣ Fading Momentum: The Relative Strength Index (RSI) confirms this loss of momentum. A sustained reading below the 50 midline would signal that sellers are beginning to gain control and that the path of least resistance is shifting to the downside.
The Strategy 🧠
The core idea is to anticipate a bearish breakdown from the identified consolidation zone. A clean break and hold below this range would serve as confirmation that sellers have taken over, providing an opportunity to enter a short position targeting a continuation of the larger bearish move.
Trade Parameters 📉
👉 Entry: 198.895
⛔️ Stop Loss: 201.405
🎯 Take Profit: 192.872
Risk/Reward Ratio: approx. 2.4
This is my personal analysis and perspective, not financial advice. Always conduct your own research and manage your risk accordingly.
Good luck, and trade safe.

Bitcoin Day Trade Signsl To Buy NowIf this trade plays out I will make 7x my risk!
Subscribe to my YT channel at DNiceFx to watch me trade live!!

EURAUD Weekly Trade Setup(14 to 18th July 2025) - Head&ShoulderThis week, EURAUD (Euro/Australian Dollar) has entered a critical price zone, providing a textbook technical opportunity for traders. A clear Head & Shoulders pattern has formed on the 4-hour chart, pointing toward a potential trend reversal from bullish to bearish.
Let’s explore how to trade this intelligently from both bullish and bearish perspectives.
1. Bearish Setup – Head & Shoulders Pattern Breakdown
This is the primary trade idea for the week.
✅ Trade Logic:
Price has completed a classic Left Shoulder → Head → Right Shoulder formation.
The neckline (support) will be tested.
The current price is will pulling back to retest the right shoulder resistance zone, offering an ideal short opportunity.
🔻 Entry Plan:
Wait for bearish reversal confirmation (candlestick rejection or bearish engulfing) on the 1H or 4H timeframe.
Enter short once confirmation appears near 1.7850–1.7900.
📉 Stop Loss:
Place SL above the right shoulder high, adjusting for volatility and swing high (around 1.7950).
🎯 Targets:
Target zone: 1.7450–1.7500 (profit booking zone marked on the chart)
Potential Risk/Reward Ratio: 1:2, 1:3, or even 1:4+
2. Alternative Bullish Setup – Reversal at Neckline (High Risk)
This setup is for experienced or aggressive traders who spot early reversals.
✅ Trade Logic:
Price may bounce from the neckline and 200 EMA support area.
If this happens, a temporary bullish reversal may push price back toward the right shoulder zone.
🔺 Entry Plan:
Wait for bullish confirmation (reversal candle) near the neckline and EMA support (around 1.7700).
🚨 Stop Loss:
SL must be below the neckline swing low (around 1.7650).
🎯 Targets:
Resistance zone (right shoulder): 1.7850–1.7900
R:R setups of 1:2 or 1:3 possible
⚠️ This is considered a counter-trend trade and should be traded with caution.
3. Technical Confluence and Indicators
Pattern: Head & Shoulders (bearish reversal)
EMA 200: Price reacting around the long-term trend line
Support/Resistance: Cleanly defined horizontal zones
Reversal zones: Highlighted in red (supply) and green (demand)
4. Final Thoughts
This week’s EURAUD setup is a strong example of structure-based trading. With a well-formed head and shoulders pattern and a clean neckline break, the market signals a shift in momentum.
Safe Approach: Trade the short side after resistance rejection.
Risky Approach: Try a long on neckline bounce with tight SL.
Always confirm with your system and maintain strict risk management. Trade what you see, not what you feel.
Ready to trade? Save this setup, monitor price action, and execute only with confirmation.
=================================================================
Disclosure: I am part of Trade Nation's Influencer program and receive a monthly fee for using their TradingView charts in my analysis.
=================================================================

BTC - Zoomed Out ScenarioAs predicted DXY has broken down a major monthly bearish trendline - currently finishing a bearish retest before further free fall.
If this plays out we have 2-3 years of a weakening / correcting dollar, and a strengthening investment in assets such as Bitcoin.
This means an extended bull market spanning 2-4 years on Bitcoin and equities.
However - there is a mass amount of liquidity to the uber lows towards 10,000 on BTC.
Market is showing manipulated intention to hit these lows by keeping the price below this bearish cross section - and that’s why bitcoin hasn’t been moving up yet.
This tells me this is more likely than we all think to play out.
I’m trading the following:
Short - 108,200 to 35,000
Long - 35,000 to 80,000
Short - 80,000 to 10,000
Will update accordingly if the plan changes.
Happy trading.

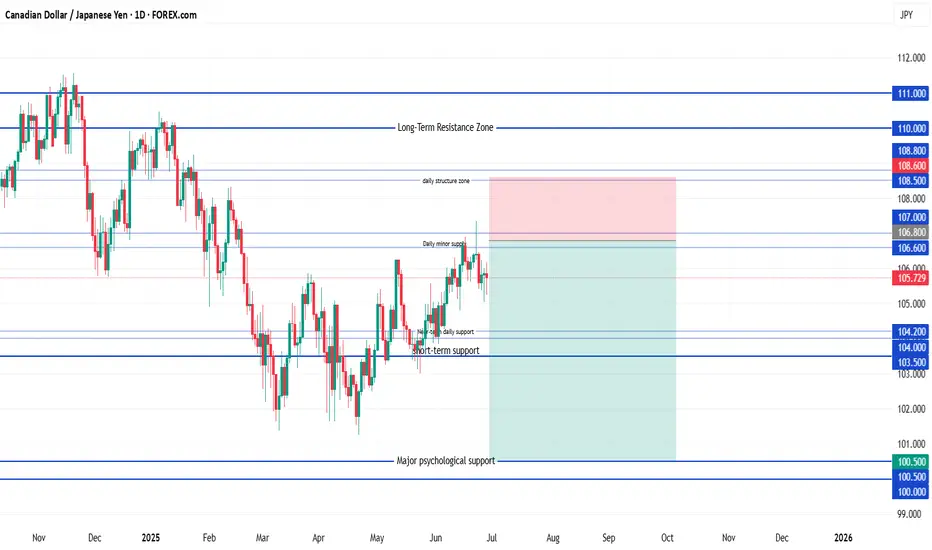
CAD/JPY ShortSell Limit Entry: 106.80
(Just under the resistance trap zone: 106.60–107.00)
Stop Loss: 108.60
Target 1: 104.20
(First minor support zone)
Target 2: 103.00
(Deeper support + recent structure base)
Target 3 (Optional hold): 100.50
(Long-term structural support zone)
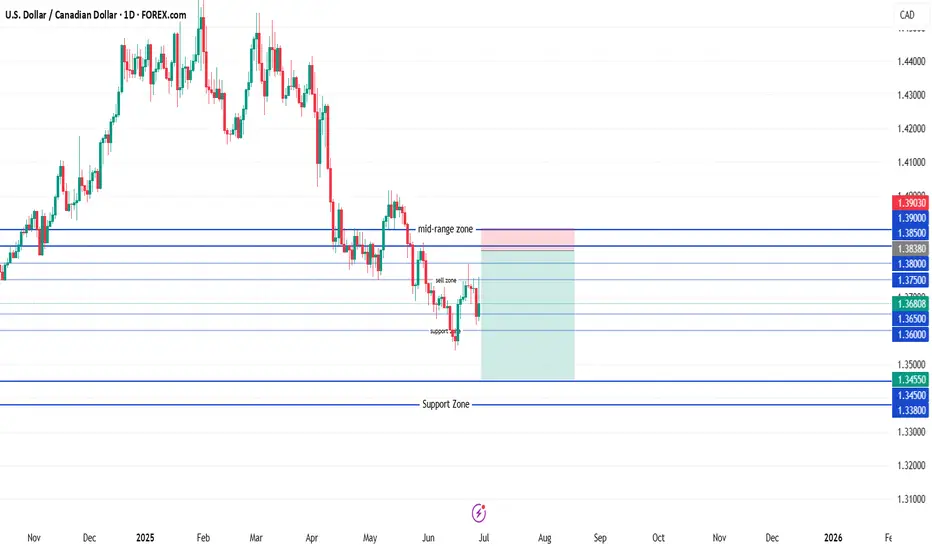
USD/CAD ShortSell-limit order: 1.3838
Stop-loss: 1.3903
Target 1: 1.3705
Target 2: 1.3605
Target 3 (optional runner): 1.3455
Place the limit at 1.3838 and keep the stop above 1.3900; scale out at the listed targets as price moves in your favor.
Why BTC hasn’t moved up recentlyBTC has been bobbing above and below this bearish triple crossover the past few months. What we see as consolidation is rather price getting stuck around these resistance levels.
The only reason why this would be occurring in my view, is due to the market makers having intention to allow this drop to play out.
The resistance is located at around 107,000 to 107,400 - watch this zone closely for a hold below / rejection and fast drop.
Scenario 1 marked with solid red line.
Scenario 2 marked with dotted red line.
Little update for y’all. Happy weekend trading.

SUI Is Ready To Run!Good Morning Trading Fam,
I'm putting out a quick trade setup here on SUI, a coin I am honestly a long-term hodl'er of. I believe this coin has an exciting future ahead of it with tremendous potential to change the blockchain landscape for the better.
But this post is for those of you interested in trading it.
We have a perfect setup here. Descending bullish triangle, which we are nearing the end of. Strong long-time support underneath us. And my proprietary indicator has given us a buy signal at the point of confluence of both of the above. I have set three targets for you. Obviously, the higher the target, the higher the risk. Trade accordingly and let me know in the comments how you did. It makes me happy to know my followers are successful in their trades.
Best,
Stew

GBP/USD Downtrend Wedge Breakout Setup – Bullish Target AheadThe GBP/USD pair is currently displaying a downtrend wedge pattern, a structure that typically signals a bullish reversal when confirmed. The pattern is formed by a descending resistance trendline (in red) and a gradually sloping support line (in green), converging to a point. Price has bounced off the wedge’s support multiple times while forming lower highs, creating pressure that often leads to a breakout.
As seen in the chart, the pair recently surged toward the upper resistance line and is now attempting to break above it. A successful breakout with bullish candle confirmation could lead to a strong move upward.
📈 Breakout Scenario
If the price manages to close above the resistance zone (~1.3490–1.3500), it would confirm the wedge breakout. Based on the height of the pattern, the projected breakout target is around 1.3692. This target is calculated by measuring the vertical height of the wedge and adding it to the breakout point. Confirmation of breakout should ideally include a retest of the broken resistance acting as new support.
📉 Rejection Scenario
However, if the breakout attempt fails and the price gets rejected again from the red resistance line, the pair could retest the wedge’s support area around 1.3360. A breakdown below the green zone would invalidate the bullish outlook and suggest continued bearish pressure.
⚙️ Strategy Tips
Buy Setup: Enter after breakout candle closes above 1.3500 with stop loss just below breakout zone.
Take Profit: Use the 1.3692 level as the primary target or scale out on the way up.
Confirmation: Always wait for breakout confirmation before entering; avoid false breakouts.
✅ Conclusion
This wedge breakout setup offers a bullish trading opportunity if confirmed. The clear structure, repeated tests of both support and resistance, and recent momentum build a strong technical case. Still, confirmation is key before initiating any positions.
=================================================================
Disclosure: I am part of Trade Nation's Influencer program and receive a monthly fee for using their TradingView charts in my analysis.
=================================================================

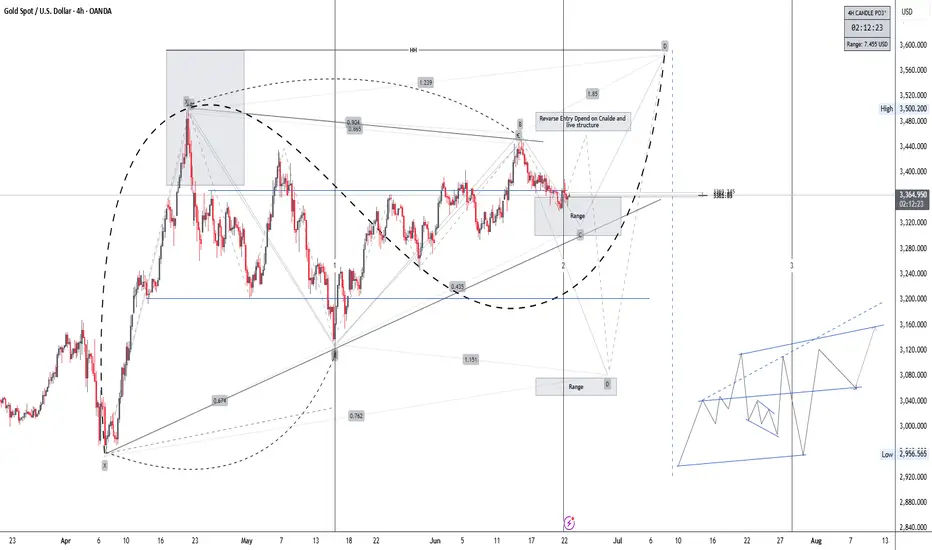
XAUUSD H4Gold is forming a bullish structure on the 4H chart. Price is consolidating at a key reversal zone (Point C). If we get bullish confirmation, I’m targeting:
$3,400 short-term
$3,500 next
$3,560+ final leg (Point P)
Support at $3,300 must hold—below that, I’ll re-evaluate.
Watching closely for a breakout and retest above the trendline before entering.
Not financial advice – just my view.
USD/JPY Short1. Intervention-fade (always live)
Sell Limit 146.00
Stop Loss 146.80
Take-Profit 1 144.50 – if hit, move stop to breakeven
Take-Profit 2 143.00
Good-till-cancelled: auto-cancel if not filled after 5 trading days
2. Break-and-retest (place this only after a daily candle closes below 145.00)
Sell Limit 145.20
Stop Loss 146.00
Take-Profit 1 144.00
Take-Profit 2 143.00
Good-till-cancelled: auto-cancel if not filled within 5 trading days of being placed
Rule: the moment one of these orders fills, cancel the other so you never have two USD/JPY shorts open at the same time.

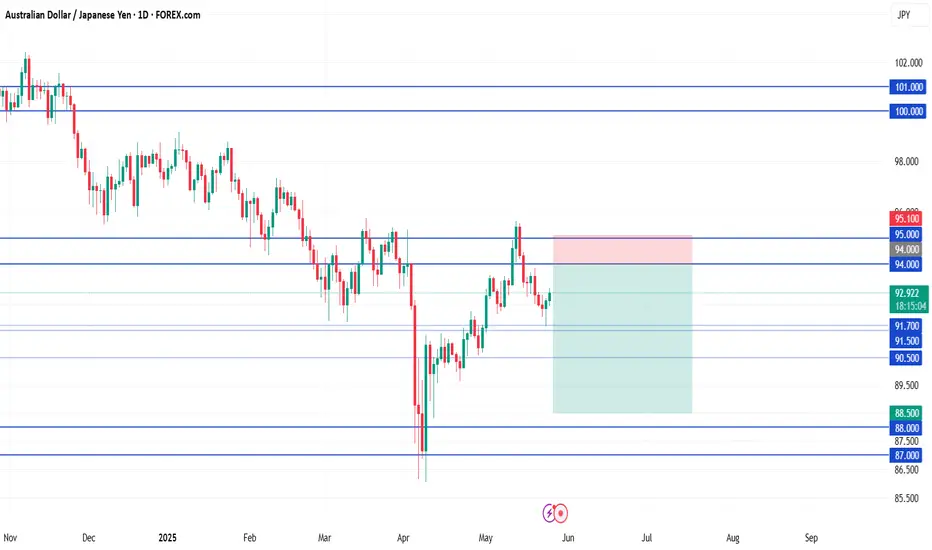
AUD/JPY ShortSell-limit (primary) 93.90 — front-runs the twin highs at 94.00 (May and again last week).
Stop-loss 95.10 — just above the 2024 YTD peak and round-number 95; if price closes above, the breakout is real.
Take-profit 1 91.50 — first daily support shelf; locks ~240 pips (≈ 1.6 R) and is often the first bounce zone.
Take-profit 2 88.50 — November-2023 base / 200-day SMA; full mean-reversion target (~540 pips, ≈ 3.6 R).
Filter to keep order Only leave the order active while the daily candle closes ≥ 93.80 (shows the lid is still respected).
GTC Cancel the order if unfilled after 5 trading days; reassess next week.
Quick rationale
Fundamentals: RBA leaning dovish; JPY could firm on BoJ hawkish hints & intervention risk.
Technical: Double-top near 94; bearish RSI divergence on daily; room down to 91s/88s.
Risk-reward: 120-pip risk vs. 240 / 540-pip reward = 1.6 R and 3.6 R pay-offs.
Place the limit, set the filter alert on daily closes, and let the trade come to you—no need to babysit intraday moves.

BTC - On its way down from these trendlines How low can we go? We will find out.
Three bearish intersecting trendlines above.
Short began initiating from above as per my previous post.
I personally am not ruling out a flash crash to 10,000.
DXY is breaking down a major bearish trendline on the weekly / monthly - Market has a prime opportunity to manipulate Bitcoin into all of these long stop losses and trigger a massive liquidation event.
Stay alert and safe!

BTC - Be mindful of resistance around 109,800 to 110,000Per my second last post about this red trendline - be mindful that there is a resistance located 109,800 to 110,000 zone.
Although Bitcoin can break above, that doesn’t mean the resistance is invalid. Price will weave above and below until it sticks and plays out.
Personally I watch these levels for sudden fast movement and confirmation that it’s holding as resistance.
If you see a fast drop initiate from these levels, be mindful that this could be indicative of intention to hit the lows around 20,000.
For more information see my previous posts.
Happy trading

AUD/JPY Short📍 AUD/JPY Short Setup – Sell Limit Order
Entry: 94.00
(clean retest of daily + weekly resistance zone, aligned with previous structure)
Stop Loss: 95.10
Take Profit 1: 91.00
(recent support shelf with high reaction probability)
Take Profit 2: 88.50
(strong weekly support zone; ideal mid-term target if momentum continues)
BTC Under Major Resistance HereBitcoin has shown strength towards playing out these ideas, as unrealistic as it may seem.
The interactions at specific levels have shown these trendlines to be valid.
I see two scenarios if BTC holds below its resistance at 104,550 to 105,000
104,600 to 35,000
35,000 retrace to 75,000
75,000 to 7,000
Alternatively:
104,600 to 20,000
Up from 20,000
While these seem like macro projections, per my previous posts and explanations - it’s possible to see this occur in a very small period of time. IE flash crash, stop hunt, etc.
Happy trading.

EUR/USD Long📍 Entry (Buy Limit):
1.1085
This is just above the 1.1000 psychological level but below previous minor structure at 1.1100.
Captures a shallow retest without risking being front-run by liquidity sweeps.
🛑 Stop Loss (SL):
1.0910
Below consolidation zone and wicks around 1.10
Provides enough space beneath the major breakout level while staying tight for R:R
🎯 Take Profit Targets:
TP1: 1.1500 (Previous weekly resistance, already tested but not broken)
TP2: 1.2000 (Next clean monthly structure level)
TP3 (macro): 1.2400 (Upper range of long-term channel, highly reactive zone)
⚖️ Risk/Reward:
Risk: ~175 pips
Reward:
• TP1: ~415 pips
• TP2: ~915 pips
• TP3: ~1,315 pips
R:R = 2.4 to 1, 5.2 to 1, 7.5 to 1

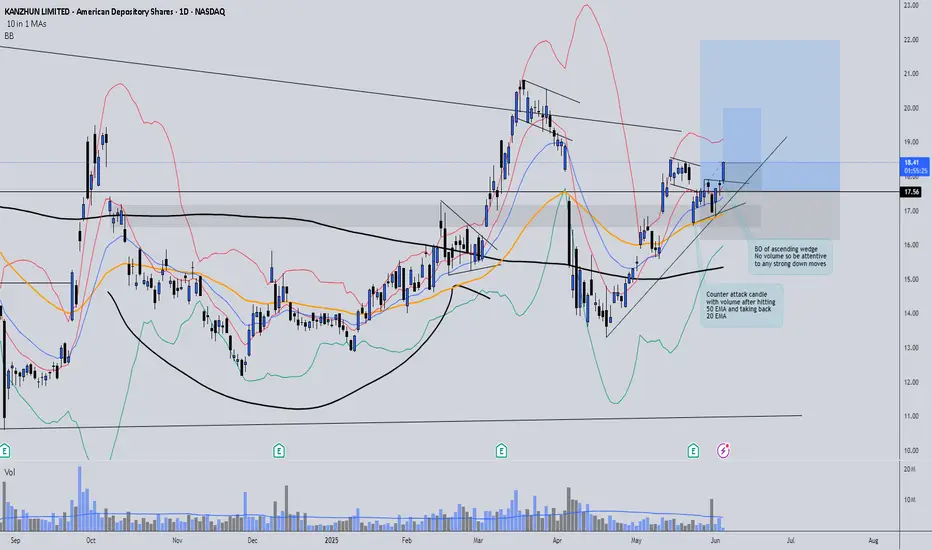
BZ BO of ascending wedgeBZ Trade Update 📈
BZ has shown strong bullish behavior after bouncing off a key support level. It has now broken out of an ascending wedge formation, offering another solid entry opportunity.
I've entered a second position and adjusted risk management accordingly:
✅ SL of the first trade moved to breakeven (BE)
✅ New SL set 1% below the second entry candle
Now it's a matter of patience and discipline, letting the trade play out while following the plan.
Stay consistent and trust your process! 💪
EURGBP Bullish Structure Analysis – Channel Breakout + Target🧱 1. Market Structure Breakdown
EURGBP has been trading within a descending channel, forming consistent lower highs and lower lows, which indicates a short-term bearish trend. However, price action recently broke out above the upper boundary of this channel, suggesting a potential bullish reversal or trend correction.
This breakout marks a significant structural shift in market behavior.
🔵 Old Structure: Bearish, confined within the channel
🟢 New Structure: Bullish breakout above trendline + key resistance zone
🧩 Implication: Change in directional bias; potential for long opportunities
📍 2. Breakout Confirmation
The breakout was confirmed by:
A strong bullish impulse candle that closed above the descending trendline
Price sustaining above previous resistance (~0.8405)
Increase in bullish volume at the breakout point (if volume indicator is used)
This suggests that the breakout is genuine, not a false spike or liquidity grab.
🌀 3. Retest Phase – The Critical Zone
After breaking out, the market is now pulling back to retest the previous structure. This is a textbook price action move:
🔄 What’s Being Retested?
✅ Upper boundary of the descending channel
✅ Major horizontal support/resistance zone (~0.8405–0.8415)
✅ Broken trendline from previous lower highs
✅ QFL base (Quasimodo level that was swept)
✅ 50% Fibonacci retracement of the breakout move
This zone forms a multi-level confluence area, making it a strong support for potential long entries.
🔍 4. Key Technical Observations
Element Description
📐 Descending Channel Defined the prior bearish structure. Breakout invalidates this bias.
🧱 Trendline Retest Acts as dynamic support; price currently sitting on it.
🔃 SR Flip Zone Old resistance (~0.8405) turned into support—critical level.
📊 Fib 50% Retracement Provides technical alignment with potential buying interest.
📌 QFL/Order Block Zone Historical demand was swept and now being respected again.
🎯 5. Target Levels & Trade Plan
If the structure holds and the price responds bullishly from the current zone, the next levels of interest are:
✅ Primary Target – 0.8460
A clear supply/liquidity zone from previous structure highs
Also aligns with psychological round number and Fib extension
⚠️ Interim Target – 0.8430
Previous intra-channel resistance level
May serve as a short-term reaction point
❌ Invalidation Level
A clean break and close below 0.8390 would invalidate the breakout structure
This would reintroduce bearish pressure and signal a potential fakeout
🧠 6. Trade Idea (Not Financial Advice)
Entry: Around 0.8405–0.8415 on bullish confirmation (e.g., engulfing candle, pin bar, break of minor downtrend)
Stop-Loss: Below 0.8390 (beneath structure & invalidation point)
Take-Profit 1: 0.8430
Take-Profit 2: 0.8460
This offers a high R:R opportunity if managed with proper confirmation.
🧭 7. Risk Management & Considerations
Avoid entering prematurely without a bullish signal (e.g., pin bar, engulfing, RSI divergence).
Monitor macroeconomic news—especially from BoE or ECB—as they can disrupt technical setups.
Scaling into the position or using a split TP strategy can help protect profits.
✅ Conclusion
This EURGBP setup is a textbook case of market structure trading:
A well-defined channel breakout
Followed by a clean pullback to structure
With confluence across horizontal, diagonal, and Fibonacci levels
If price respects this zone, bulls could drive toward 0.8460, offering a solid opportunity for traders who understand structure-based setups.
📌 Always wait for confirmation—structure gives us context, but entries need price action signals to minimize risk.

Bitcoin to $115k or pullback to $91kGood Evening Traders,
First I would like to say, congratulations to all of you who have been in the game for the last 3 bitcoin halving cycles. Through all of the "You buy fake internet money" comments or the never ending explaining of the Tokenomics of different cryptocurrencies, I have to say KUDOS to all of us who saw the vision, stuck to your guns and intricately added to your bags over the years! We are finally here on the cusp of full regulation and a final hush of the naysayers!
Ok, now down to brass tax! On the chart I have Highlighted a few important details. Something I did not point out on the chart is the massive printing of USDT that has been happening over the past few days. It seems to me that we are on the cusp of a massive influx of capital into the alt coin markets. But, for now lets focus on Bitcoin! As stated, you can see multiple points that I have highlighted... These being mostly bearish for the big dog of market cap and the grandfather coins of crypto Bitcoin. The first few things to notice is the bearish divergence on the MACD histogram, the bearish down cross of the MACD line over the signal line on the MACD indicator. You can also note the overbought area on the RSI right above that. In addition to this we do have some gaps on CME:BTC1! Which generally get filled sooner than later on most charts.
With this in mind, it is possible that we could have some good news amongst the movers and shakers down at the Bitcoin conference this week. Yet, we could get some sell the news type events that could ease the price downward to fill in these gaps that we have below. In my experience at the beginning of each alt coin season Bitcoin generally leads the rally and can trade sideways to down during the upward movement of the majority of the altcoin market.
My personal thoughts on the chart currently is shown at the top of the chart. if we close the daily candle underneath the hyperlocal resistance shown on the red line at the top of the chart, then we will most likely start pulling back to fill the first gap that is shown on the chart below in yellow. Albeit, the MACD is a lagging indicator, we can gain a lot of insight using it and my favorite sign on the MACD is using the histogram to point out bearish and bullish divergences. This shows a lack in momentum in the current trend that is shown through the price action of the assets trend. Especially, after a straight run up like we have just experienced as of late.
In conclusion, you can make the assumption that if we close the current day under the red line above it is very possible that we begin what could turn out to be an ABC correction leading us down to fill in the gaps on BTC1! to the downside. If we hold the first support, BTC may show us a little more juice potentially reaching for just under $115k. This in my opinion would likely be a bull trap for the time being. Summers are not the best when it comes to crypto growth and it always seems like we are waiting for the Ground Hog to see its shadow to find out if we are to the moon or back to McDonalds with our friends!
I hope that this analysis has helped you gain some insight in your research. I have added supports to the chart to show you where we may turn around and start heading back into price discovery.
Stay Profitable,
Savvy

BTC - Another Potential Bearish PatternHere I present my second alternative for a Bearish case for Bitcoin.
Per my previous posts I explain in detail the interest in recollecting liquidity in these lower zones. Previously I presented pathways to the uber lows at 7,000-10,000 - however this is another possible case.
I believe Bitcoin can see a drop from 109,200 straight down to 19,000-20,000
Why?
1. Major Volume support at this level
2. Major liquidity pools in confluence with this level
3. Price would form a W bottom with a higher low - which aligns with DXY breaking down on the monthly time frame. We can use DXY to project a bull market spanning 2-5 years (weakening dollar = more interest in deflationary assets such as Bitcoin)
4. Per the note above, it’s unlikely that BTC continues straight up without a sharp drop. The way this market works is to a large degree with leverage trading. The market and exchanges desperately want to shake out these longs, especially if we consider a 2-5 year bullish forecast through a macro view.
5. Confluence with this diagonal trendline which shows a clear support / resistance structure (note the Bitcoin chart is formed via diagonal ascending support and resistance lines - we can demonstrate this clearly and repeatable by duplicating the correct trendline and seeing how it forms the chart at any location)
Personally, I am shorting Bitcoin from 109,000 - and am expecting to see a fast drop through the rest of the weekend.
I will watch what the price does, where it reacts and interacts, and attempt to get a head start on understanding the true bottom before this “true” bull cycle begins.
Happy trading
