BTC - Another Potential Bearish PatternHere I present my second alternative for a Bearish case for Bitcoin.
Per my previous posts I explain in detail the interest in recollecting liquidity in these lower zones. Previously I presented pathways to the uber lows at 7,000-10,000 - however this is another possible case.
I believe Bitcoin can see a drop from 109,200 straight down to 19,000-20,000
Why?
1. Major Volume support at this level
2. Major liquidity pools in confluence with this level
3. Price would form a W bottom with a higher low - which aligns with DXY breaking down on the monthly time frame. We can use DXY to project a bull market spanning 2-5 years (weakening dollar = more interest in deflationary assets such as Bitcoin)
4. Per the note above, it’s unlikely that BTC continues straight up without a sharp drop. The way this market works is to a large degree with leverage trading. The market and exchanges desperately want to shake out these longs, especially if we consider a 2-5 year bullish forecast through a macro view.
5. Confluence with this diagonal trendline which shows a clear support / resistance structure (note the Bitcoin chart is formed via diagonal ascending support and resistance lines - we can demonstrate this clearly and repeatable by duplicating the correct trendline and seeing how it forms the chart at any location)
Personally, I am shorting Bitcoin from 109,000 - and am expecting to see a fast drop through the rest of the weekend.
I will watch what the price does, where it reacts and interacts, and attempt to get a head start on understanding the true bottom before this “true” bull cycle begins.
Happy trading
Tradesetup

MNQ Trade Setup -- Waiting for Flash PMI ImpactI’m holding off on a re-entry as we approach the Flash PMI at 9:45 AM. My bias is that there’s a potential for price manipulation to push higher above buy-side liquidity, taking out the highs before continuing lower. I’m waiting for the PMI release to confirm this idea and get better clarity on the market direction.
Bias: Expecting a possible manipulation higher to take out buy-side liquidity, followed by a continuation lower.
Waiting for Flash PMI to unfold before making any further decisions.

CAD/CHF Short
🔻 CAD/CHF Swing Short Setup
Sell Limit Entry: 0.6040
Stop Loss: 0.6115 (above recent daily highs)
Take Profit 1: 0.5800
Take Profit 2: 0.5700
Risk-to-Reward: ~2.6:1 to TP1, ~4.5:1 to TP2
Fundamentals:
CAD is weakening from falling oil, soft economic data, and global trade risk.
CHF is gaining on risk-off sentiment and its safe-haven status.
Technical Confluence:
Monthly chart just broke below long-term support at 0.6000 for the first time ever.
Weekly chart shows price retesting 0.6000–0.6050, a perfect break-and-retest setup.
Daily shows price stalling beneath resistance without strength — no bullish breakout attempt yet.
Target Logic:
TP1 at 0.5800 is just above the panic wick zone — realistic and conservative.
TP2 at 0.5700 aligns with the extreme 2015 SNB spike low — stretch target only if momentum continues.

AUD/CHF ShortBias: Bearish AUD/CHF
AUD Weakness
RBA inflation (Trimmed Mean CPI YoY) slowed from 3.3% → 2.9%
Global risk sentiment is fading due to weak U.S. data, trade tensions, and slowing growth
AUD struggles in risk-off environments and with declining China demand
CHF Strength
Safe-haven flows remain strong as markets de-risk
Swiss CPI is stable, and the SNB remains steady — CHF attractive in low-volatility regimes
CHF favored when yield-chasing slows down
📌 Technical Coordinates – Short Setup
Sell Limit Entry: 0.5400
Stop Loss: 0.5525
(Above daily structure high and broken support zone)
Take Profit 1: 0.5000
(Key psychological and historical support zone)
Take Profit 2: 0.4800
(SNB spike zone, clean sweep extension)

AUD/JPY Short Bearish Trade Plan (Conservative Structure-Based Entry)
Entry: 92.40 (Sell Limit at resistance)
Stop Loss: 94.10 (Above weekly structure and fakeout buffer)
Take Profits:
TP1: 89.00 (initial neckline retest)
TP2: 85.50 (structure base)
TP3: 83.00 (macro extension target)

Intraday Playbook ES Futures: Trade Setup & Context CME_MINI:ES1!
Big Picture Context
Please see related trade idea.
In this analysis, we refine our intraday levels to identify potential trade setups. We also review recent price action and present a high-probability long trade example that frequently offers favorable risk-reward dynamics when it plays out successfully.
See chart image below reviewing yesterday’s long trade opportunity.
Example Trade Setup: SFP Long
Time frame: 1 hour or 30 mins
• Entry: 5612
• Stop: 5595.50 (below SFP candle)
• Target: 5682 (mCVAH — confluence with recent highs)
• Risk: 66 ticks
• Reward: 280 ticks
• Risk/Reward Ratio: 4.2 R
Note: Past performance is not indicative of future results.
________________________________________
Intraday Market Structure Review
What has the market done?
• ES Futures have rallied and reclaimed a key technical level.
• Currently trading above:
o March 2025 low
o 2025 mid-year level
o Developing Value Area Low (VAL) for the 2025 Volume Profile
What is the market trying to do?
• Recover prior months' losses.
• Price action is climbing steadily, establishing higher lows.
How well is it doing?
• Despite headline risks, ES futures show resilience.
• Price has painted green candles in the full session for the past 10 consecutive days—a strong bullish structure.
________________________________________
What Is More Likely to Happen from Here?
Scenario 1: Pullback and Continuation Higher
A pullback toward the 0.618 Fib retracement and mCVAH confluence could offer another long setup, targeting the April 2nd high. This is further supported by NQ already reclaiming those highs, with ES still lagging but showing strength.
Example Trade Idea:
Time frame: 1 hour or 30 mins
• Entry: 5688
• Stop: 5680
• Target: 5724 (May 2 High)
• Risk: 32 ticks
• Reward: 144 ticks
• Risk/Reward Ratio: 4.5 R
Target may be adjusted if relative volume and delta support strong momentum toward April 2nd highs.
________________________________________
Scenario 2: Further Consolidation
• Sellers push prices back into last week's balance/value area.
• Market consolidates and builds energy for a likely next leg higher.
• No short setup is presented, as current risk and stop placement do not justify initiating short positions.
Important Notes:
• These are example trade ideas not intended to be a recommendation to trade, and traders are encouraged to do their own analysis and preparation before entering any positions.
• Stop losses are not guaranteed to trigger at specified levels, and actual losses may exceed predetermined stop levels.

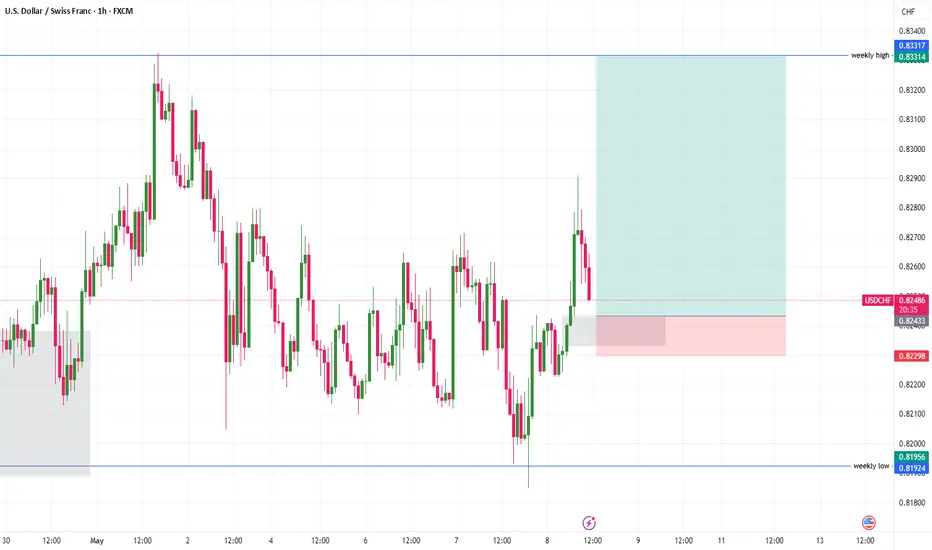
USDCHF Trade Idea, AMD PATTERN: last trade of the week for meClean setup unfolding on USDCHF! After grabbing liquidity near the weekly low (0.81924), price showed strength and reversed with conviction (AMD Pattern). Entered long from the refined demand zone and now eyeing the weekly high at 0.83317 as target.
📌 Trade Breakdown:
🔹 Entry Zone: Bullish reaction from demand
🔹 Confluence: Liquidity sweep + internal structure shift
🔹 Target: Weekly high zone at 0.83317
🔹 Risk/Reward: Solid R:R with protected downside below recent low
Let’s see if bulls can maintain momentum and drive us to TP! 📈🔥
#USDCHF #SmartMoneyConcepts #ForexTrading #LiquiditySweep #TradingView #TradeSetu
BTC - “Bull Market” OR Bearish Retest on HTF? Bitcoins excessive rise for the previous two years brings concern for the mechanics of this market. Moving only up for so long leaves much liquidity in the form of long position stop losses below the current price.
These stop loss orders, or leveraged sell orders, are an explosive chain reaction ready to set off.
Observe these two trendlines and copy them to your charts. These two bearish trendlines (in my view) are why bitcoin has truly been rising so freely.
Moves up in the form of bearish retests are fast and fluid, only after the rejection does price fall aggressively.
I anticipate two scenarios here in the realm of bearish ideas:
Possibility 1 - 30% Probability
96,700 to 34,500
34,500 retrace to 68,500
68,500 to 7,000
Possibility 2 - 70% Probability
96,700 to 43,000
43,000 retrace to 60,000
60,000 to 7,000
Note that both of these possibilities end with 7,000. I’m mapping out two routes that take us there, using confluences with trendlines, volume profiles, liquidity mapping, and common sense.
Be mindful of this possibility. And protect yourself accordingly.

Bitcoin - Back Under Intersecting Bearish TrendlinesBitcoin is back underneath these two intersecting bearish trendlines.
I have laid out two potential paths Bitcoin could take to play this out.
When an asset in crypto goes only up for so long, it leaves behind a trail of leveraged liquidity in the form of stop losses. These wide open gaps filled with long stop losses, is the fuel that would make such a move possible. In other words, the sell orders are already in the chart in order to make this possible.
Personally, I expect this to happen.
DXY is showing a major breakdown and bearish retest at the moment - with a falling dollar over the next 2-3 years, that translates to a true bull market for Bitcoin and related assets.
The market has a very small time window to recollect all of the long position liquidity in the chart, which is in the billions.
See my previous posts to see confluences, liquidity mapping, etc.
Happy trading and I will be trading this myself.

XRP break 2.24 bullish, is not, as low as $1.28Traders,
I have to make this quick I was bit by a brown recluse and put it off for a day or two longer than I should have. So I need to Skedaddle to the hospital super quick and fast!
Ok, here’s how I see it. I’m going to post this as a short to mid term trade but explain the long term possibilities. Considering this post is being done via my Moble rather than PC it just doesn’t make sense with my time and options.
so here’s what you’re gonna get the short term trade which I’ve labeled very clearly on the chart and the larger timeframe includes an Elliot wave analysis being that we clearly have a zigzagging consolidation wave that could do one of two things from here if we break about $2.24 we should be starting the next expansion wave. I will do an update if we do do that on this published trade to give an idea of where the price action could go but my immediate thoughts range from $9 to $27.
However, I want everybody to be cautious of a fake out as we are seemingly getting bullish on the weekend which I will be checking liquidity on all of the major alt coins and bitcoin before the weekend is over on our VIP live trading class that we do at 7 o’clock on Sunday night Eastern standard time. Yet, I will share my findings of the liquidity with everyone for this week only. As we definitely want to help as many newcomers and experience, traders, see manipulation, just in case it shows up before it plays out. There are many tools on trading view to find high buildup of large liquidity that the market makers could sweep down and take out if during this weekend we get really bullish And tons of money comes into the market from people’s tax returns, creating a pool of guppies that the market maker may just eat up one more time.
Which brings me to my thought of us potentially revisiting the .65 fib, the .618 or even all the way down to the .5 fib, which is at around $1.23. Nothing in trading is 100% so take my thoughts and stride. yet, I’ve been through three bull runs as a successful trader and market manipulation has been one of my main focuses purchasing mini subscriptions to different tools that give me information so we can take advantage of what the market maker does as opposed to be part of its liquidity grab.
For everyone reading this in the VIP group as you know normal time on Sunday, we will be having the recorded Zoom meeting, but I highly suggest that you make it because this is going one of two ways and there’s a big opportunity here to make some pretty serious pips in my opinion. If you’re not part of our group, I hope you use this information wisely in your research to come up with your decisions, but keep in mind, we are all just here for entertainment purposes! Following every single word from a trader online should never be your gospel to put tons of your money into the market in which ever way that trader is preaching the market will go. Learn risk management, if you don’t feel confident in the research that you’re doing or the traders that you are following are pointing at different directions just make sure you know why they’re pointing in that directions as it could quickly go both ways as we’ve seen recently. With that being said also know that the market maker always goes for liquidity point blank and simple! This is why the majority of traders are unsuccessful in this game because the easy information to learn online for free teaches you stuff that large trading firms have algorithms to find And come sweep in your losses to their profits.
I can’t necessarily say that the exchanges are our biggest worry, but it’s always made me believe most likely they are considering most of these exchanges are also trading as market makers, probably some insider trading with alot of them. The current element of little laws and wishy washy regulation (as much as it will likely stunt this bull run for a few months, or maybe not… being that Trump has given US regulating agencies 180 days from January to have firm regs in place) albeit, Some that are reading this, I’m sure take advantage of it yet, once it’s set in place we will have a little less wild, wild West and less decent traders in traditional markets who hate crypto because of the manipulation and the rug poles and what not will and I’m just guessing here most likely have a clear path to becoming a more profitable trade.
I’m not here to demonize exchanges just keep in mind they have all of the information that you have Placed on their exchange and given them freely by checking off the terms of service and signing up for your account. Lots of these exchanges still have very little regulation and trust you, Me that they are raking in as much as they possibly can to the extent of the little regulation in the country, they are regulated in if they are even bound to abiding by it, as I’m sure, as we know, some folks have already been arrested and indicted for certain things that I will leave for you to search and find on your own. But, my point being is you need to also be very careful of the exchanges that you choose.
In my best opinion, the exchanges with the most amount of liquidity on them makes it more difficult for manipulation to happen yet, it sure still does!
As always friends, stay profitable and I hope this rant that I just went on, helps you in someway over this Easter weekend and I pray you all have an amazing time with your families and if not, then have an amazing time trading and I hope my words have helped!
Stay Profitable,
Savvy

Fil Crypto Signal, we just make trading easier!Traders,
Here is the type of trade we like to give to our followers. Aside from the teaching of the allocation someone would take in this trade and understanding the risk management we teach or you learn about in trading this is how trades should be set up to best explain what to do, when to do it and how to do it so you can have the least risk and most gain as possible.
We will be giving all of our signals our moving forward like this to help our followers to maximize on a trade and minimize losses on the few signals that we post.
If you have any question about this signal or other feel free to shoot us a DM and we would be happy to break it down for you. You can also leave us a comment if it is related to this exact signal.
P.S. If you would like a specific analysis on any coin shoot us a DM with the ticker as we are giving out free analysis on any crypto or traditional assets for the rest of this week! Its going to be a great year, keep your eyes on the chart, your head out of the clouds and do not let the news outlets alter your knowledge of the charts. It seems like they work for the market maker if you ask me..... Op's!!!!
Stay Profitable,
Savvy

Spy what I see with my little eyeTraders,
Fear, trade wars, WW3, Tariffs and a bunch of I told you soo's..... "You voted for this!" just a bunch of chirping. Because this man got to being a billionaire being a silly goose yeah? What happens when them 401k's start 3x'n, what happens when we see one of the biggest bull markets we have experienced in our lifetime?
I don't know much but I know this..... the bull market may not be over. Just taking a break!
Enjoy the hopium!
Stay Profitable!
Savvy

Fil has BottomedTraders,
Like it or love it, this is an unpopular opinion in a sketchy time in the market. Regardless, our team thinks we have bottomed for alt, its discount season! You name it and it is at the bottom!!
We hope you enjoy a little hopium in these uncertain times!!
Stay Profitable,
Savvy!

AUD/CAD Short🔍 Technical Context:
Market Structure:
Price is in a long-term sideways range with lower highs. AUD/CAD is struggling to break above the 0.90–0.91 region, showing signs of exhaustion.
Zone of Interest (Supply):
Purple box: 0.9000 – 0.9100
A clean historical rejection zone that has acted as both support and resistance multiple times since 2022.
Entry Type:
Sell Limit @ 0.9070 placed slightly below the top of the resistance zone to increase likelihood of getting triggered on a spike.
Stop Loss:
0.9175 – above multiple wick rejections and key structure highs. Allows breathing room for volatility without compromising the structure.
Take Profit Targets:
TP1: 0.8650 (conservative target at strong support)
TP2 (optional extension): 0.8500 (major long-term range low)
Risk-Reward Ratio:
~1:3 minimum to TP1, potentially 1:4+ if extended to 0.8500.
🧠 Strategic Notes:
Trigger Conditions:
Wait for a retrace to the 0.9070 zone rather than enter at market open. This is based on the idea that a final upward effort could grab liquidity and fill your limit.
Monthly Candle Watch:
Monday is month-end. Monitor the monthly close to determine if the structure still supports the trade idea. If the close is strongly bullish and you’re triggered early, be open to closing the trade early to avoid deeper drawdown.
Why It’s High Probability:
Multi-year horizontal structure
Repeated failure to hold above 0.90
Candlestick wicks rejecting the same zone
Fundamentals slightly favor CAD over AUD (higher real yields, oil correlation)
Defined invalidation point and asymmetric reward

S&P 500 Setting Up for a Breakout – But Not Before One More TrapAs I’ve said before, the FOREXCOM:SPX500 is a key reference for my crypto trading . That’s why I sat down and took a closer look at the chart – and I’m now ready to place a limit order , based on what I’m seeing.
I believe we’re still in a correction phase , and it’s far from over . However, I think it’s realistic that we’ll see a move toward $5,832 next week . Before that happens, I expect either today’s Monday Low or next week’s Previous Weekly Low to get swept, ideally triggering a dip into the 12-hour Fair Value Gap just below.
That’s where I see my entry zone forming. It’s also the exact area where Wave B overshoots the starting point of Wave ABC, making it a clean Flat correction pattern, with Wave C completing to the downside before we get a solid move upward.
I’m setting my stop-loss below the $5,500 low. If this setup plays out, I expect the S&P to push toward $5,832 , and after that, I’m anticipating a larger correction that could take the index back down to $5,500 or even $5,450 over the coming weeks.
Timing remains unclear for that move after, but the structure is here , and I’m looking forward to seeing how it plays out.

USDCAD - Sell Trade SetupLooking to go short. Waiting for slight pullback to upside to then sell.
Leave a comment below, let me know what you think. Share with friends. Check out my profile for more awesome trade plans and setups
Trade Safe - Trade Well.
~Michael Harding CEO at LEFTURN

BTC - ABC Correction to Absorb Long Liquidity Further to my previous recent post, I wanted to highlight two indicators that accurately present us with liquidity on the BTC chart.
Connecting the pieces of the puzzle of this prediction - this ABC correction pattern allows the market to absorb the Long position liquidity left in tact on the chart.
Since these long positions leave a trail of leveraged sell orders (stop losses) - we should expect a mass chain reaction of these orders setting off one into the next, with increasing speed and momentum of the drop.
We do not need a black swan event for this to occur. The orders are already in the chart to allow it to happen, as an adverse consequence to open interest and open traders positions during the last 2 years.
There is many confluences to support this correction pattern, if interested in learning more, see my previous posts on Trading View.
Enjoy!

Reminder - Bitcoin back below these trendlinesI encourage you guys to draw these trendlines on your chart and experiment by doing some exercises.
1. Draw the main two trendlines.
2. Spend time on each by duplicating it, keeping the angle the same, and moving it to different spots on the chart. Notice how Bitcoin works on this ascending diagonal support resistance structure. You’ll find that the correct trendline can be duplicated infinitely and the price respects it at any point you place it.
3. Notice that price consolidates on these ascending lines. We see breaks above or below depending on the stop losses from futures positions and liquidity that’s collected. In other words, a break above doesn’t invalidate it.
4. Notice that Bitcoin moves above and below these trendlines.
5. It’s in my opinion that THIS is the structure that explains why Bitcoin isn’t moving higher, telling me the market wants to keep price below these trendlines and take back the liquidity in these zones (look at my previous posts for liquidity maps)
Personally this is still my trade.
God bless and may you live to trade another day!

BTC FOMC FLASH CRASH / LIQUIDATION IDEAThe FOMC data this week could be a conduit that sticks the price to play down these two trend lines.
We can see the mass liquidity on the chart in these low zones.
Bitcoins consistent rise since late 2022 has been leaving a train of long stop loss orders (leveraged sell orders) underneath - think of the mechanics of “why it’s possible” as a massive chain reaction of stop losses getting fired off and creating mania and hysteria for further fear based selling.
If we see drops to these low zones, I’m presenting the TA evidence of it so that we know it’s not the bottom - but a liquidation move.
The worst thing people could do is sell at massive losses thinking BTC is going to zero.
I see this move occurring and following that over the next years, a BTC pushing upwards of those $140-$200k zones.
The market is interested in reclaiming this liquidity - we are awaiting the conduit or event to justify it.
This is my personal trading plan.
Happy trading to all and be safe out there.

BTC - Back Underneath Flash Crash Liquidation ZoneBitcoin is back underneath these trendlines.
Showing confluence with liquidity in the chart on higher time frames.
Be mindful of this correction pattern.

TrumpHello Traders,
Today we are posting a trade we see that we know you are all eyeing. BINANCE:TRUMPUSDT
This is a trade we saw in our weekly trade hunt. If you are not familiar in TA and have a hard time understanding the chart feel free to reach out to us and we will happily help you understand.
Stay profitable,
Savvy

DOGE Holding Trendline Support – Another Rally Incoming?$DOGE/USDT is currently holding support at the rising trendline, which has historically led to strong upward moves. Every time the Stochastic RSI formed a bullish crossover near this trendline, the price experienced a significant bullish rally.
The Stoch RSI is currently in the oversold zone, similar to previous points where major uptrends started. If history repeats, DOGE could be gearing up for another strong move.
DYOR, NFA

Gold (XAU/USD) at a Critical Level – Key Zones to WatchCurrently, there is mixed bias in the market. On the higher timeframe (D1), the candle is rejecting with strong momentum, indicating selling pressure. However, there is also a possibility that it is forming a bottom wick, which could lead to a rejection from key levels like 2930.
Key Observations:
If 2930 acts as support, we may see a bounce, leading to a potential upside move.
If 4H sustains below 2930, it could indicate further downside continuation.
Trade Setup: 30m
🔹 Buy above 2045 if price shows bullish confirmation.
🔹 Sell below 2030 if price sustains under this level.
📊 Waiting for price action confirmation before entering a trade.
