Bitcoin Analysis - New Parallel Channel? Hello Traders! Here is my analysis for BTCUSD.
- First I want to say, I am currently sitting the market out for the time being. After incurring such massive losses on LUNA, I'm going to take a step back until BTC stabilizes or behaves in a more predictable manner. If BTC was to stabilize tomorrow I would happily start trading, but until then I'm playing it safe.
So how will I know when BTC stabilizes???
- One of the keys to success in trading is identifying predictable patterns, levels, formations, etc. in a chart.
- As of recent BTC has been incredibly unpredictable, which has made it very hard to accurately predict price movement.
- However... BTC may be trading within a parallel channel which would give us a better idea of the range in which BTC most likely will trade.
- If BTC can hold this channel, I will trade BTC between the channel.
- If the channel is broken, expect continuation to whichever direction price broke from.
Do Parallel Channels really work?
- Parallel channels are one of the most powerful formations in trading.
- Personally my primary intraday trading strategies are based off of channels and Fibs.
- If you remember, BTC was trading between a parallel channel from January to nearly May, and traded between the channel perfectly for those months which made trading BTC very predictable.
- As you can see price wicked below the channel last night but got a very nice bounce off that level. This is the first signal that BTC may be trading between the channel.
How Do We Know If The Channel Is Invalidated?
- It's very simple... If price breaks either below or above the channel (and does not immediately come back in) then the channel is broken.
So what's next for BTC?
***1st let me say, I will be keeping a very close eye on this channel. If it holds we will have an excellent channel to trade between.
- It's very hard to say at the moment, the events of the past couple days were unprecedented so that really makes it hard to predict what BTC will do.
- But... I would say the probabilities favor BTC staying in the range of $28.5K - $31K over the weekend.
- Truthfully BTC is overdue fro a large bounce and has been for days, but Crypto has a large dark cloud over it right now so undoubtedly that is affecting positive price movement.
How should you trade?
- If you are not an experienced trader I would be very cautious right now.
- Keep position sizes small 1-4% of portfolio, and be very selective with trades.
- Watch for BTC to go a few days without another large sell off, this will indicate some stabilization and may be a safer environment to trade.
Thanks everyone and best of luck trading. I apologize for not being that active this week, I got absolutely wrecked the other day and needed a break.
Tradesetup

BTC - Where to next? (LONG TERM VIEW)$BTC - Where to next? (LONG TERM VIEW)
I'd love a deeper pull back in $BTC... Here we see a formation developing, a break out to either direction! Could even be a bear flag... I'd be careful getting too hyper on buying the dips until it's confirmed! (That depends on your trade plan)
Take into account FED's, Inflation and various other metrics!
Have a great time trading cryptocurrencies...
Best,
TJ
(Disclaimer: Not Investment Advice)

GBPAUD D1 LONG> The previous week price tapped 1.71800 and got rejected, creating a double bottom on D1 time frame.
> Our current weekly candle is bullish with no bottom wich
> The previous daily candle tapped the 1.78400 area and closed above 1.77300
> I anticipate price to continue bullish and continue creating new highs
> Buy limit 1.77300 with stops below 1.76700
> Targets at 1.78445,1.79800 and 1.81500 respectively

BTC Short Term Targets - Will Price Continue to Fall?Hello Traders, here is my analysis for BTCUSD.
I want to start by saying... Hang in there everyone and don't give up.
- The past few days have been unprecedented in a lot of ways for Crypto, specifically BTC and LUNA.
- Personally I lost a massive amount of money on LUNA. I had a large long position that was liquidated and I also had a portion of my money in UST which I lost as well. In attempts to keep my LUNA position from being liquidated I had to buy more LUNA on 3 separate occasions to lower my liquidation price, ultimately I was liquidated.
- In total I lost nearly 30% of my portfolio between LUNA and UST.
This whole situation sucks and a lot of people lost an incredible amount of money.
- If you're unfamiliar with how this happened, the short of it is this:
- LUNA has a stable coin backed by BTC called UST.
- The stable coin became unpegged, panic ensued and people stared selling in mass driving down the price of UST.
- LUNA had to sell their BTC to bring the UST price back up. This also drove the price of BTC down.
- As of today LUNA is down 85% since a couple days ago.
So if you had a position in LUNA I feel for you. It's sad how many people were affected by no fault of their own.
On to BTC
This is going to be short. ***One thing to pay attention to is the releasing of the CPI number at 8:30a.m.
- If the CPI number is better than expected, the market will rally. If it's worse... well it's going to be another painful day.
- BTC tagged major support all the way down just below $30K. Honestly I wasn't expecting that to happen so quick, but with the whole LUNA situation it was the perfect storm.
- On a positive note, BTC is holding major support very well.
- If the CPI number is good, I'm expecting for BTC to get a nice bounce.
BTC Short Term Targets
- The 1st target I'm eyeing for BTC is at $34.4K. I think this will be easy for BTC to hit on a bounce.
- The 2nd target is at $37.5K. This would be the best case scenario and is a lower probability move.
- The highest I think BTC could go before getting rejected and trending lower is the $37.5K level. So this means I do not think BTC will go much higher than that for the coming months.
- After BTC gets rejected from resistance it will trend back to the $29K zone. This will be a massive test of support, I don't think it will hold on this retest and will fall below.
- What will follow is another massive sell off like we saw the past few days.
Summary
- BTC should bounce
- 1st target $34.4K
- 2nd target $37.5K
- BTC will get rejected, then trend lower and break $29K support
- Followed by another large sell off
***On a side note*** I'm not sure how active I'll be this week. I lost a lot of money yesterday and need to take some time to figure things out. I'll try to post if I can but I will be back.
Thanks everyone and best of luck trading!

Bitcoin at very important level#Bitcoin as anticipated hit $34k precisely which we have been calling for few days now, when everyone else online was screaming to go long and got trapped in a nasty fake out.
We currently are seeing #btc at 33.5k and is at the most important level in this cycle to determine its next directional flow. A break of $29,990 will most definitely send #bitcoin to 20-16.8k zone. Which is the next Higher TF demand zone.
Always remember, we are doing this completely for free , cause we have your best interest at heart for our fellow crypto investors. We are not “moon boys” or typical crypto influencers who ask you to buy every dip. Nope, We ask you to wait for precise levels and to buy as low as possible. The next buy zone is $20-16.8K, SET YOUR ORDERS AND BE READY.

AUDUSD to tap 0.7 before reversal Looking to see if we can see a quick move up on AUDUSD out of the 0.7 support then will definitely look for a buy off a right shoulder if created. Price looking very weak still so make sure you wait for confirmation if following my trade setups.

BTC Long Trade Setup - BTC Ready To Bounce?Hello Traders, here is my analysis / trade setup for BTCUSD.
Not much has changed since my last BTC post, the market has been asleep for the past couple of days so there hasn't been much action. Tomorrow when the stock market opens volatility will increase and BTC should start to move.
BTC hit the $34.4K Support level as predicted... Now the question is "Will this level hold and bounce, or will BTC break lower?"
- Truthfully there is no way of knowing, all we can do is make predications based off of probabilities.
- Right now the probabilities favor BTC holding the $34.4K support level and getting a bounce from here.
However... we have to be prepared for all scenario's. So if BTC doesn't hold the $34.4K level and breaks down further, how low could it go and what do we do?
- The next Major Support level for BTC is at $32.9K. This is the next level that BTC would hit.
- This level is a very strong level and the probabilities of BTC getting a sizeable bounce at this level are high.
- So if BTC hits this level and you entered a long at $34.4K, you will add to your position which will lower your average price.
- This is called DCA (Dollar Cost Averaging) and is a common strategy
What is the Target Level for BTC on a Bounce?
- The probabilities favor BTC getting a larger bounce, especially considering how massive the dump was the other day.
- It's possible that BTC rallies and re-tests the major resistance at $37.5K before getting rejected and heading lower.
- So my target take profit is at $37.5K
How I take Profits
- Where you want to take profits is up to you... I typically play between support and resistance and take partial profits at the .618 FIB for example.
- So for myself I will unload 50% profits at the .618 FIB at $36,346, raise my stop loss to that level and ride the rest of the profits out with the target being the next resistance of $37.5K. If $37.5K is hit, I might unload another 25% of profits and ride out the rest to potentially make even more.
- At the very least price might come back and hit the .618 Fib level which is where my stop loss is so I'm guaranteed profits there.
What's Next for BTC?
- After this scenario has played out, I am expecting BTC to eventually head even lower. Re-testing the Major low of last year at around $29K.
- I would expect a very large bounce at that level.
- It could be several weeks to months before that level is hit, we will just have to wait and see how things play out to get a better idea of what BTC will do.
Thanks everyone and best of luck trading!

iota looking good hereiota looking like its found support here
accumalating iota while we are down here
could see a nice move up soon

NEO looking greataccumalating neo at these levels, great risk reward here
could see a big move up soon

Ethereum Support & Resistance Levels - Long Trade SetupHello Traders, here are key Support and Resistance Levels for ETHUSD.
- It's important to have key levels drawn on your charts at all times.
- Personally I have 2 computer monitors. One is a HTF chart with levels drawn like with this ETH chart. The 2nd monitor is a LTF chart with multiple indicators.
- Use these levels to help determine where ETH will trade next.
- ETH should follow BTC, but keep in mind ETH typically outperforms BTC so it may have stronger bounces and smaller pullbacks.
Trade Setup
***We can use the BTC chart to coordinate what level ETH might hit if BTC falls to $34.4K.
- Most likely the $34.4K level for BTC would be around $2,650 for ETH which is also the Ascending Trend Line which acts as Major support.
- This could potentially be a great entry point for a long position as long as ETH hits this level soon.
- The take profit would around $2,825 which is the top of the falling channel and also between the .5 and .618 FIB levels. (Golden Pocket)
What's next for ETH?
- I'm expecting BTC to bounce in the coming days in which case ETH should as well. Most likely to the Take Profit zone mentioned above.
- Beyond that if BTC trend lower ETH will most likely break the bottom ascending trend line which will be very Bearish for ETH.
- Expect ETH to continue lower hitting each one of the support levels in the coming weeks / months.
- Bounces should occur at major support levels
Thanks everyone and best of luck trading!

Bitcoin Analysis - Bear Flag Breakdown Has InitiatedHello Traders, here is my analysis for BTCUSD.
Wow... what a day for the markets. If you recall in my post yesterday, I stated that the rally after the FOMC meeting was due to the news and was not a technical bounce. Today we see the result of that "fakeout". Since I started posting on trading view I have been warning traders that BTC was trading in mature Bear Flag formation and that a breakdown was imminent. - That breakdown has been initiated...
*** Note on Technical Analysis***
- On April 30th I made a post titled "Is a breakdown to $34K Imminent?" No I don't have a magical crystal ball, but I do know how to read the charts. I tell you this not to brag but to show you that it is absolutely possible to predict price movements by using technical analysis and closely watching for specific signals that the chart will give you.
- I'm sure you've seen the "Moonboys" on youtube and social media claiming "BTC is headed for new ATH's! and it's impossible for BTC to break $37K!"
- One of the keys to success in trading is being direction neutral and not letting your emotions cloud your judgement.
- You want to approach trading from a logical perspective not emotional.
BTC Analysis: Bearish
- BTC finally got the big move we were expecting. As you know BTC has been trading in a macro bear flag for months and was showing signs of weakness in the last couple of weeks.
- Our target of $34.4K has not been hit yet but most likely will be soon.
- I am expecting a decent size bounce off that level possibly up to $37.5K, which is major support turned resistance.
- If BTC is rejected off $37.5K expect further downside continuation back to $34.4K then to the next major support level at $32.9K.
- Eventually BTC will trend down the the low $30K region and may consolidate there for a while before continuing lower.
What would make BTC Bullish again?
- Th first major resistance level that BTC would need to break to have any Bullish hopes would be the major resistance at $37.5K
- Beyond that, the analysis from yesterdays post still applies which is BTC would need to break $43K to have a shot at $50K
- Based off my analysis there is a very low probability of this happening. But it's important to consider all possible scenarios.
***Keep in mind these moves could happen in days or weeks, either way as traders we do not care. We will adjust accordingly and maneuver in accordance with the charts!
Trade Setup
**1st, this trade setup is only valid through tomorrow morning. I like to take high probability trades and the longer it takes BTC to hit $34.4K the lower the probability of a large bounce.
- I will enter a long position in BTC if it breaks $35K by tomorrow morning. (If I decide to wait longer I will let you guys know in a comment update)
- My entry is anything below $35K
- There are 2 "Take Profit" levels
1) $36,321 - .618 FIB Level
2) $37.5K - Major Resistance
- I will add to the position if BTC drops in price before bouncing.
- Move stop loss into break even once price is in the profit by a couple percent.
If you have any questions feel free to message me or comment below.
Thanks everyone and best of luck trading!

Bitcoin Analysis - Is BTC Bullish Or Bearish? Hello Traders! Here is my analysis for BTCUSD.
** I'm sure most of you really want to know which direction BTC is headed... Is BTC Bullish or Bearish. We are going to answer that today.
Following the FOMC meeting today, BTC had a nice little rally. If you recall I stated in my last BTC post that it was possible BTC got a bounce to $40K, which is the exact level it hit. For anyone new to crypto, today was a perfect example of how particular news can greatly affect markets.
*****IMPORTANT NOTE*****
- Keep in mind the rally today was based off the news and was not a "technical" bounce. If BTC made this move without any news today I would be slightly more bullish on BTC for the short term. But the way I see it, the move today was a result of the news and made BTC look more Bullish than it is.
So does the rally today mean that BTC is Bullish?!
- No... BTC is still overall Bearish. Keep in mind that even during Bear cycles, the market can have melt your face off rallies.
- One of the common mistakes new traders make is they will see BTC have a rally like today and think "wow BTC must've reversed from bearish to bullish!"
How do we know BTC is still Bearish?
- If you take a look at my chart, on the far right I've split the chart in two and labeled "Micro Bearish & Micro Bullish" These are the dividing levels.
- Anything below $43K is Bearish, anything above $43K is Micro Bullish giving BTC the chance to retest the Bear Flag resistance at $50K.
- BTC is still Bearish for several reasons..
1) Has not confirmed above the "Falling Wedge Resistance"
2) Has not confirmed above the yellow "Ascending Trend Line"
3) Has not broken the local high at $43K
4) For nearly a month BTC has been creating lower lows and higher lows
5) BTC is hovering around the $37.5K support and failing to break any meaningful resistance
- As you can see BTC is doing nothing but printing Bearish signals and has yet to give us any meaningful Bullish signals in the past 2 weeks.
**An important thing to keep in mind is that any "Bullish" move that BTC makes up to $43K is considered a corrective move and is not a reversal. BTC could rally straight up to $43K, but not break it and would still be considered Bearish.
What's the next move for BTC?
- My prior analysis still stands so feel free to check that out for more details on where BTC is headed in the longer term.
- It's possible BTC could have a small continuation rally to $40.4K to the "Ascending trend line". It would need to confirm above before it could try at $43K. However I think that any price action above $41K is a low probability
- BTC is still in the process of breaking down from the Macro Bear Flag, BTC should continue this process over the comings days / weeks.
- Keep in mind BTC could hover and consolidate at this level for several days or more before making the next move down.
- The next target price of $34.4K is still valid and am expecting BTC to hit the level in the short term.
How am I trading this?
- Personally, I took several trades over the past few days. I will try and make a post tomorrow regarding my trades and any potential trade setups.
- I entered a BTC short today at $40K and will continue to add to the position if price moves up. The target for this short is the $34.4K level.
- I would be cautious taking any longs considering most cryptos rallied 15%- 25%.
Thanks everyone, remember you can alway message me or comment if you have any questions. Best of luck trading!


GBPUSD - LONG SEPUP OPPORTUNITYPrice is at 61.8% of the daily chart, If unable to break, along with the break of the trendline

How to Find Trade Entries - Identifying Formations Hello Traders, here is an educational post about identifying formations and finding trade entries.
***Sorry the chart is so sloppy, I originally did this on the 5m TF but TV would only let me post on the 15mTF so it squished the chart.
- First I want to say thank you to everyone for the support, I'm happy to hear that people are learning from the material I post!
- I decided to just post this tonight over a chart analysis due to the fact that I'm just waiting to see how the FOMC meeting goes tomorrow. The market will most likely be very volatile tomorrow so in the evening we will have a better idea of which direction the market is headed.
***Tomorrow is a very important day for the market's, keep an eye out for my post on what the meeting results mean for BTC.
On to the topic!
- I chose this chart location for a very specific reason... this is from when BTC bottomed the other day at $37.4K. The reason is to show you that even in a volatile market and when an asset is on the verge of breaking down, you can still take trades when the correct signals are given.
- When BTC dumped I was sitting at the computer watching it occur, I was waiting for BTC to give me a signal that it was at it's bottom.
Signal 1) It hit major support
Signal 2) BTC created a flag pattern and Bullish consolidation
Once the formation broke to the upside I knew it was likely Bullish price action would most likely continue and I was on the lookout for long entries.
- As you can see in just one day alone, 3 Bullish formations occurred each playing out their technical targets.
- I took each of the trades entering after the re-test for the first 2 and after the neckline was broken on the double bottom.
***It really is amazing how if you're patient the chart will present these trade setups to you, all you have to do is sit back and wait for the entry.
- Another point to make is you can see how after BTC bottomed, it had to create it's own local support. It did this using swing high's and lows then retraced multiple times to confirm.
That's it for tonight, thanks everyone and best of luck trading!

$BTC - hopefully seeing a bullish breakout!sheeeesh bitcoin has been following my ideas exactly these days! :)
I want to expose myself, so, I personally bought BTC today @ 38.5 K
I thnk this might the end of the downtrend and we will see a bullish breakout from the falling wedge that has been forming since the first weeks of april
if you want to take a closer look to my position, SL = 37.3K and TP=44000 ,but these levels might be changed in the future depending on how future price action goes
what do you think about this? good idea or not?
not financial advice of course, thus I am not suggesting to buy BTC

NZDUSD Long Term BuysThis isn't a shot in the dark. Fundamental and technical analysis applied. We could potentially get taken out from more manipulation however I feel the velocity building in price action here, hopefully NY adds to it

Bitcoin Bear Flag Breakdown Begins - Hello Traders, here is my analysis for BTCUSD.
First I want to say... I have been waiting for this moment for several months now. When the Bear Flag started forming it was quite clear that a MASSIVE breakdown was imminent. BTC is now at that point. I know a lot of people are still in denial and think "there is no way it's even possible for BTC to go back to $20K!" But I assure you it is possible. Back in the early 2000's during the Dot Com Bubble Amazon went from $112 a share to $6 in a short amount of time. So yes it's absolutely possible... Look at Amazon now though, it's trading around $2,500 a share just to put things into perspective. On to the analysis.
This chart is really quite amazing to look at, you can clearly see that the breakdown has begun and as a matter of fact is VERY close to fully breaking. When you zoom out you can see how mature this Bear Flag pattern really is. If it was an immature pattern the odds of breakdown would be much lower, but with a mature pattern like this the probabilities of a breakdown are far greater.
***FOMC meeting is on Wednesday. This will have a huge impact on the markets. This analysis is strictly TA based. See my note at the bottom about this meeting for more info regarding the affect it will have.
Here are some Key points that show the breakdown has begun.
1) For the past few weeks BTC has been trending down for the majority of the time.
2) Over the past 2 weeks BTC has struggled to break above any meaningful resistance and has slowly been trending down with only small bounces at key support levels.
3) Over the past 11 days BTC has been unable to confirm above the yellow trend line which is Major Resistance.
4) 6 days ago when BTC dropped just below $38K, it touched the trend line then quickly bounced. At no point did it break below.
5) 3 days ago BTC closed below the lower trend line of the Bear Flag for the first time since January.
- As you can see for the past several weeks BTC has been in the process of breaking down.
- The past 10 days or so is where the major breakdown signals started presenting.
- It's really quite simple as to what you want to look for to confirm the breakdown... Once BTC confirms below (a full candle closes below) then the pattern is broken and the path to the technical target will begin.
So what's next for BTC?
- In the short term I still think it's possible BTC gets a small bounce off the current levels at most up to the yellow trend line just over $40K.
- If the yellow trend line is confirmed above, then that is a bullish signal and we will re assess
- Beyond that I think it's quite clear what will happen, BTC will confirm below the trend line and BTC will face Major Bearish price action over the coming months.
- The next key support level for BTC is at $34.4K
- Then at $32.8K
- BTC will most likely bounce at $34.8K but it depends how quickly it hits that level.
- $32.8K won't be as big of a bounce.
- Eventually I believe BTC will hit $20K or lower. Of course I will update everyone over the coming days and will let you know of any changes.
****FOMC Meeting Wednesday 2pm
- This meeting is about raising interest rates. The rumor is that they're planning on raising 75 basis points. I think if they do this the market will dump out of fear of recession. However the FED could decide to only raise rates 50 basis points which will be a relief to the markets and a rally could ensue. So Wednesday is a very big day for investors, either the market will dump or pump. Make sure you are ready on Wednesday and if you have any open positions be prepared to act accordingly to the news.
Please like if you found this helpful and remember you can always message me with any questions.
Thanks everyone and best of luck trading!

ChainLink Analysis - Is A Breakdown To $5 Imminent?Hello Trader, here is my analysis for LINKUSD.
Link has potential, it's not nearly as bad as FTM or ADA which we looked at recently. In fact this year I've taken a few long positions at Major Support levels, knowing that a bounce was likely. The problem is I am extremely Bearish on Bitcoin at the moment and as we know Alts will follow. Despite Bearish price action, Rip your face off rallies still occur during a bear cycle. This is when we look to enter long positions!
Before I even start... LINK will continue to have Bearish price action until it breaks out of the falling wedge. You'll most likely know when LINK has hit its bottom because it will break the formation to the upside signaling a reversal.
How do we predict where the bounces will occur?
- Typically bounces occur at Key/Major support levels.
- There are other factors that come into play such as time counts, how quickly it hits the level, any consolidation before hitting the level, etc.
- But just to keep it simple, we want to look for key support levels to take longs.
But if Alts follow BTC and we enter a position in LINK at a key support level, how do we know it will bounce? Can't BTC bring it down?
- The key here is to try and align the major Support and Resistance levels of whatever Alt you're trading with BTC.
- So if it looks like BTC is about to hit a key support level and so is LINK, then chances are they will both bounce since they hit the levels at the same time.
- On the reverse, if BTC is about to hit a major level but LINK is not, BTC can bounce but LINK might not.
***Perfect example is right now LINK is not at a key support level, while Alts like Avax and Matic are. Both go great bounces along with BTC while LINK not so much.
So where is LINK headed?
- As you can clearly see LINK has been trending down in a falling wedge formation.
- Yes this is technically Bullish, but LINK could continue to trade between it for months before breaking out.
- Until Link breaks out of the formation, it will continue to act as support & Resistance.
- You could always short at the top and long at the bottom of the formation.
- The key support levels are listed on the chart, as long as BTC keeps trending down, LINK will follow.
- Each time a Key Support level is broken, that confirms downside continuation and the target is the next support level.
- $7.12 is a Major support level, there is a high probability LINK gets a bounce there especially if it comes down straight into it over the coming month without much consolidation.
How low can LINK go?
- IMO I believe LINK will hit $5 in the coming months, it's even possible it goes lower. But for now I think $5 will be the low.
- Link will gets bounces along the way but until it breaks the formation to the upside, I personally would not enter a long term position.
What about the short term?
- The next target for LINK is $10, it may get a bounce being as it's a psychological level. But I think when it retraces it will break quite easy and continue lower.
- Then $7.12 where I would be expecting a larger size bounce, especially since it's been trending down for nearly a month.
Thanks everyone and best of luck trading!

BTC - How long can we go?BTCUSD - Had a nice bearish set up. However, at key trendline area. Next area of interest is between 37,800 - 37,100
TJ

FTM Analysis - How Low Can It Go?Hello Traders!
This analysis for FTM was done at the request of one of our members. I was actually quite Bullish on this crypto last year long before the leader left and chaos ensued.
So where is price headed?
- To be brutally honest... This is one of the worst charts that I've seen in a while. I can't find a single Bullish indicator anywhere on the chart. I actually think FTM could be trading around 0.20 or less by the end of the year and I'm serious about this.
- In the short term I would like to say I think it could bounce considering it's at a support level and has come into this level quick (indicator of potential bounce) but this crypto has underperformed so much that even when a bounce setup occurs it blast through the level and continues lower.
***I really don't have much to say regarding this crypto, if it was me I wouldn't put a single penny into FTM. It's done nothing but trade down with the exception of a couple bounces but aside from that this has got to be one of the worst performing coins in Cryptoland.
- For anyone holding FTM, I'm not trying to be abrasive, I'm just giving my honest opinion.
***I suppose you could short FTM but I would caution against shorting period unless you are experienced.
***Let me finish by saying this...
- If you are HODL'er of FTM, I would think very carefully about your plans for this crypto. The probabilities of you continuing to lose money with FTM are VERY high especially considering BTC is projected to hit $20K in the coming months.
- Personally I learned the hard way and had liquidated my account on several occasions when I first started trading. I left my money in cryptos like ADA, holding on because my emotions told me to. There was no logical reason to it, the charts said otherwise but I was attached to it and couldn't bare taking that size of a hit. In the end I lost all the money invested and learned the lesson of what happens when you allow your emotions to dictate your trading decisions.
- Lastly, I don't know if anyone reading is in this particular situation, but either way it's a good lesson to be learned. Charts like FTM will undue months if not years of work saving money to invest.
That's all, thank you everyone and best of luck trading!

Bitcoin Update - Can BTC Hold or Will it Fold?Hello Traders!
I don't doubt that a lot of you are stressed out right now wondering what the heck is Bitcoin going to do!?
Well here is a quick analysis of where BTC currently stands and the possibly scenario's that could play out.
- If you saw my BTC analysis yesterday you will see that this is essentially an update of that chart. The major difference being that BTC dropped down to support at $37.4K today.
- That was expected though so as of right now the predicted path is playing out.
So what's next?
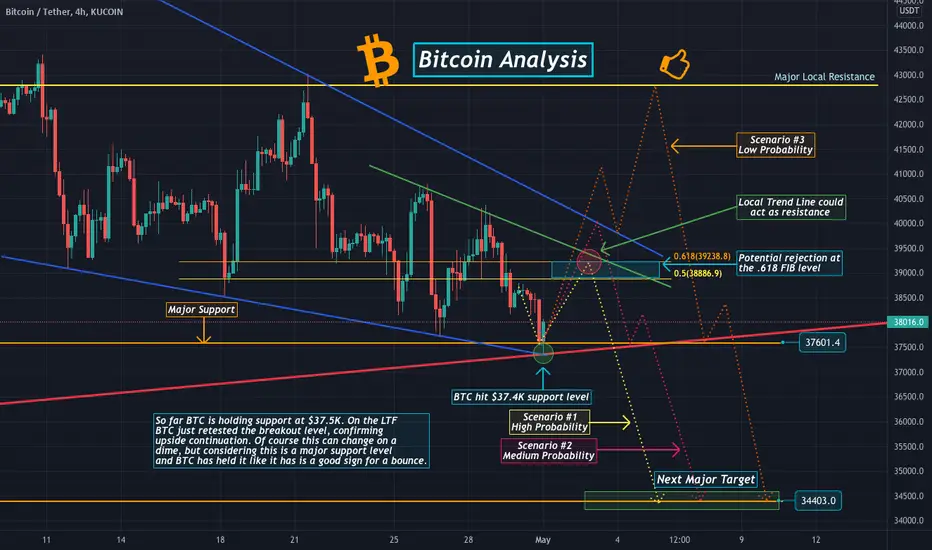
- At the moment BTC is holding support and putting in Bullish price action on the low time frames (5 min).
- This tells me that the probabilities dictate BTC should bounce.
**So where will BTC bounce to?
- IMO there are 2 high probability scenario's and 1 low probability scenario.
#1) (Highest Probability) - BTC hits the .618 FIB level at $39.2K (which is also resistance and almost intersects with the descending trend line from the prior 2 local highs) and gets rejected at this level. If this happens more than likely it will be a relatively quick descent to $34K from there.
#2) (Medium Probability) - BTC hits the upper descending trend line from the falling wedge and gets rejected. If this happens it could potentially get one more small bounce at the $37.4K support before breaking dow to $34K.
#3) (Low Probability) A lot of people have asked me about this scenario... Since a Falling Wedge formation is Bullish wouldn't it make sense that BTC should get a pump from this level and break through the formation to the upside right? Not necessarily... There are several factors that I have taken into consideration, but primarily that there are several very Bearish indicators that essentially neglect the Bullish formation. I will make a separate post explaining this in detail tomorrow. Even if this scenario played out, I think the highest that price could go would be $43K before getting rejected, then head to $34K.
Final Thoughts
- Personally I entered a few trades tonight when BTC hit the $37.4K level. I have been projecting that BTC should bounce from this level one last time. I think there is a very high probability that this will be a smaller bounce and BTC will be headed to $34K possibly at some point next week. If you entered a trade I would take profits early just to be safe. I would rather take profits early than wait for the last possible second and risk price reversing and miss out on profits all together.
If you guys have any questions or requests just let me know, I will get to any chart requests as quick as I can.
Thanks everyone and best of luck trading!
Bitcoin Analysis - Is a Breakdown to $34K Imminent?Hello Traders!
*** Bitcoin is at a pivotal moment right now. The $37K ascending trend line is the bottom support of the macro bear flag that has been formed since January. This is a MASSIVE pattern and if it breaks... well I think you will be shocked in the coming months how low BTC actually goes. I am predicting $20K or lower and I am very confident in this.
*** This is the time to really focus on the technicals and play it smart, safe and strategic.
On to the Analysis...
- Bitcoin looks VERY Bearish
- To be honest I think it's only a matter days / week before BTC breaks down to the next support level at $34K.
- Looking over the charts, I can't find anything that gives me any Bullish signals.
Next target for BTC?
- The next target for BTC is the Major Support at $34.4K.
- It's possibly that BTC gets one more small bounce before breaking the $37K support level, but once that level is broken I think it will trend down pretty quick to $34K.
** Buyers are losing enthusiasm in BTC right now, we can see that in the technicals.
** I would be VERY cautious opening any long positions right now unless you are an experienced trader.
- Once BTC hits $34K it will most likely bounce, theres a possibility that I will open a long trade and be in and out quickly. I did the same thing the other day when BTC hit $37K. I entered at $38K and exited at $40K.
That's pretty much it, just keep a close eye on the $37K support level, if you are in any long positions I would exit if that level breaks.
- If you want to short I would wait and see if BTC gets another bounce first (which I might do) to around $40K, then you could enter to minimize risk, also look out for the formation of a bear flag on the high time frames, I wouldn't be surprised if one formed and that would be an excellent pattern to play for a short.
*** Once again be very cautious with longs and don't listen to these moon boy youtubers especially if they dont show any technical analysis!
Thanks Everyone and best of luck trading!
