EUR/AUD: Short Setup Forming—Is the Downside Just Beginning?EUR/AUD is flashing the early signs of a new short trading opportunity, with the latest chart pointing toward a fresh move lower as the corrective phase may be wrapping up.
What the Current Structure Shows (Primary Scenario)
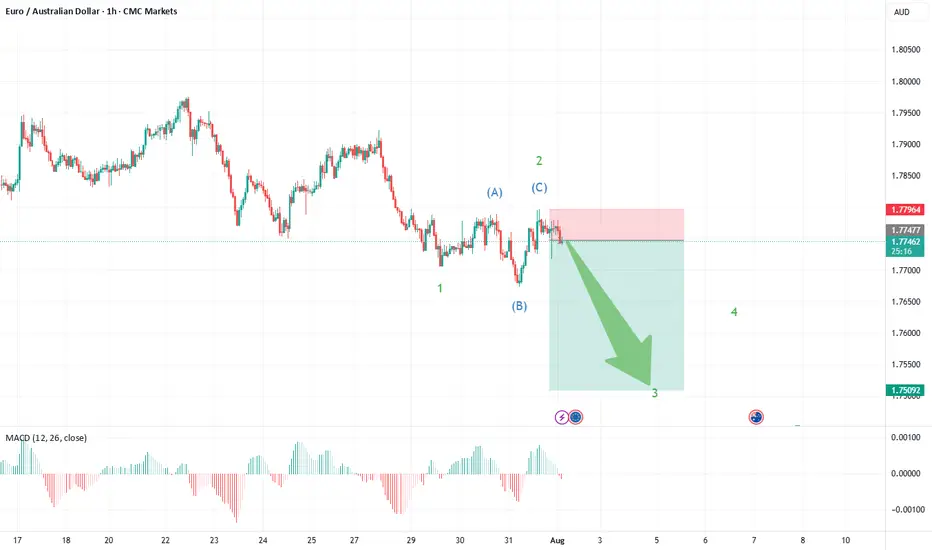
Corrective Pattern Complete: The strong advance off the May 14th, 2025 lows at 1.7247 unfolded as a classic double zigzag (WXY), culminating at recent highs. Price action has since reversed and formed an initial impulse down—clear evidence that the correction may be over.
Wave 1 Down, Expanded Flat for Wave 2: The chart now displays a completed wave 1 on the downside, followed by an expanded flat for wave 2—where price retraced upward but failed to break the previous peak, a sign of fading bullish momentum.
The recent structure shows a sharp, impulsive move down (wave 1), fitting Elliott Wave expectations for a new trend immediately after a complex correction.
The expanded flat for wave 2—where the B wave exceeded the start of A and C pushed higher—typically heralds a strong, extended wave 3. This supports a bearish outlook from current levels.
Tradesignal
Bitcoin to $115k or pullback to $91kGood Evening Traders,
First I would like to say, congratulations to all of you who have been in the game for the last 3 bitcoin halving cycles. Through all of the "You buy fake internet money" comments or the never ending explaining of the Tokenomics of different cryptocurrencies, I have to say KUDOS to all of us who saw the vision, stuck to your guns and intricately added to your bags over the years! We are finally here on the cusp of full regulation and a final hush of the naysayers!
Ok, now down to brass tax! On the chart I have Highlighted a few important details. Something I did not point out on the chart is the massive printing of USDT that has been happening over the past few days. It seems to me that we are on the cusp of a massive influx of capital into the alt coin markets. But, for now lets focus on Bitcoin! As stated, you can see multiple points that I have highlighted... These being mostly bearish for the big dog of market cap and the grandfather coins of crypto Bitcoin. The first few things to notice is the bearish divergence on the MACD histogram, the bearish down cross of the MACD line over the signal line on the MACD indicator. You can also note the overbought area on the RSI right above that. In addition to this we do have some gaps on CME:BTC1! Which generally get filled sooner than later on most charts.
With this in mind, it is possible that we could have some good news amongst the movers and shakers down at the Bitcoin conference this week. Yet, we could get some sell the news type events that could ease the price downward to fill in these gaps that we have below. In my experience at the beginning of each alt coin season Bitcoin generally leads the rally and can trade sideways to down during the upward movement of the majority of the altcoin market.
My personal thoughts on the chart currently is shown at the top of the chart. if we close the daily candle underneath the hyperlocal resistance shown on the red line at the top of the chart, then we will most likely start pulling back to fill the first gap that is shown on the chart below in yellow. Albeit, the MACD is a lagging indicator, we can gain a lot of insight using it and my favorite sign on the MACD is using the histogram to point out bearish and bullish divergences. This shows a lack in momentum in the current trend that is shown through the price action of the assets trend. Especially, after a straight run up like we have just experienced as of late.
In conclusion, you can make the assumption that if we close the current day under the red line above it is very possible that we begin what could turn out to be an ABC correction leading us down to fill in the gaps on BTC1! to the downside. If we hold the first support, BTC may show us a little more juice potentially reaching for just under $115k. This in my opinion would likely be a bull trap for the time being. Summers are not the best when it comes to crypto growth and it always seems like we are waiting for the Ground Hog to see its shadow to find out if we are to the moon or back to McDonalds with our friends!
I hope that this analysis has helped you gain some insight in your research. I have added supports to the chart to show you where we may turn around and start heading back into price discovery.
Stay Profitable,
Savvy

Fil has BottomedTraders,
Like it or love it, this is an unpopular opinion in a sketchy time in the market. Regardless, our team thinks we have bottomed for alt, its discount season! You name it and it is at the bottom!!
We hope you enjoy a little hopium in these uncertain times!!
Stay Profitable,
Savvy!

TrumpHello Traders,
Today we are posting a trade we see that we know you are all eyeing. BINANCE:TRUMPUSDT
This is a trade we saw in our weekly trade hunt. If you are not familiar in TA and have a hard time understanding the chart feel free to reach out to us and we will happily help you understand.
Stay profitable,
Savvy

CADCHF; Heikin Ashi Trade IdeaOANDA:CADCHF
In this video, I’ll be sharing my analysis of CADCHF, using my unique Heikin Ashi strategy. I’ll walk you through the reasoning behind my trade setup and highlight key areas where I’m anticipating potential opportunities.
I’m always happy to receive any feedback.
Like, share and comment! ❤️
Thank you for watching my videos! 🙏

THE Trying To Bottom - Knife Catch MartyBoots here , I have been trading for 17 years and sharing my thoughts on ETH here.
THE is trying to bottom and bounce in the near term
This is a risky knife catch so be careful
Interesting situation and potential trade

Brett 40x (FREE VIP SPOT SIGNAL)Traders,
Here is a free signal from the VIP. Brett is a MEME coin listed on base coinbase's local blockchain. This will be a coin that we believe does well this run. Feel free to reach out for more trades like this.
Stay Profitable My friends,
Savvy

Sugar LongInto higher timeframe support on weekly chart.
The take profit is the moving average so will come lower over time.
Because trade is taken off a daily chart you will have to trail stop accordingly.

Doge Crypto Kinfolk Free Private trade signalGood Morning Folks!
We have updated our private trade layouts to help traders have a more profitable outcome on trades and an easier understanding of the trading plan using the tools that Tradingview provides us. It is important that you become educated on using these tools. We highly suggest upgrading your Tradingview account to at very minimum the Plus account, yet we always suggest our students get the Premium account due to the powerful tools and multitude of alerts you need to be a full time trader. We hope you enjoy the new layout and would love your feedback in the comments.
DOGE SIGNAL
Average into trade within "Entry Zone". Be sure to set your stop loss appropriately. The lower the average the better as you can lower the stop loss accordingly to your entry. Take 15% Profits at first 🎯or enough to cover your stop for a free trade moving forward. Complete the rest of the targets with your own personal preference on % to take profits. If the price action and indicators show weakness at Trend 🎯 Range take most profits with in the range and we will possibly re-enter some on pullback.
Entry: .24547-.25227
Stop loss listed on right of chart: Red
Targets listed on right of chart: Green
Trend 🎯Range: Green on trade box
Leverage: 20x-30x
Allocation: 3%-5%
Feel free to check out our previous layout and description on our recent linked trades to compare and contrast the differences listed below in the links provided, message me if you have any issues seeing them. Thank you for your time and consideration. I would be happy to answer any questions if you are interested in learning more about the charts and how to read them, take the trades and/or any trading educational questions I may be able to help with.
Stay Humble Stay Profitable,
Savvy
sd
Please be advised we are not Financial Advisors and any information we provide is purely for educational purposes only. Trading is very risky especially when using leverage. Please trade wisely and do your own research.

XAUUSD - Gold Trade UpdateJust a quick update regarding gold. Yesterday we had better than expected CPI data followed by a strong sell off with Gold for the precious metal to then later regain all of those loses.
Will gold continue to push higher towards 3000 an ounce? Or.. will we start to see some topping action and a bit of a correction?
For now, I'm anticipating some topping action and a pullback before I would consider going long. With that said, I'm waiting for some bearish or pullback confirmations first as I explained in the video.
That's it - That's all
Trade Safe

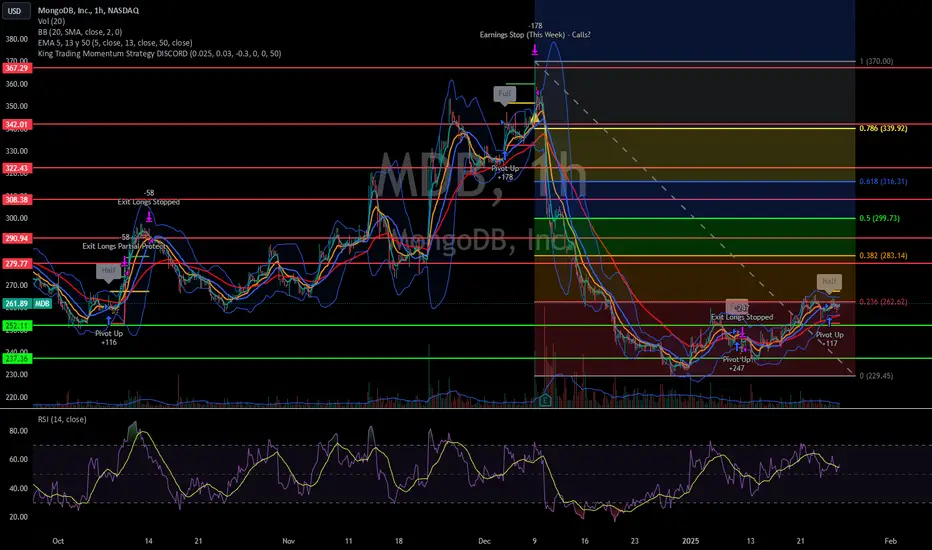
Time to Enter MDB Again?On Thursday afternoon, the King Trading Momentum Strategy signaled alongside eleven other alerts that day, followed by five more on Friday. This activity doesn’t exactly scream “bearish” to me, but the market has a way of keeping you on your toes! With markets once again approaching all-time highs, I’ve been treading cautiously. My positions have been limited to just a few, with low allocation sizes in TNA, ADBE, PYPL, and XYZ.
When I looked at MongoDB (MDB), I found myself wondering why it was hammered after posting a double beat on earnings and providing decent guidance. It turns out the recent drop was primarily driven by the announcement that Michael Gordon, MongoDB's Chief Operating Officer and Chief Financial Officer, will be stepping down on January 31, 2025. Is this reaction overblown? After all, the company delivered a strong earnings report.
That said, MDB seems to have planted its bull flag in the ground. Even if this news creates headwinds, there’s a possibility it could retrace back to the 38% Fibonacci level. Even if the broader market eventually pulls MDB lower, this setup suggests an 8% potential upside, and I’ve set an initial take profit at 5% with a 3% stop loss. If this can hit the take profit, I will sell half to protect the trade and then set a trailing stop loss of 1.5% on the remainder, trying to sell of much of it as possible on the way up!
Unless Monday brings a complete washout due to fears surrounding the Fed meeting on Wednesday or the PCE data on Friday, I’ll likely use the typical morning volatility as an opportunity to enter this trade. Let’s see how this one plays out!
The King Trading Momentum Strategy combines the 5 EMA crossing above the 13 EMA, RSI strength, favorable momentum as measured by ADX plus evaluating recent volume changes and even something that measures breakout momentum called Beta for this one! MDB and over 100 equities are built into this script with optimal backtest take profits and stop losses and can be toggled on by simply checking a box (default they are turned off).
POLYX Buy Signal Given!Trading Fam,
It’s been a bit slow recently so I thought I’d throw out a free alert just to keep you all in the game. We’re getting close to another run here soon. I know, it feels like I have been saying this for weeks. I have. Trading often involves extreme patience. In our case above, POLYX has given us not one but two green dots from my Dots and Blocks indicator inside the liquidity block. This gives me a special confidence that this coin is going to run soon. I would target that double-top at .435, take some off, and let the rest ride.
Best of luck. Hey, if you do enter this trade and make some cash, be sure to come back here and let me know in the comments. I love it when my followers find profits.
✌️Stew

WILL GOLD DUMP? PROPER ANALYSISHello everyone!
Gold is moving towards 2712 We have trade line on 2712 It will first that it then fall towards 2691 our last demand and before it will first swipe 2704
SO we take entry from 2712
TP1 will be 2704
TP2 will be 2691
Sl 2715

SAND/USDT Triangle Breakout: A Buying OpportunityLet me share my latest trade setup for SAND/USDT. From my perspective, it looks like altcoins may have finally bottomed out and are gearing up for potential gains of 100% or more. That said, I’m keeping things conservative with this setup, targeting a 17% profit from my entry point.
What stands out in this chart is the clear breakout above the triangle and the bounce off the uptrend line, both of which are strong bullish signals. However, it’s worth noting that some stop-loss hunting could push the price slightly lower before the next move.
Overall, with a solid risk-reward ratio, this setup offers a promising opportunity for those looking to capitalize on the potential trend continuation.

PNUT Double Bottom Signal
The $PNUT Peanut the Squirrel token did a whooping 70% correction
It even broke GP. Thanks to BTC it had a role to play in this too. But huge support held PNUT at $59 - $0.61 .
A clear and obvious Double Bottom has appeared in the chart . This is a bullish signal , which means PNUT is ready to go back up. I am holding from $0.61. The blue-line support-turned-resistance line needs to be broken.
See target and resistance levels expected on the chart. Goodluck. BTC is again crucial for this momentum to continue .
Correct me if i'm wrong. Like if you disagree. Comment if you agree 👍

Bitcoin Bullish Break: Buying Opportunity After Resistance🌀 Analysis:
Bitcoin has completed its abc correction and formed an inverse head and shoulders pattern. The rapid price recovery after the recent dump indicates strong buying interest and the potential for a continuation of the bullish trend.
Currently, Bitcoin may experience a small correction or directly break the key resistance at $102,200. If this level is broken, which aligns with the neckline of the inverse head and shoulders, it will signal the start of a new upward wave, potentially driving the price toward higher targets.
🎯 Trade Setup:
Trade Type: Long (Buy)
Entry: $102,200
Target: $112,000
Stop Loss: $98,500
⚡ Notes:
Wait for confirmation of the resistance break before entering. Apply proper risk management and adjust trade size accordingly.

DJT a winner in life. A winner in the market? Hello Traders,
Quite obvious large wedge pattern emerging here, with price action sitting on a solid support. If it breaks support below shown on the chart, we will more likely than not, come down between $10 & $11. This would have course be our best entry point. Could it happen? OF COURSE, this is why we do TA! It is to assure we have a plan for all possibilities and minimize risk along the way!
That being said, where price action is currently, we could very likely start next week with a green candle and continue it through mid week and if so my plan is to start buying some contracts If the week closes green. Possibly a few if we get two green closes M & T. it’s very likely to break out in the next month or two. Maybe within another 1-2 weeks. If we see a solid green candle close next week.
In addition, look at that massive sell volume that couldn’t even break support. My money is on the bounce and then breakout here where we stand! Best of luck and always follow the path of less resistance and have a plan for a diverging outcome! This is law if you want to be consistently profitable!
Stay Profitable,
Savvys

AXS 176% spot or low leverage tradeTraders,
Sorry for the lack of explanation here. I’m out for a birthday shindig but, wanted to show some love! Just saw a decent trade with some recent positive fundamentals.
Please see chart for details.
Always profitable,
Savvy

Brent Crude Oil Analysis==>> Fundamental + TechnicalBrent Crude Oil ( FX_IDC:USDBRO ) began to rise from the Heavy Support zone($71.30-$64.80) after Iran attacked Israel . ( It seemed that before the attack of Iran, Brent oil intended to fall and correction further ).
Today's fundamental analysis of Brent crude oil prices is influenced by several key factors:
Geopolitical Tensions : The ongoing conflict in the Middle East, especially between Iran and Israel, has raised concerns about potential disruptions to oil production and exports. Any attacks on Iranian oil infrastructure, particularly in the Strait of Hormuz, a crucial passage for global oil exports, could reduce supply and drive prices higher. These concerns have contributed to the recent rise in Brent prices, pushing it above $80 per barrel.
Global Demand : China's recent large-scale economic stimulus aimed at boosting recovery has increased optimism for higher oil demand. As the world's largest oil consumer, any rise in demand from China directly influences global oil prices.
OPEC+ Supply Capacity : Although OPEC+ still has significant spare production capacity, there are worries that a severe crisis in the region could overwhelm this capacity, preventing the group from compensating for any sudden drop in supply.
Overall, the short-term outlook for Brent crude appears bullish, driven by geopolitical uncertainties and potential increases in demand from China. However, the market remains cautious to see if these trends will hold over time.
Now, according to the fundamental analysis of Brent Crude Oi, let's see which area is suitable for buying Brent Crude Oi .
Brent Crude Oil is moving near the Support zone and the Support line .
Brent Crude Oil's movement structure is corrective , and we should expect it to move upwards again .
I expect Brent Crude Oil to start rising again from or near the Support zone and at least to $81(Yearly Pivot Point) and then attack the Resistance lines .
Brent Crude Oil Analyze (USDBRO), Daily time frame⏰.
🔔 Be sure to follow the updated ideas. 🔔
Do not forget to put Stop loss for your positions (For every position you want to open).
Please follow your strategy and updates; this is just my Idea, and I will gladly see your ideas in this post.
Please do not forget the ✅' like '✅ button 🙏😊 & Share it with your friends; thanks, and Trade safe.

Bitcoin Analysis Weekly Outlook and Breakout SetupIn this video, I analyze Bitcoin's intermediate bullish weekly close and the next steps we're looking for. I discuss the importance of price taking out sell-side liquidity and trading into the weekly Fair Value Gap (FVG), setting us up for potential long opportunities.
The goal is to see Bitcoin break out of the current consolidation phase and continue its upward momentum. Tune in to get the key levels and insights for the next move!

XAUUSD M30 ANALYSIS | LOOKING FOR SELL MEAL!Hi, everyone! I hope you’re all doing great and geared up for today’s trading prospects. I’m eager to share my insights on XAUUSD and explore a potential setup that I believe could be quite beneficial for us.
Looking at the current market conditions, it’s evident that XAUUSD has recently tapped into all buy-side liquidity. This movement hints at a possible change in market sentiment and suggests the emergence of bearish momentum. With that in mind, I’m contemplating a short position on XAUUSD, targeting an entry point at 2600.
Here’s my thorough analysis:
Market Overview: The recent price action indicates that buyers may have reached their limit. With liquidity being exhausted, we could see sellers take charge, driving prices down. Historical trends and current patterns align with this bearish perspective, making it a prime opportunity to leverage potential declines.
Target Levels: For this trade, I’ve set my first target at 2685, with aspirations for further movement down to around 2675. These levels have previously demonstrated significant support, and I believe they will be pivotal during this trading session.
Risk Management: To safeguard our investment, I’ll be placing a stop loss at 2608. This provides a comfortable 80-pip cushion, allowing for some market fluctuations while protecting our capital. It’s crucial to implement a solid risk management strategy, especially in the dynamic environment of XAUUSD.
Trade Execution: I encourage each of you to evaluate this setup according to your own strategies and risk tolerance. Ensure that your trade aligns with your overall trading plan. If you’re considering this trade, I recommend staying alert for confirmation signals before making your move.
Community Interaction: I want to take a moment to thank you all for the amazing support and engagement you’ve shown towards my ideas. Your feedback inspires me and enhances our community. If you have insights, alternative viewpoints, or questions about this setup—or anything else—please share in the comments! I’m excited to discuss and learn from all of you.
Looking Ahead: As we navigate today’s trading session, let’s stay focused and flexible. Markets can shift quickly, and being prepared to adjust our strategies is essential for success. Remember, trading isn’t just about profits; it’s also about continuous learning and growth as traders.
Thank you all once again for being such a fantastic community! Together, let’s seize today’s trading opportunities. Here’s to a successful day ahead—let’s go for those profits! 🚀💰✨
Happy trading, everyone!

BTC Potential 1.5 R Trade1. Market Structure:
- MSS (Market Structure Shift): The chart indicates a shift in market structure (MSS) at the marked point. This typically indicates a potential change in the market's direction, possibly from bearish to bullish or vice versa.
2. Liquidity Zones:
- Liquidity: There is a horizontal line labeled "Liquidity" at a higher price level. This suggests that the trader is eyeing a potential price movement towards this area where liquidity might be resting, which could be targeted by large market players.
- Ext. Liquidity (External Liquidity): The area at the bottom (marked as "Ext. Liquidity") could represent an area of interest where sell-side liquidity might be present. This is possibly a support zone where the price may reverse after liquidity is taken.
3. Entry Zone:
- The chart highlights a gray shaded area (just above the external liquidity) as an "Entry" zone. This is where the trader plans to enter a long position, expecting the price to rise from this support level.
4. Target Zone:
- Take Profit (TP) Level: The target zone is marked with a blue rectangle, stretching to the liquidity level. This area indicates where the trader expects to exit the trade, anticipating that the price will reach this higher level of liquidity.
5. Risk-Reward Consideration:
- The trade setup suggests a favorable risk-to-reward ratio, as the entry is near a support level with the expectation of a significant price movement toward the upper liquidity area.
6. Time Frame and Context:
- The 4-hour time frame suggests this is a medium-term trade, potentially taking a few days to play out. The context of the larger downtrend (visible on the left side of the chart) implies that the trader might be looking for a corrective move upward or a reversal after a significant downtrend.

Zcash Eyes $80-$100 as Bullish Momentum Builds!Welcome to another analysis where we take a look at Zcash!
Zcash is a well-established cryptocurrency with significant potential for future growth!
Recent market activity shows increasing volume for Zcash, including a notable volume spike that pushed its price above the previous high, indicating a potential market shift. Additionally, the 20-day moving average (MA) is approaching a bullish crossover with the 50-day MA, further suggesting a positive trend.
In my assessment, the Zcash chart is currently very promising. For those considering an entry, a strategic buying range would be between $28 and $31, aligning with the 50/20 MA levels.
Historically, Zcash reached a peak of $700 in January 2018. While that level might be ambitious in the short term, a more attainable target for intraday trades would be the $50 range, with a potential upside to $80-$100 where we see a decending trendline from 2021 and more strong ressistance.
The current setup offers a favorable risk/reward profile, with stop-loss levels recommended below the previous low, around $20-$25, depending on your risk tolerance.
Zcash's breakout coincides with BTC dominance encountering strong resistance, and the increasing strength of various altcoins. Additionally, the Russell 2000 index is nearing a breakout, showing investor appetite for smaller-cap stocks and riskier assets.
Thanks for reading and good luck with your trading!
Make sure to follow me on X for more weekly updates: @PuppyNakamoto
BINANCE:ZECUSDT COINBASE:ZECUSD KRAKEN:ZECUSD GEMINI:ZECUSD
