BITCOIN (BTC/XBT) DAILY TRADE SETUPS 2020/12/23SHORT TRADE SETUP: False breakout followed by price dump
In this scenario, we are waiting for price to break above the high of $24300 and then breakdown for us to take a short position.
Entry criteria for opening a short position:
1. Price Action: Price breaks above the high of $24300 and then rapidly falls below $24300, forming a bull trap
2. Candlestick Pattern: A breakout candlestick (candle close above resistance @$24300) followed by a breakdown candlestick (candle close below $24300), ideally breakout and breakdown candlesticks are consecutive candles, but can also have a few candles in between the two.
3. Volume: Above average volume ( volume above the average volume line) on both breakout candle and breakdown candle, ideally the breakdown candle's volume is a local high
4. MACD: MACD histogram topping out, as indicated by the histogram becoming less positive (color changing from dark green to light green)
Ideally we get all four confirmations for an entry, but sometimes we might take a trade when we have fewer confirmations. The more confirmations, the higher the win probability, though it also means you miss out on some profitable trades if you're only taking trades when we have all confirmations. It's up to your own risk appetite to decide when you feel comfortable entering. Make sure you practice proper risk management and money management.
If price breaks out above $24300 with significant force, as indicated by volume and large size of green candle, we might look to go long on a retest of the $24300 level turning from resistance to new support (S&R flip trade). We adapt to the market as market conditions change so that we've always moving with the markets and not against it.
I will be updating this trade as price enters the trade zone, and when we see confirmations for entering a trade, and will then provide stop loss and take profit targets.
MAKE SURE YOU FOLLOW ME SO THAT YOU DONT MISS TRADE SIGNALS AND CAN FOLLOW THE TRADE IN REAL TIME!
DISCLAIMER: I'M NOT A FINANCIAL ADVISOR AND THIS IS NOT FINANCIAL ADVICE, AND I WILL NOT BE RESPONSIBLE FOR YOUR WINS OR LOSSES, DYOR.
Tradesignal

ETH Potential Trade Setups 2020/12/21Daily ETH Potential Trade Setups
There are two potential trade setups that could develop and we can wait patiently to see if either setup gives us a good trade entry
Scenario 1: False Breakdown at Horizontal Support
In this first scenario, we are waiting for price to hit the horizontal support @621. We will be looking for price to close below 621 and then quickly recover above 621, creating a bear trap and a false breakdown setup. As confirmation, we want to see above average volume, especially for the candle that closes back above 621. We will also want to see MACD histogram bottoming out for us to open a long position.Should price crash below 621, be careful that markets might correct further downward and best to stay on the sidelines until markets stabilize.
Scenario 2: False Breakout at Horizontal Resistance
The second trade setup that we are waiting for is for price to go up to the horizontal resistance at 676 and for a false breakout setup. This setup is characterized by price making a higher high than 676, ideally closing beyond 676 and then followed by price closing below 676, ideally in the candle following the close above 676. As confirmation, we want to see above average volume, especially for the candle closing back below 676. We will also want to see MACD histogram topping out for us to open a short position.
Please follow for daily trading levels and potential trade setups on Bitcoin and Ethereum .

BTC Scalp ShortBTC Scalp Short
Local top with false breakout. Likely to retrace from here. Scalp short and take profits by closing portions of the short position as price falls.

ETH profitable scalping opportunity using 4H chartFrom the GreenCrypto Scalping strategy we can see that we have LONG entry signal. From the past signals and backtesting result we can see that the scalping using this strategy is accurate and profitable.
I would suggest holding long position on ETH, we can expect ETH to cross 600$ soon.
If you are interested in scaling strategy feel free to DM us.
Thanks

EURUSD RETRACE BACK - BULLS ENTER AGAIN FOR 1.2300 LEVEL EURUSD moved 1.2200 level this week, the highest in recent weeks, retraced back to 1.1900 with multiple sideways movements holding its grounds as bulls enter again the trend to target 1.2300 level. Good luck with your trades.


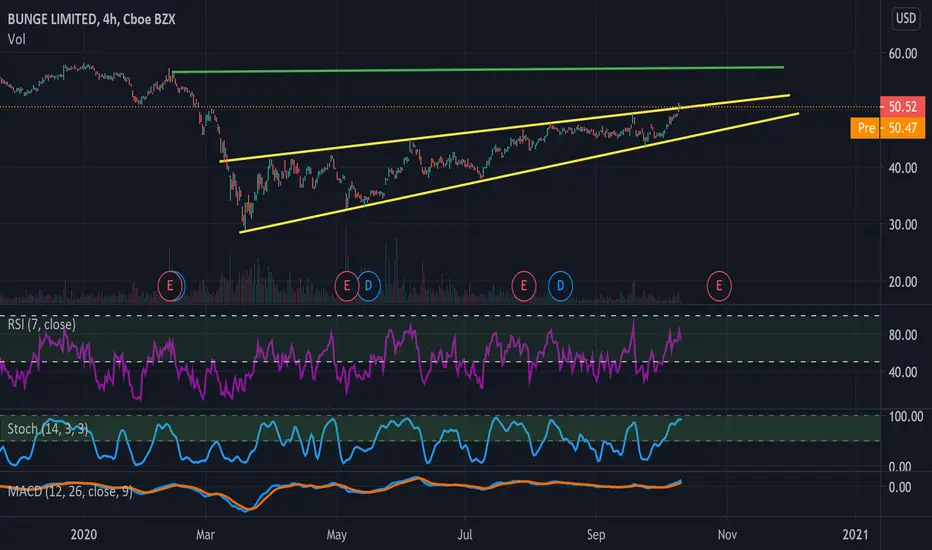
BG - 11.42% Potential Profit - Bullish PennantBullish Pennant breaking out after a 7-month uptrend.
Trying to capture the breakout right out of the gate and eventually lock profits well before the target, which I believe to be the best strategy given the period.
I am being very selective lately and I only trade when I see very limited risk, with potentially great rewards. This is why I like this setup. There is no clear technical target, this is why I will adjust stop-losses daily (and intraday) based on how the market behaves.
- Target Entry $50.59
- Target Stop Loss $50.04
- Target Exit $56.63
About me
- P/L September +49.18% | August: +232.32% | No Trades without Analysis
- Note that I tend to adjust stop losses in order to secure profits early and preserve capital. This means that the target price is going to be achieved as long as there are no strong pullbacks that trigger my new adjusted stop loss
LITECOIN LONG, Following BTCIf you need a trading broker that allows you to trade Stocks, Forex, Crypto, and Indices. I truly Recommend Crypto Rocket! (Not Allowed in The United States Sorry)
www.cryptorocket.com

EQR - 4.37% Potential Profit - Descending TriangleDescending Triangle just broke out, aiming at ATL.
Lack of resistance confirmation means that we are chasing the price. However, my Stop/Loss is very tight and we are protected in case of an unexpected bounce. This is also due to the unpredictability of the market these days.
- Target Entry $51.92
- Target Stop Loss $52.48
- Target Exit $49.60
About me
- P/L September +33.74% | August: +232.32% | Historical Win Ratio 70.59% | No Trades without Analysis
- Note that I tend to adjust stop losses in order to secure profits early and preserve capital. This means that the target price is going to be achieved as long as there are no strong pullbacks that trigger my new adjusted stop loss

MO - 4.86% Potential Profit - Ascending TriangleAscending Triangle broken out after a 6-month modest bull run. Multiple support confirmation on the 5-min chart.
Support manage to hold up quite well even during the recent meltdown.
- Target Entry $43.09
- Target Stop Loss $42.62
- Target Exit $45.02
About me
- August P/L: +203.83% | Wins 85.19% | No Trades without Analysis
- Note that I tend to adjust stop losses in order to secure profits early and preserve capital. This means that the target price is going to be achieved as long as there are no strong pullbacks that trigger my new adjusted stop loss.

BCH trade signal (9.4% gain)Drop a like if this helps you out, its free! :)
**NB this trade only becomes valid IF we close a 4H candle above 241**
Trade Idea: Bitcoin is looking rather bullish I expect BCH to follow at some point. Wait for a 4H candle close above 241 (this candle should have a lot of volume otherwise it could be a fakeout) then long the retest of now support until the
Reasons for trade:
1. Broke strong resistance zone
2. Bitcoin looking strong
Trade confidence: 8/10
RR: 4.5

3 Rising Valleys on USD Currency Index (DXY)Hidden bullish divergence after a 3 rising valley formation and coinciding decade-long critical up-sloping support on the DXY could indicate a major reversal, or alternatively major break to the downside to re-test the all time lows.

Bullish Swing Trade Alert for $MUThe TT Blackbox alerted $MU as a Bullish Swing Trade alert at 11 CST. Entered the trade at $44.13. I am looking for the bullish swing to last over the next couple of trading days.
TT Blackbox = See Below
➡️The Transparent Traders Black box is Amazingly simple! Our Black box is the first-ever to be created that specifically provides swing trading alerts.
➡️The TT Blackbox runs off multiple algorithms and uses predictive A.I. to locate the most accurate day or swing trades that it calculates to give the best chance for success.
➡️Our TT Blackbox is the first-ever to be created that specifically alerts for swing trades. It will also alert for bullish & bearish day trades.

AUDCAD MORE UPSIDE.The AUDCAD has completed its first trend changing pattern to the downside, as we know it takes a great deal of time and efforts for a trend to change. So we expect another attempt at the High before we can see the second TCP.
Right now we want to buy or do nothing in the AUDCAD.

*GBP/CAD* Pattern. +20 pip tradeBy looking at the chart pattern, we can see that it will be trying to push higher to 1.73801

EURUSD - Day trade view.Refer the chart for detailed analysis ;
EURUSD - Going for a breakout in hourly candle.
Potential upside target 1.18539
All the best cheers ....Happy trading
Traders, If you liked my analysis or have an opinion about this given levels , write in the comment section.
Thanks !!


USDCAD H4 - Long Trade SetupUSDCAD H4 - As mentioned in the above video analysis, we are looking for some confirmations from this support zone, a lower timeframe (H1) trendline break and retest would be good, some sort of double bottom with new highs set would be good too.

EURCHF Analysis For The Week AheadLast week EURCHF broke out of the indecision structure(ranging) it was in and made an uptrend market structure. What it is currently doing is a pullback.
Im looking to enter on the retest of the previous resistance to turn it into a support and look for EURCHF to make a new high on the 4hr uptrend its in now and test the high of the previous downtrend it was in previously. TP#1 at the most recent high and TP#2 at the high before that. SL will go under the higher low it forms on the retest, max pip SL of 30 pips.

CADJPY- LONGTHE PROBABLE VS THE POSSIBLE
This is how I think going into trades. There's 2 scenarios to every trade and I like to prepare for both of them to optimise on the opportunities in the market. Here I'm looking for a LONG opportunity. But a SHORT could easily be in play. I'm looking for confluences to make this trade more valid and in my favour!
-Break and Retest previous level of structure
-Bullish candle closure
- A break and close above the 40EMA
-The Retest off of a fibonacci level.
FOLLOW ME FOR MORE SET UPS AND TO KEEP UP TO DATE WITH MY TRADES!


