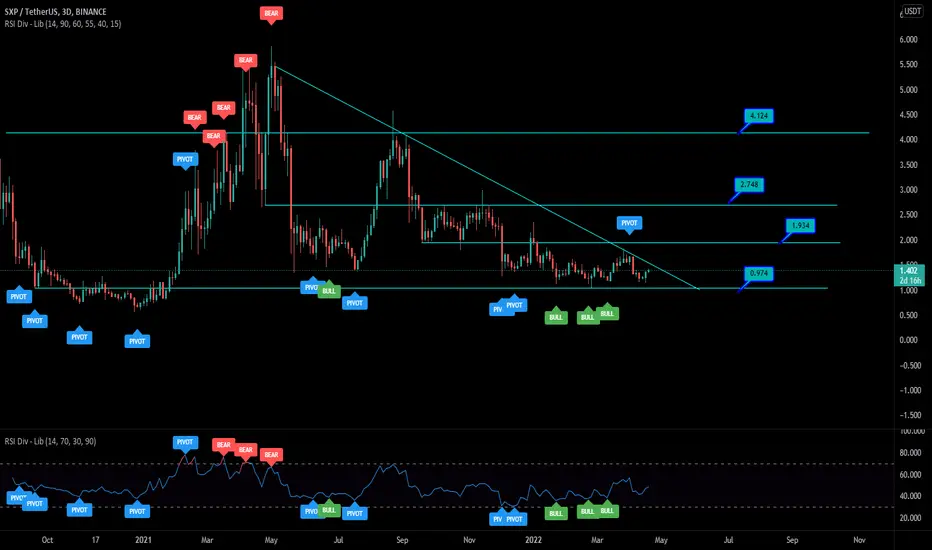
sxp looking good heresxp close to breaking the down trend here
if we break the down trend could see a nice move up
ive been accumalating at the bottom and hope u got in on my last chart and can enjoy the ride
Tradesignal
Eos 4 year accumulationeos has been in a 4 year accumulation period
could see a massive move come if we break the down trend and get out of the accumulation zone

hot looking greathot is looking good to accumulate down here
could see a big move soon if we break this down trend

dodo looking good heredodo is looking great to accumulate down here
could see a nice move soon as we are looking to be in accumulation range

GER40 Buy the 50EMA.GER40 - Intraday - We look to Buy at 14474 (stop at 14394)
Short term bias is bullish.
There is no clear indication that the upward move is coming to an end.
50 4hour EMA is at 14460.
We look to buy dips.
Our profit targets will be 14674 and 14714
Resistance: 14700 / 14800 / 14900
Support: 14600 / 14500 / 14400

EURCHF Sell a break setup.EURCHF - Intraday - We look to Sell a break of 1.0129 (stop at 1.0148)
Daily signals are bearish.
A break of the recent low at 1.0130 should result in a further move lower.
There is no clear indication that the downward move is coming to an end.
Our profit targets will be 1.0079 and 1.0069
Resistance: 1.0200 / 1.0240 / 1.0260
Support: 1.0150 / 1.0130 / 1.0100

Potential Trade setup at which we should be looking atHi There,
Hope you all good, I am sharing my view on this pair. Hope it will help.
Trade according to your strategy.
Have a good day!

EURUSD SELL TO BUYEURUSD SELL TO BUY
In lower timeframes we are bearish, looking to be a part of the countertrend as the higher timeframe is bullish.
Selling to our point of interest, buying at that area and TP out of the sell

aave usdtLooks to me like the correction is starting we will be going down to the 162-158 area again. Divergence on mac d 4 hours been on for a while we got a cross down on 1mij 3min and 5 waiting for the 1 hour.
I closed longs at 172 going for short today, keep your risk low 2.5% you’ll be safe
5min chart
Bearish cross 9,13 down through the 20
Ema 9,13,20 pointing down

usd/cad shortlooking for usd/cad to continue this down trend to Previous low as i also wouldnt be surprised if we create a Lower low here as well
Diclaimer -information shared is for educational purposes and demo purposes only!

KNCUSDT: Potential trend exhaustion KNC had a pretty impressive rally in the recent times, however, looks like a potential trend reversal for KNC with a rejection at 3.3-3.4$ range. A breakout to the upside would invalidate this IDEA.

quick aave signalaave is breaking out take attention head and shoulder being reversed by inverse head and shoulder break of the trendline strong monthly candles
keep your risk 2.5% add positions along the road slow and steady

EURNZD Sell a break of yesterday low.EURNZD - Intraday - We look to Sell a break of 1.6149 (stop at 1.6191)
A break of yesterdays low would confirm bearish momentum.
Daily signals are bearish.
There is no clear indication that the downward move
is coming to an end.
Our profit targets will be 1.6027 and 1.6007
Resistance: 1.6220 / 1.6250 / 1.6300
Support: 1.6150 / 1.6100 / 1.6030


DOT/USDT Bilateral Flag!hello everyone,
as it currently looks, the Cryptocurrency Polkadot is well on the way to forming a Bilateral Flag.
I drew 2 entries, one for Long and the other for short.
have a nice day to all of you!

SAND/USDT @TheSandboxGamePlease find detailed insight into SAND/USDT.
During uncertain market conditions there aren’t many opportunities which can be taken advantage of, but one which I’ve been waiting for is SAND due to Alpha 2 being announced (Alpha 2 is effectively the 2nd test bed for their platform which allows people to participate in game play)
In the lead up to and during Alpha 1, Sand went from $2.96 to $8.50 over a period of 3 weeks.
There is no guarantees that this will happen this time round but then there is no reason to suggest it won’t happen and realistically should actually perform even better due to having a larger community behind the project than they had 4 months ago during Alpha 1.
It has been confirmed that Alpha 2 will be going live on March 3rd.
SAND is a project which I feel can still perform very well over the next 12/18 months even if we were to endure the overall market conditions which I have suggested.
Not only are the fundamentals strong with the launch of Alpha 2 announced for 03/03/2022, we also have confirmation of a double bottom at $2.67 which we might be lucky enough to test once more if Bitcoin moves down towards $32,800.
Daily RSI is verging on close to oversold and volume has massively dropped off since Alpha 1 in November last year.
Anticipating a move back up towards $7.00, possibly a retest of previous ATH at $8.50.

How to Trade & Sell Options?-Take a look into this short post on options trading and get the basic essentials you need to form an idea of how things work in options market.

Peloton (PTON) - Rising in the time of uncertainty 🤷-Great interest on this stock but is it worth it? Well lets take a look at the company and the situation.
-Peloton’s shares soared almost 21% on Monday, closing slightly above the company’s debut price of $29, as the beaten-down connected fitness company attracts interest from outsiders.
-Thus far, reports have named Amazon and Nike as potential suitors. One analyst thinks Apple is “aggressively involved,” too. But all talks are preliminary, and Peloton has yet to kick off a formal sales process
-For one, CEO John Foley along with other Peloton insiders had a combined voting control of roughly 80% as of Sept. 30, making it practically impossible for any deal to go through without their approval.
Baird analyst Jonathan Komp said in a research note on Monday that Foley likely won’t be willing to sell, unless there is enough internal pressure stemming from Peloton’s recent stock sell-off.
-Financially company is not really doing well as the Q2 2022 results were a total disaster with an EPS of -33% and Earnings -1.51%. This year alone the stock fell 79% from its former price point.
Another big issue financially is that the company is not in profit and won't be for the future 3 years. With the current economical situation where the economy might get unstable after the rate rise, any unprofitable company is at a great risk. Golden rule, positive cash flow is the king!
But we think the biggest issue is that they have less than 1 year of cash runway..
-Revenue vs Market: PTON's revenue (16.9% per year) is forecast to grow faster than the US market (9% per year). This is good!
-High Growth Revenue: PTON's revenue (16.9% per year) is forecast to grow slower than 20% per year. Not so good for a company that is expected to grow faster than the industry and the market average.
Our Target Price:
1st Target: $35
2nd Target: $24

EUR/CAD Long Confirmation. Long Term Swing Trade Positions into 1.46450 look valid. great Risk Reward on this trade.

DXY Critical Point 11/02/2021we can see the price has showed some resistance and felled off back to its bearish trend but yet we have a heavy Accumulation zone at 88-90to which market has already showed some reaction and it stood as a support area, we may have some retrace back up to the 38% or 50% of current bearish wave Fibonacci levels and then heads down to the -61.8 of the same wave expansion,
we have defined few TP areas by the confluences of Fibonacci and Price Action where we expect to get if DXY continued its down trend.
from the other side we are having some fundamental news also coming which is not seems to be that good for the greenback and some how supports the fall of the Currency temporally
by this analysis we can be more bullish on the USD Quote instruments and bearish on Base ones.
we are publishing this idea Neutral we had seen some Regular Bullish Divergence with MACD coming up in the Weekly Time Frame which is in the linked ideas

EURUSD Critical Point 11/02/2021as we had observed a H&S pattern on this instrument (Linked) and Bearish Divergence with MACD (Linked) now we are at a critical point
as market can move heavily to either of sides.
we can take our positions as soon as we get a break trough and confirmation pull back on any sides.
we should have an eye on DXY as it has also showed some reaction on its current zone(linked)
we shall update this instrument as it gives us a better definition soon

EURCAD Bearish Divergence, yet Longing Chances Too 07/02/2021 this instrument has got two scenarios
seem bearish to our eye as it has done its Distribution after showing some Regular Bearish Divergence with MACD which is the sign of trend reversal and a retracement unto the Fibonacci Golden areas but it is conditioned to break the blue trend line and if so the we can have our 2 bearish TPs...
if not
then we have the Bullish scenario which we can target Minimum of 1.71 CAD of our Fibonacci expansion .27% where we have specified it as Long TP.
Remember it is on the Weekly time frame so we may need to be more focused on fundamental of the market to get the grip of our Final decision and use the technical chart as a confluences along with it...
we are having mostly Bearish sentiment on this but we kept the Bullish back door open yet
which side do you think it goes?

RSR Analysis with 3 Targets 07/02/2021as we ca see this instrument is just broken its past low accumulation zone and entered to a volatile accumulation zone
which is its preparation zone for some blasting move up.
we can forecast the up coming targets by initially the parallels leg zone of Fibonacci projection 1TP and if touched by the 2TP which is the extension zone of the same fib projection and i.e. we are defiantly meeting our 3TP
and then a fall or some retracement in its coming distribution zone so keep it on for now
what do you think?
