Cardano breakout right around the corner ADABTC Make sure to LIKE and FOLLOW
Thanks, LiquidMEX
DISCLAIMER:!!!This is not to be considered financial advice is my personal opinion, always do your own research before entering or exiting trades as i will not be held liable for any of your trades!!!
Tradesignals

cad/jpy bearish trade setupCADJPY, bearish divergence formed for selling. price testing monthly resistance area march 2019 84.00-84.10. suspect fall reason seasonal strength expected in jpy pairs soon.

NZDUSD Sell on Pullback (Daily)NZDUSD has formed a sell setup on the daily chart after completing a pullback to the previously broken rising trendline.
In the shorter-term, the pullback aligns with the 61.8% Fib level, which may signal that the recent short-term downtrend may continue.
Zooming out to the daily, we can also identify a symmetrical triangle, which suggests that the longer-term downtrend in the pair may continue further south.


Ethereum Technical Analysis for Swing TradersConclusion for today’s Ethereum price analysis: 168.40 is critical for the price of Ethereum and a breakout above the price level implies resumption of bullish momentum.
Ethereum analysis for today is carried out on the 6 hour timeframe using a logarithmic scale, and chart inspection is from September 12, 2018 to current date.
A range bound price movement is identified for Ethereum and drawn on the chart between 168.40 and 104.42. Of particular importance is the former price level (i.e. 168.40) as it was previously a support level for Ethereum back in September of 2018.
Same support price level presented resistance for price action in the week of January 02, 2019, and also again on January 24, 2019 as highlighted by the blue ellipses. The implication of the above is that the upper boundary of the range movement indicates a change in polarity and/or significance of the price level for Ethereum going forward.
Current bullish trend on the 6 hour timeframe chart from a price low of 84.00 on December 15, 2018 is also important to pay attention to as price breaking below improves the likelihood of testing the bottom of the price range at 104.42.
Retracement of price to 104.42 and consolidation that is confirmed by momentum presents a buying (long) opportunity in Ethereum. This strategy is considered less conservative than if price attempts a breakout above 168.40.

USDCAD Potential Buy on D1Here's an interesting setup in USD/CAD. The pair trades close to a rising trendline support, respected the 61.8% Fib retracement previously and is overall in an uptrend.
Zooming in into the 4-hour chart reveals a falling wedge pattern, which during price-corrections is a bullish sign.
The Canadian dollar is slightly underperforming for the day as oil prices are somewhat lower.
Join our Telegram channel for more updates: t.me

USD SGD Live Update: Bearish Trend is Not Yet Over...Conclusion for today’s analysis: The minimum expectation for the USDSGD is ~1.33439.
Price action from May 03, 2018 to current date is shown in today's analysis for the USDSGD on a 6 hour timeframe. A top formation that took almost 6 months to complete i.e. between July 02, 2018 to December 27, 2018 is identified as a complex head and shoulders pattern.
Confirmation of the chart pattern occurred on the January 04, 2019 when price action closed below the neckline of the pattern at ~1.36138. The bearish implication of the pattern mentioned above is not yet complete and the minimum expectation for price action is 1.33439 achieved via a vertical projection of distance between the head of the pattern and the neckline.
Any current bullish swing or retracement of the current uptrend should be considered for entry point into a bearish position(s).

Stellar (XLMUSD) Chart Pattern Analysis: Intraday TimeframePrice closing above the bearish channel and also above ~$0.1470 helps to increase the chance of continuation of bullish momentum.
Analysis for Stellar (XLM) for today is carried out on a 6 hour timeframe, with price action from June 27, 2018 to current date.
The symmetrical triangle drawn on the chart lasted over 4 months before eventual confirmation and breakout of the chart pattern on November 22, 2018. Bullish price swing from ~$0.09 to $0.14 broke out of a bearish swing that lasted for about a month and is part of the move to the downside confirming the triangle.
Conservative entry into a long position which also implies continuation of bullish momentum in Stellar would require a break above the current bearish channel (highlighted in green) and also price closing above ~$0.1470 which is used as the upper boundary of immediate overhead supply or resistance.
A break below the lower boundary of the bearish channel decreases the chance of continuation of the bullish price swing from the December 15, 2018 low of ~$0.09.

Ethereum Price Analysis: Live Update
Conclusion for today’s Ethereum Analysis: Price breaking out above $167.10 can be used to initiate long (buy) position(s) provided momentum offers evidence.
Ethereum price analysis for today is presented on a logarithmic scale with the chart covering over 11 months of price action. Bearish trendline drawn on the chart is used to highlight the overall trend in price for the duration mentioned.
Important attention is drawn to ~$167.10 price level as it did offer support for price on September 11, 2018, but currently presents resistance, and hence retracement in price considering the bullish price swing from ~$81.96.
$167.10 and $134.33 is therefore considered in this analysis as the upper boundary and lower boundary respectively for resistance/overhead supply.
A conservative way to enter a long (buy) position(s) is on a breaking out above the upper boundary of resistance.

USING DEMAND ZONES in your trading, and the perfect example: ZRXGuys if you don't understand supply and demand zones its one of the basic aspects of trading and more important than learning chart patterns in my opinion.
Have a look at this chart and you can see how significant a supply or demand zone can be for trading: and why im long on ZRX again.
Also note how we had a full daily stoch reset recently also.

ZRX / 0x : Pumped and DUMPED! Time for some action.Two predicted paths of movement here for ZRX/BTC..
Possible buy zones outlined in aqua.


EURAUD Head and Shoulder (Right 4 hr timeframe)Buy limit at 1.5580
Stoploss 1.5560
Swing Postion to top of right shoulder

EURNZD LongEURNZD is reaching a weekly demand zone and has a confirmation bullish pin off of the 1 hr time frame.

VECHAIN, SCALP OPPORTUNITY or DESTINED for DOOM?VECHAIN showing bull div on the 12 HR
Notice how we have come completely outside the developing VA, this can mean one of two things - either strong downwards movement coming, or a bounce back into the VA.
Expecting a bounce to the significant resistance level at the 0.618 fib line, which coincides with the downtrend line and the first HVN of the value area.
We need to observe the price action at this level closely to see if we will continue the bear trend, if so then we buy at the demand zone at 127 sats.

$BTC a overview.. are the bears in control?As mentioned in my previous idea a break under 6890 and we will continue downwards.
This new chart is outlying new crucial support levels, my personal view is that if we don’t hold above the 0.5 fib line things will get pretty messy.


Potential Swing trade Setups on Several Currency pairsWait for the clean signals to be appeared on the market in order to take an opportunity to gain some profits

BCC and waiting for Second Biggest moveAs shown in chart BCC Formin Bullish pennants, just like its name suggests, signals that bulls are about to go a-charging’ again.
This means that the sharp climb in price would resume after that brief period of consolidation, when bulls gather enough energy to take the price higher again.
To play this, we’d place our long order above the pennant and our stop below the bottom of the pennant to avoid fakeouts.
Like we discussed earlier, the size of the breakout move is around the height of the mast (or the size of the earlier move)
keep follow to get all our updates
Good Luck
Thank you
-----------------------------------------------
Do not read and leave... Like, Comment and Follow ,,,, its' so easy :)


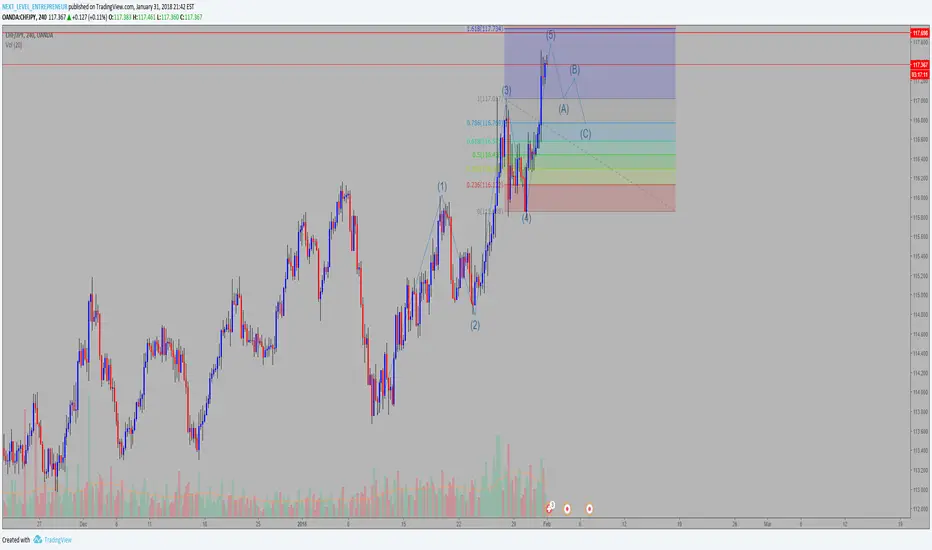
CHF/JPY SHORT
CHF/JPY is looking to complete a five wave structure and should be correcting back downward with an ABCD wave formation. There is a resistance zone on a daily and it is backed up by the 1.618 fib level.

GOLD SETUP - IT COULD GO EITHER WAYGold is on a trend downwards in other words bearish but it has a lot of room upwards as well to mean bullish. With that said, I have drafted how I see it going as you can follow on the chart above.
My believe is it will continue with the trend downwards if it respects the resistance lines. If it breaks them then we go bullish. If it respects them then we continue bearish and we have a lot of room downwards as well.
Remember to trade with good risk management and respect the market with realistic expectations.
As I always say, your management of your expectations may as well be the only key you need to find your success in this industry.
Good luck.
