GOLD BUY INTACTFinal bullrun towards 34xx plus is remaining to complete ite wave before goes sideways to decide either going down or ATH
Tradewar

Direct Buy In Gold : Coming Currently gold is trading under falling wedge pattern which will explode soon once volume will come . Buying here is good idea imao

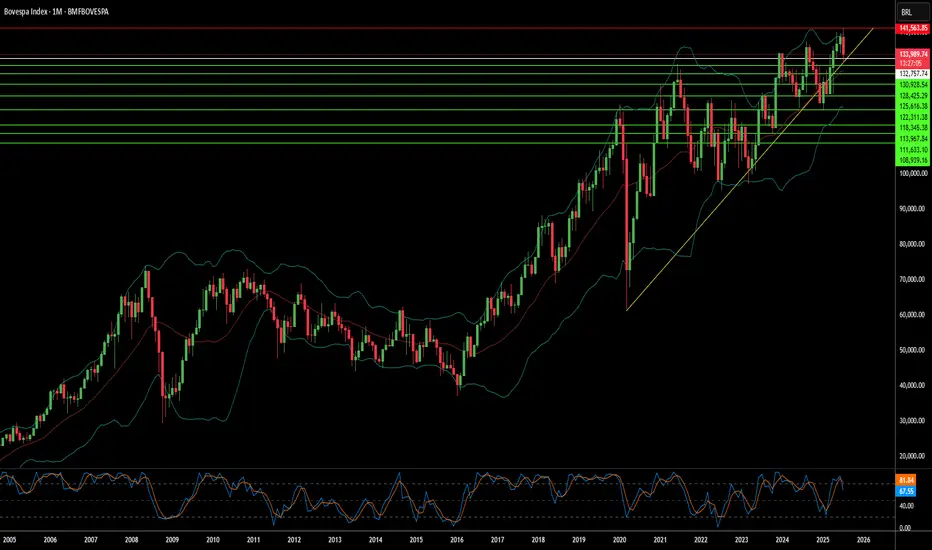
Has Geopolitics Clouded Brazil's Market Horizon?The Bovespa Index, Brazil's benchmark stock market index, faces significant headwinds from an unexpected source: escalating geopolitical tensions with the United States. Recent decisions by the US administration to impose a steep 50% tariff on most Brazilian imports, citing the ongoing prosecution of former President Jair Bolsonaro, have introduced considerable uncertainty. This move, framed by the US as a response to perceived "human rights abuses" and an undermining of the rule of law in Brazil's judiciary, marks a departure from conventional trade disputes, intertwining economic policy with internal political affairs. Brazilian President Luiz Inácio Lula da Silva has firmly rejected this interference, asserting Brazil's sovereignty and its willingness to negotiate trade, but not judicial independence.
The economic repercussions of these tariffs are multifaceted. While key sectors like civil aircraft, energy, orange juice, and refined copper have secured exemptions, critical exports such as beef and coffee face the full 50% duty. Brazilian meatpackers anticipate losses exceeding $1 billion, and coffee exporters foresee significant impacts. Goldman Sachs estimates an effective tariff rate of around 30.8% on total Brazilian shipments to the US. Beyond direct trade, the dispute dampens investor confidence, particularly given the US's existing trade surplus with Brazil. The threat of Brazilian retaliation looms, potentially exacerbating economic instability and further impacting the Bovespa.
The dispute extends into the technological and high-tech realms, adding another layer of complexity. US sanctions against Brazilian Supreme Court Justice Alexandre de Moraes, who oversees Bolsonaro's trial, directly link to his judicial orders against social media companies like X and Rumble for alleged disinformation. This raises concerns about digital policy and free speech, with some analysts arguing that regulating major US tech companies constitutes a trade issue given their economic significance. Furthermore, while the aerospace industry (Embraer) received an exemption, the broader impact on high-tech sectors and intellectual property concerns, previously highlighted by the USTR regarding Brazilian patent protection, contribute to a cautious investment environment. These intertwined geopolitical, economic, and technological factors collectively contribute to a volatile outlook for the Bovespa Index.


Why Are Markets Rising Despite the Tariffs?Because of the
1) Set timeline on finalizing the tariff rates and
2) The ongoing negotiations,
They aimed at striking a balanced deal between the U.S. and its trading partners.
The Liberation Day tariffs were announced on 2nd April, and markets initially crashed in response. However, just seven days later, on 9th April, the U.S. postponed the higher tariff increases for most countries by 90 days. Since then, markets have rebounded and even broken above their all-time highs set in December last year.
Now that the dust is settling with the expiration of timeline and ongoing negotiations, the big question is:
Where will the markets head next?
Mirco Nasdaq Futures and Options
Ticker: MNQ
Minimum fluctuation:
0.25 index points = $0.50
Disclaimer:
• What presented here is not a recommendation, please consult your licensed broker.
• Our mission is to create lateral thinking skills for every investor and trader, knowing when to take a calculated risk with market uncertainty and a bolder risk when opportunity arises.
CME Real-time Market Data help identify trading set-ups in real-time and express my market views. If you have futures in your trading portfolio, you can check out on CME Group data plans available that suit your trading needs www.tradingview.com

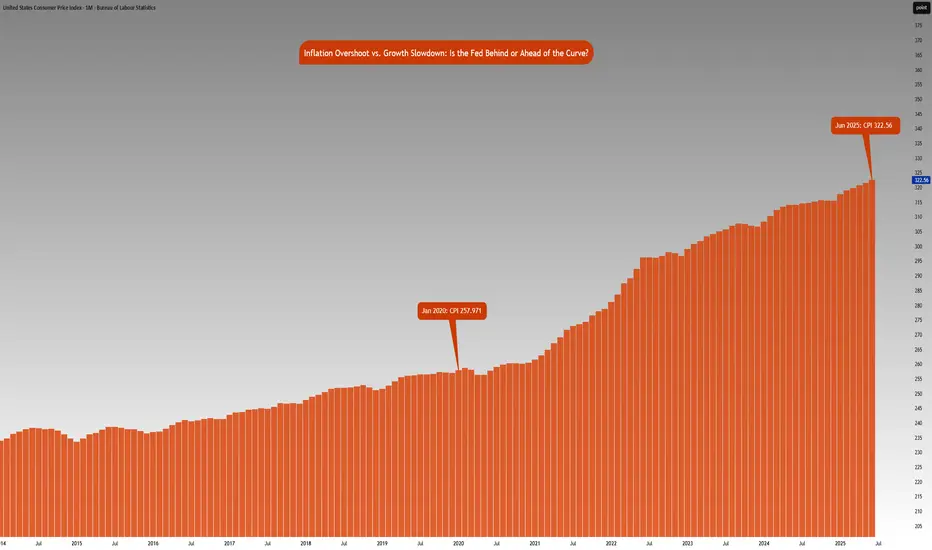
Inflation vs. Growth : Is the Fed Behind or Ahead of the Curve?CME_MINI:NQ1! CME_MINI:ES1! CME_MINI:MNQ1! CME_MINI:MES1! CBOT:ZN1!
Fed Policy recap:
There is an interesting and unusual theme to keep an eye on this week. The Fed is in a ‘blackout period’ until the FOMC meeting- this is a customary quiet period ahead of an FOMC policy meeting. Fed Chair Powell is scheduled to give a public talk on Tuesday. Although his address will be focused on the capital framework of the large banks, this appearance will be closely watched for any subtle signals on the FOMC policy stance.
Especially given that last week, Federal Reserve Governor Chris Waller made a speech, “The Case for Cutting Now” with a purpose as he stated to explain why the FOMC should reduce rate by 25 bps at the July 30th, 2025 meeting.
His stated reasons were:
1. Tariffs create one-off price level increases with transitory inflation effects, not sustained inflation momentum.
2. He argued that much of economic data points towards interest rates should be lowered to FOMC’s participants' median neutral rate, i.e, 3%.
3. His third stated reason notes that while the state of the labor market looks resilient on the surface, accounting for expected data revisions, private-sector payroll growth has peaked, with more data suggesting increased downside risks.
His speech further explains:
• Growth has decelerated sharply: Real GDP rose only ~1% annualized in 1H25, a significant slowdown from 2.8% in 2H24, and well below long-run potential.
• Consumer spending is weakening, with real PCE growth falling to ~1%, and June retail sales showing soft underlying momentum.
• Broader labor market indicators, including the Beige Book and JOLTS data, show declining labor demand and hiring caution, suggesting increasing downside risks to employment.
• Inflation is slightly above target (PCE ~2.5%) but driven primarily by temporary, one-off tariff effects. Core inflation ex-tariffs is likely near 2%, and expectations remain anchored.
• Current fed funds range (4.25%–4.50%) is well above neutral (3%), implying excessive restraint.
• With inflation risks subdued and macro conditions deteriorating, a preemptive rate cut now provides optionality and avoids falling behind the curve if the slowdown deepens. Further cuts may be warranted if trends persist.
• The tax bill contains pro-growth provisions, but its economic impact is expected to be minimal in 2025.
Source: Federal Reserve Speech, The Case for Cutting Now Governor Waller
Inflation Analysis:
Let’s compare this with what we have previously mentioned regarding inflation. CPI index stood at 257.971 points in January 2020. Projecting this at a 2% Fed target, June 2025 inflation should be around 287.655 points. However, June 2025 inflation is currently at 322.56 index points, 12.2% higher above 2% the inflation trend. Effectively, this means annualized inflation since January 2020 is roughly 4.15%.
The Fed is in a real dilemma whether cutting rates given the inflation trend in the last 5 years and risks to inflation outlook justify cutting rates.
Key Questions to ask
Markets are forward looking. Investors and participants want to know:
• How will the rates impact the cost of debt service? Currently the third largest government expenditure, over $1.03 trillion.
• Will the tariff rate offset the tax revenue losses by extending tax cuts?
• Is the fiscal path sustainable?
• What happens to the long end of the yield-curve?
• Will the Fed monetize the debt issuance imbalance?
• Is this simply Governor Waller positioning himself for the next appointment of Fed Chair when Fed Chair Powell’s term expires in May 2026?
It seems there is a huge conflict between longer term implications vs quick short term fixes that align with US administration objectives.
The Week ahead:
It is a relatively light economic calendar in the US. Flash PMI readings and housing data on the docket. The primary focus as it has been for most weeks since President Trump took office, will be on the developments in trade policy and any further comments on Fed and Chair Powell. The threat of renewed tariffs starting August 1st, is also key to monitor and whether these protectionist measures will force US’s trading partners to make further concessions to negotiate trade deals.
The earnings season is off to a good start with major US banks reporting higher EPS and revenue than expectations. This week investors will be looking at Q2 earnings reports from Alphabet, Meta, Microsoft from the Mag 7 and Tesla.
Gold Between Trade Optimism and Economic Concerns
Gold is declining for the second consecutive session, although it remains above the critical psychological level of $3,300 per ounce in early spot trading this morning.
Losses in the precious metal come amid renewed optimism over potential trade agreements that could de-escalate the global trade war, alongside upbeat sentiment regarding the strength of the U.S. economy following last Friday’s labor market data.
The 90-day suspension of tariffs imposed by the administration of President Donald Trump is set to expire on Wednesday, but it could be extended at least until August 1, according to statements from both the president and Treasury Secretary Scott Besant.
Both the United States and its allies and trade rivals appear eager to reach an agreement. China and the U.S. are moving to implement the framework of a previously reached trade deal by reviewing the export restrictions imposed on one another. Meanwhile, European officials stated last week that a draft agreement with the U.S. may be near, aiming to maintain base tariff rates at just 10%, according to The Wall Street Journal .
Markets appear largely unbothered by trade developments, given the flexible and seemingly open-ended deadlines and the lack of major surprises, according to analysts cited by Reuters . This easing of concern may lead gold to gradually lose the risk premium it had gained from fears of a global trade war.
Still, those concerns could return swiftly if negotiations fail and heavy tariffs are reinstated. The Washington Post reported that a potential U.S.-Vietnam trade deal may anger China and, in turn, reduce the likelihood of a broader deal between Beijing and Washington.
Additionally, the prolonged uncertainty itself may start to weigh on the U.S. economy, which could, over time, rekindle demand for gold as a safe-haven asset. The Editorial Board of The Journal noted cracks in the U.S. labor market that lie beneath the better-than-expected headline figures released Friday. The report revealed weak hiring in key private sectors, a decline in manufacturing employment, and a drop in labor force participation to its lowest level since 2022.
The Editorial Board called for dissipation of uncertainty around trade policy to encourage private sector hiring, as companies remain hesitant amid the current indecision in the White House. Another report from The Journal also warned that prolonged uncertainty could weaken the U.S. dollar, delay corporate investment and spending, and dampen business confidence.
On a related front, The Journal’s chief economics commentator Greg Ip criticized what he called “fiscal dominance” under Trump, where the Federal Reserve may be pressured to lower interest rates to ease the burden of the rising deficit caused by tax cuts. He warned this could undermine economic strength and increase inflation in the long run.
In my view, the early signs of a deteriorating U.S. fiscal position could become one of the key long-term drivers of sustained gold gains—even if markets remain complacent for now and equities continue climbing to record highs. This would not reflect an economic cycle, but rather a deeper shift in market fundamentals characterized by eroding confidence in the U.S. economy and its currency.

NZDCAD: High-Conviction Long - Fundamental Strength & TechnicalThis analysis identifies an extremely high-conviction long opportunity in the NZDCAD currency pair 📈🇨🇦🇳🇿. Our conviction is primarily driven by a significant divergence in monetary policy outlooks and economic fundamentals between New Zealand and Canada. New Zealand's economic resilience, underpinned by robust dairy prices and a less dovish central bank stance, contrasts sharply with Canada's decelerating growth, rising unemployment, and a central bank poised for further rate cuts amidst trade policy uncertainties. Technically, NZDCAD appears poised for an upward move from key support levels, supported by bullish momentum indicators on the 4-hour chart. This is a medium-term trade expected to play out over days to weeks. 🗓️
I. Fundamental Rationale: Diverging Economic Trajectories 📊🌍
The core of this trade lies in the starkly different economic paths New Zealand and Canada are currently on, creating a compelling fundamental case for NZD appreciation against CAD:
Monetary Policy Divergence:
New Zealand (NZD): The Reserve Bank of New Zealand (RBNZ) maintained its Official Cash Rate (OCR) at 3.25% in June 2025. Analysts anticipate a hold at the upcoming July 9 meeting, balancing growth concerns with an "uncomfortably high near-term inflation outlook". This signals a less aggressive easing path. 🏦🇳🇿
Canada (CAD): In contrast, the Bank of Canada (BoC) held its policy rate steady at 2.75% in June 2025, after nine consecutive 0.25% cuts since June 2024. Market expectations for the upcoming July 30, 2025 meeting indicate a 33% chance of a further 25 basis point cut, with economists anticipating gradual cuts to 2.25% by mid-2025. This clear easing bias is driven by consistently below-target inflation (1.73% in May 2025). 📉🇨🇦
Impact: This creates a clear and widening interest rate differential fundamentally favoring the NZD. 💰
Inflation Outlook:
New Zealand: Annual inflation accelerated to 2.5% in Q1 2025, exceeding market expectations and marking the highest rate since June 2024. This reinforces the RBNZ's cautious stance. ⬆️
Canada: Canada's CPI registered 1.73% in May 2025, notably below the BoC's 2.0% target, providing ample justification for further monetary easing. ⬇️
Economic Performance & Labor Market:
New Zealand: GDP is projected to grow by 1.9% in 2025. The unemployment rate remained unchanged at 5.1% in March 2025, with average hourly earnings increasing by 4.5% annually. 💼✨
Canada: Real GDP contracted by 0.1% in April 2025, with a flash estimate pointing to another 0.1% decline in May, implying an annualized loss of 0.3% in Q2 2025. The unemployment rate rose to 7.0% in May 2025, its highest since September 2016 (excluding pandemic years). 📉🏭
Impact: New Zealand demonstrates greater economic resilience and a more stable labor market. 💪
Commodity & Trade Dynamics:
New Zealand: Benefits significantly from surging dairy prices, its top export commodity, which saw a substantial 10% increase in Q1 2025, with Fonterra forecasting record milk prices and production volumes. This contributed to a robust monthly trade surplus of $1.2 billion in May 2025. 🥛🧀💰
Canada: While the CAD maintains a strong positive correlation with oil prices, energy exports decreased by 5.6% in May, with crude oil exports falling 4.0%. Furthermore, Canadian exports to the US have declined for four consecutive months due to ongoing US tariffs. 🛢️📉
Impact: Strong commodity tailwinds and a healthy trade surplus for NZD, versus tariff-induced headwinds and declining energy exports for CAD. 🌬️
Yield Differential: The New Zealand 10-year government bond yield (4.57% as of June 30, 2025) is notably higher than Canada's (3.38% as of July 3, 2025). This provides a positive carry for holding NZD over CAD. 📊
II. Technical Rationale: Chart Insights (4-Hour Timeframe) 📈🔍
The technical picture on the 4-hour chart supports a bullish reversal from current levels, complementing the fundamental outlook:
Current Price Action & Long-Term Trend: NZDCAD is currently approximately 0.8277 (as of July 1, 2025). While short-term analyses may show a "sharp bearish trend," the pair is described as "trading in an uptrend and currently is in a correction phase" as it approaches a key support area. The 1-month change for NZDCAD is +0.13%, and year-to-date is +2.45%, indicating a longer-term bullish bias despite recent fluctuations. This corrective dip presents a favorable entry point. 📉➡️📈
Key Support & Resistance Levels:
Entry Point (0.8270) is strategically chosen near the immediate support cluster, specifically around the Pivot Point 1st Support of 0.8276 and an identified buying opportunity zone around 0.82700. ✅
Take Profit (TP) of 0.8350 is positioned just below the Pivot Point 3rd Level Resistance of 0.8356. 🎯
Stop Loss (SL) of 0.8220) is carefully placed below the key support levels of 0.8240 (Pivot Point 3rd Support) and 0.8236 (Pivot Point 3rd Support). A sustained break below this level would invalidate the bullish thesis. 🛑
Momentum Indicators:
RSI (14): The 14-day RSI for NZDCAD is around 41.78 to 54.33, suggesting a neutral to slightly bullish sentiment, with room for upward movement. 📊
MACD (12, 26, 9): A "bullish divergence" has been identified on the hourly timeframe, often signaling a return of buying interest. The MACD line is also observed to be slightly above its signal line, hinting at a potential bullish crossover. ⬆️
Moving Averages: The 50-day Simple Moving Average (SMA) is positioned slightly above the 200-day Exponential Moving Average (EMA). This configuration suggests a potential bullish crossover of longer-term moving averages, generally considered a positive long-term signal. 📈
III. Trade Setup: 📋✨
Currency Pair: NZDCAD 🇳🇿🇨🇦
Direction: Long (Buy) ⬆️
Entry Point: 0.8270
Take Profit (TP): 0.8350
Stop Loss (SL): 0.8220
Calculated Risk (in pips): 50 pips
Calculated Reward (in pips): 80 pips
Risk-Reward Ratio: Approximately 1.6:1 (A favorable ratio for a high-probability setup!) ✅
Key Considerations: Always adhere to strict risk management principles, risking no more than 1-2% of your total trading capital on this single trade. Be mindful of potential volatility around upcoming high-impact economic events in July, particularly the RBNZ and Bank of Canada interest rate decisions, and inflation data. 🗓️🔔

Gold May Find Support From These Various FactorsGold May Find Support Amid Concerns Over U.S. Debt Sustainability, Economic Weakness, and Renewed Geopolitical Tensions
Gold prices are holding steady today, near $1,353 per ounce in spot trading, in what is expected to be a low-liquidity session due to the early closure of U.S. markets. This follows three consecutive days of gains.
The yellow metal’s subdued movement comes as markets await key labor market data that may offer further insight into the health of the U.S. economy, especially after the recent shock from ADP figures.
Gold continues to find support from several underlying factors that could sustain its upward trend this week. These include rising uncertainty around the long-term sustainability of U.S. public finances and the risk of renewed conflict in the Middle East.
Concerns over U.S. fiscal stability have intensified following the introduction of the “One Big Beautiful Bill Act,” which combines tax cuts with spending reductions. In an opinion article for The New York Times , former Treasury Secretaries Robert Rubin and Lawrence Summers warn of the bill’s potentially severe consequences, including persistently high interest rates, reduced business confidence, falling investment, and the risk of a financial shock that markets may struggle to absorb. This could also leave the economy more vulnerable to economic and geopolitical threats.
Such risks may erode investor confidence in U.S. government debt, potentially boosting gold’s appeal as a safe-haven asset even in an environment of elevated bond yields and prolonged high interest rates.
On the geopolitical front, the specter of renewed escalation in the Middle East looms, and this time, the consequences could be more severe. Amid conflicting reports and statements regarding the extent of the damage to Iran’s nuclear facilities, both sides appear to be preparing for the possibility of renewed hostilities.
Diplomatic efforts remain stalled, and hardline voices continue to call for a return to conflict. In an opinion piece for The New York Times, former National Security Advisor John Bolton described negotiations with Iran as ineffective and dangerous, calling instead for regime change and the use of force.
While previous rounds of conflict have not caused lasting damage to the global economy or energy supply chains, a new round may prove more disruptive. According to Reuters , Iran has reportedly loaded naval mines onto vessels, raising fears that it may attempt to close the Strait of Hormuz.
Such a move would cross a critical threshold and turning a contained conflict into one with global economic implications. The Strait of Hormuz handles over one-fifth of the world’s crude oil and liquefied natural gas exports.
However, Iran may avoid this step as long as its own oil exports continue flowing through the strait, as was the case during the last conflict in June.
On the trade front, there is growing optimism about the potential for new agreements that could ease tensions that have disrupted global supply chains and threatened U.S. and global economic growth. This optimism follows President Trump’s announcement of a trade deal with Vietnam.
There is also hope that progress can be made with China. Recent reciprocal steps, that involve the easing of restrictions on rare earth exports by China and some relaxation of U.S. technology export controls, suggest that the de-escalation agreed upon earlier in Switzerland could hold, potentially laying the groundwork for a broader trade agreement.
Samer Hasn

Can Gold Regain Ground as Risk Factors Persist?
Gold is holding steady and posting a modest rebound today after notable losses yesterday, though it continues to struggle to reclaim the $3,330 per ounce level.
The precious metal’s ability to resume gains stems from continued market uncertainty surrounding both geopolitical and trade-related risks, which could sustain demand for safe-haven assets.
On the geopolitical front, despite the optimism sparked by the surprise ceasefire agreement that ended the twelve-day war between Israel and Iran, the possibility of renewed escalation remains on the table.
Media outlets have been abuzz with a leaked intelligence report to CNN that was about that the U.S. strike only managed to delay Iran’s nuclear program by a few months and did not eliminate its stockpile of enriched uranium. In other words, the war ended before achieving its core objective—let alone dismantling Iran’s ballistic missile capabilities.
This could also complicate any future negotiations, as Israel may double down on its demands for a complete dismantling of Iran’s nuclear and missile programs, while Tehran may cling even more tightly to these programs following the recent conflict.
On the other hand, New York Times columnist Thomas Friedman expressed hope that the political fallout for both sides might generate internal pressure strong enough to prevent another confrontation.
In any case, should escalation resume, markets may enter a new cycle of geopolitical risk. However, such episodes are unlikely to last long unless the red line is crossed, namely, direct attacks on key oil and gas export infrastructure or on global shipping routes. This logic explains the fragile nature of the risk premiums that both oil and gold gained during earlier waves of escalation.
Now that the latest round of conflict has ended, the market's attention could shift back to trade tensions, which remain unresolved. The suspension of U.S. tariffs on the European Union is set to expire in early July, with the deadline for China following in mid-August.
This comes at a time when businesses still face considerable uncertainty over tariffs and inflationary pressures, as highlighted in recent S&P Global PMI surveys across the Eurozone and the United States .
A return to tariffs or the collapse of trade negotiations could once again ignite fears of persistent inflation, which would likely keep interest rates elevated for longer in the U.S. This, in turn, poses a threat to economic growth. This is the dynamic that has historically been supportive for gold. Conversely, resolving these concerns may strip gold of one of its main drivers, making previous record highs harder to reach.

Geopolitical Oil Shocks May Be Short-Lived and Prices May Fall
Crude oil prices are climbing by over 1% today across both Brent and West Texas Intermediate, approaching their highest levels since January.
These gains are driven by rising concerns over the fallout from a potential escalation in the Israel–Iran war, especially with the prospect of direct U.S. military involvement that could widen the conflict and threaten oil supplies from the Middle East.
Talks are intensifying around a possible U.S. strategic bomber strike on Iran’s Fordow uranium enrichment facility. Such a move would mark a dangerous new phase of escalation, raising the risk of supply disruptions from key oil-exporting countries via the Strait of Hormuz or the Bab el-Mandeb Strait, according to several analysts and opinion columnists . Iran’s major oil export facilities may also be pulled into the conflict sooner rather than later.
Any attack on these energy assets could trigger a price shock that sends oil soaring toward $130 per barrel, according to estimates from JPMorgan .
The first step toward this new phase of escalation may not be far off, as former President Trump appears unshaken by potential consequences—the include regional instability to possible retaliatory attacks on U.S. and allied interests abroad. According to Axios , he is doubtful about the effectiveness of the bunker-busting bombs intended for a Fordow strike.
Even without such a strike, a prolonged conflict with little hope for a diplomatic resolution would likely increase the vulnerability of global oil flows, as reported by the Wall Street Journal earlier this week. However, such disruptions are expected to remain short-term, in my opinion.
In the longer run, this war is unlikely to be sustainable in its current form. Israel is reportedly facing a dwindling supply of interceptor missiles, with reserves potentially lasting just 12 more days at the current rate of Iranian rocket fire, according to experts cited by The Washington Post . The Journal also quoted a U.S. official who mentioned a decline in Israel’s supply of Arrow missiles used to intercept ballistic threats.
In my view, Israel will likely avoid reaching such a tipping point unless it achieves a decisive turning point in the conflict, whether through sidelining U.S. involvement or toppling Iran’s regime. If neither is achieved, Israel may resort to targeting Iran’s oil and gas export infrastructure to enforce a surrender. This action that could send oil prices into shock in the coming days. A drawn-out war in its current form is unsustainable for either side.
Still, a diplomatic solution is not entirely off the table. A senior Iranian foreign ministry official told the New York Times that Tehran may accept Trump’s offer to meet soon for a potential ceasefire discussion. Such developments could reduce the geopolitical risk premium priced into oil and potentially push U.S. crude back below $70 per barrel.
In any case, I believe any shock to oil prices would likely be temporary, as major producers are generally capable of offsetting short-term supply disruptions unless we enter into extreme scenarios, as noted by the Wall Street Journal’s Editorial Board earlier this week.
On another front, oil prices are also under increasing pressure from concerns around prolonged monetary tightening by the Federal Reserve. Jerome Powell’s speech yesterday disappointed markets, striking a more hawkish and cautious tone than before on interest rate cuts.
Policymakers have grown increasingly wary of inflation risks, particularly with the renewed trade war and rising geopolitical tensions, which could potentially push inflation above 3 percent again.
Such extended tightening could weigh further on economic growth or even trigger a recession, dragging down oil demand and keeping prices on a downward trajectory.
Monetary tightening risks also overlap with persistent negative signals from China. Despite improvements in retail sales and declining unemployment, both industrial production and fixed-asset investment slowed unexpectedly in May. Goldman Sachs also expects continued weakness in China’s housing market, which could remain at just a quarter of its 2017 peak level for years to come.
Should trade negotiations between the U.S. and China fail, both economies and oil prices could face further downward pressure.
Samer Hasn

Gold Loses Shine Amid Hopes the Middle East War Remains Under Co
Gold is showing little movement today, holding near $2,386 per ounce after a drop of over 1.4% yesterday.
This weak performance comes as market fears over the fallout from the Israel-Iran conflict have eased. Investors are hopeful that energy supplies flowing from the region to the rest of the world will not face major disruption.
Scenarios that could shock oil prices, according to Axios , include Israel striking Iran’s key export facilities, Iran targeting production sites in the region, or the closure of the Strait of Hormuz. None of these developments have occurred so far, which has kept fears of renewed inflation and persistently high interest rates in check.
The Editorial Board of the Wall Street Journal believes that global oil production capacity can absorb supply disruptions unless they are catastrophic, such as a closure of the Strait of Hormuz.
As long as the conflict does not severely disrupt energy supplies, markets may downplay its impact. This limits the geopolitical risk premium that would otherwise support further gains in gold prices.
However, if diplomacy fails to contain the conflict soon, Iran may choose to escalate it by shutting down the Strait of Hormuz, according to experts cited by The Journal . This concern could prompt the US and Gulf states to intensify diplomatic efforts or even pull the US directly into the conflict.
Beyond the military situation, markets are watching developments in the US-China trade dispute, where talks have yet to make meaningful progress. The lack of a breakthrough could push the US to impose restrictions on semiconductor exports and manufacturing equipment, threatening billions in American corporate sales, according to The Journal .
Such moves might trigger further escalation by China, which holds leverage through its dominance in rare earth metals. Renewed tensions could disrupt supply chains and drive inflation even higher.
Although recent inflation data do not suggest a sudden surge in prices, experts told The New York Times that the effects of tariffs and supply chain disruption may take months or even over a year to feed through to consumer prices. This is partly because sellers can rely on pre-tariff stockpiles and offer discounts for a period.
Failure to resolve these issues could see inflation rebound, keeping interest rates high at levels that the economy may not be able to bear. The chief economics commentator at The Journal wrote last week that the Federal Reserve should shift its focus from fighting inflation to supporting the economy through rate cuts, given signs of labor market weakness.
Persistently high rates or further increases, along with rising bond yields, may not weigh on gold. On the contrary, they could support demand for the safe-haven asset as worries about slowing growth and recession deepen.
Uncertainty in the bond market remains high compared to levels before the Ukraine war in 2022, as shown by the ICE BofAML TVC:MOVE index, which measures fear in the US Treasury bond market. This could limit the downward pressure of rising yields on gold prices.
Markets are awaiting tomorrow’s Fed decision on interest rates, with attention focused on Jerome Powell’s remarks after the announcement. A stronger Fed stance on keeping rates elevated for longer might temporarily pressure gold. However, renewed concerns about economic growth could quickly restore demand for the yellow metal.
Data from China also continue to fuel economic worries. Recent figures show industrial production and fixed-asset investment growth slowing more than expected, which could bolster demand for safe-haven assets like gold.
Samer Hasn

Weekly Market Outlook: FOMC, Trade Deals and GeopoliticsIt is a holiday-shortened week, with the majority of markets halting early on Thursday, June 19, 2025, in observance of Juneteenth. See here for holiday trading schedule
Key Themes to Monitor This Week
Geopolitical Risks
Any outside intervention in the ongoing Israel-Iran conflict will likely be seen as a risk-off event by market participants. Despite Friday’s sell-off, markets shrugged off during the Sunday open and overnight sessions.
There are potential risks to trade routes and energy infrastructure, although disruptions seem unlikely at the moment. Amena Bakr at Kpler noted that, so far, there are no signs of disruptions in oil loadings from Iran. Without a supply outage, there is no pressing need for additional barrels to be brought onto the market.
Trade War and Trade Deals
There have been recent developments with the U.S. reaching key trade deal milestones with several countries. The baseline scenario remains optimistic, with expectations for an extension in negotiations and potential reciprocal tariffs for countries failing to reach agreements.
FED Week
This is a key week for U.S. monetary policy, with the FOMC decision, Summary of Economic Projections (SEP), and Chair Powell’s press conference scheduled.
Traders will be closely watching how the Fed’s inflation and growth expectations have evolved, as reflected in the SEP. All eyes will be on the dot plot to note how interest rate expectations have evolved since last quarter. Of note: Will President Trump’s continued calls for rate cuts influence Chair Powell’s tone or guidance?
Expectations for the Week Ahead
NQ futures have continued one-time framing higher, consistently creating higher lows since the week of April 21, 2025. A strong support zone exists below, anchored at the yearly Volume Point of Control (VPOC) and the Anchored VWAP from May 11, 2025, when markets gapped higher.
Key Levels to Watch
• yVAH: 22,690.50
• R2: 22,510
• R1 / Previous Week High: 22,322.50
• May 11 AVWAP: 21,672.25
• yVPOC: 21,660
Scenario 1: Market Grinds Higher but Stays Cautious
Despite several looming risk factors, the market could continue to grind higher. In this scenario, we anticipate a test above the prior week's high, followed by a potential pullback into last week’s range.
Example Trade Idea 1
• Entry: 22,000
• Stop: 21,930
• Target: 22,322
• Risk: 70 pts
• Reward: 322 pts
• Risk-Reward Ratio: 4.6R
Scenario 2: Pullback to Support, Range-Bound Consolidation
If the market pulls back, we expect the yearly VPOC and AVWAP from May 11 to act as key support levels. In this case, price action may remain range-bound within the previous week’s range, forming an inside week.
Example Trade Idea 2
• Entry: 21,672
• Stop: 21,600
• Target: 22,000
• Risk: 72 pts
• Reward: 328 pts
• Risk-Reward Ratio: 4.6R
________________________________________
Glossary
• VPOC: Volume Point of Control
• VA: Value Area
• VAL: Value Area Low
• VAH: Value Area High
• VP: Volume Profile
• AVP: Anchored Volume Profile
• Y: Yearly
• pWk: Previous Week

USD/JPY takes fresh dip on renewed trade uncertaintyThanks to ongoing trade uncertainty and troubles in the bond market, the USD/JPY looks like is going to end the week on a negative note, after coming down sharply in the last day and a half, which means the weekly gains have more than halved.
The US dollar had actually clawed back a bit of ground in early Friday trading after taking a hit the day before. The rebound came despite fresh drama around Donald Trump’s tariff policies, which—unsurprisingly—are once again stirring the pot. A federal appeals court gave the president a temporary lifeline, pausing a ruling that could have derailed much of his economic agenda.
The White House team wasted no time doubling down: Trump, they insist, isn’t backing off. Tariffs are sticking around. But the mood got murkier when Treasury Secretary Scott Bessent admitted that US-China trade talks are “a bit stalled.” Then came Trump’s latest post on Truth Social, where he accused China of “totally violating” the trade deal with the US.
Markets didn’t take it well. US indices dipped, USD/JPY slid, and even the euro managed to push the dollar back a touch.
As well as well as trade uncertainty eyes will turn to incoming US data next week, among them the monthly jobs report on Friday.
The US jobs report is always important as it could impact the Fed’s future policy decisions. Traders will want to see whether the trade war uncertainty is negatively impacting the jobs market too, after several macro data, including consumption data in GDP report and consumer sentiment surveys, have come out weaker in recent weeks. JOLTS jobs data and ISM PMIs are also due out earlier in the week.
The US dollar has been under pressure in the last three months or so, with the euro performing admirably during this time despite US tariffs.
With the US recently losing its final top-tier credit rating at the hands of Moody’s a couple of weeks ago, investors are worried that debt concerns and government spending will push yields even higher and thus they are shorting Treasuries and the dollar, buying foreign currencies, including the euro. This makes the EUR/USD outlook remain fairly resilient around the 1.12-1.15 range.
By Fawad Razaqzada, market analyst with FOREX.com

Nvidia Earnings Boost, Trade Tariffs Legitimacy, NQ trade ideaCME_MINI:NQ1!
Big Picture Context: .
NQ futures rallied after NVIDIA posted an earnings beat and after the Manhattan-based Court of International Trade blocked President Trump's Liberation Day tariffs.
Goldman Sachs noted that the ruling on Liberation Day tariffs gives the administration 10 days to halt tariff collection, but does not affect sectoral tariffs. The administration can still impose across-the-board and country-specific tariffs under other legal authorities.
Jobless claims and continuing claims have come in higher.
What has the market done?
The rally faded in the overnight session. However, the catalysts provided energy for prices to move higher. Currently, price is trading above the prior week’s high, yesterday’s high, and it is also trading above the yearly open, and 2025 VPOC and mcVPOC for the last 3 weeks.
What is it trying to do?
The market is negating the recent bear market territory sell-off and negating a bear market rally. It is propelling higher.
How good of a job is it doing?
The market has created good structure and micro composites, despite some gaps left open, and it has created higher lows since last Friday.
What is more likely to happen from here?
Scenario 1: Long Continuation
In this scenario, we are looking for NQ to turn at the immediate 2025 LVN support area. If it edges higher, we will be looking for potential long opportunities above the 21710–21720 area, targeting overnight highs and potentially the next HVN.
Scenario 2: Gap Close and Reversal
In this scenario, we are looking for a pullback, testing pHi and pWk-Hi. We will look for a rounded base that consolidates here on a lower timeframe, such as the 5-minute timeframe, and look for a reversal back towards the 21710–21720 level.
pWk-Hi: prior Week's High
pHi: prior Day's High
HVN: High Volume Node
LNV: Low Volume Node
VPOC: Volume Point of Control
C: Composite (prefix before VAL, VAH, VPOC, VP, AVP)
mC: micro-Composite (prefix before VAL, VAH, VPOC, VP, AVP)

$SPX / $SP500 – China Deal or Global Meltdown? The Risk/Reward 📉 The S&P 500 ( SP:SPX / VANTAGE:SP500 / $ES_F) is at a geopolitical crossroads.
After the Global Pause, the index rebounded, but only to retest resistance near the 200-day EMA. Now it faces a binary outcome:
Scenario A: ✅ Deal with China
Estimated probability: 20%
Potential upside: +10%
Expected value: +2%
Scenario B: ❌ No Deal with China
Estimated probability: 80%
Potential downside: -50%
Expected value: -40%
📉 Expected move: -38% net Markets are not priced for this. Volatility ( TVC:VIX ) is quietly coiling under the surface (chart 2), ready to explode if the no-deal scenario materializes.

Is the Golden Arches Losing Its Shine?McDonald's, a global fast-food icon, recently reported its most significant decline in U.S. same-store sales since the peak of the COVID-19 pandemic. The company experienced a 3.6 percent drop in the quarter ending in March, a downturn largely attributed to the economic uncertainty and diminished consumer confidence stemming from President Donald Trump's tariff policies. This performance indicates that the unpredictable nature of the trade war is prompting consumers to curb discretionary spending, directly impacting even seemingly resilient sectors like fast food through reduced customer visits.
The link between sinking consumer sentiment and tangible sales figures is evident, as economic analysts note the conversion of "soft data" (sentiment) into "hard data" (sales). While some commentators suggest that McDonald's price increases have contributed to the sales slump, the timing of the decline aligns closely with a period of heightened tariff-related anxiety and a contraction in the U.S. economy during the first quarter. This suggests that while pricing is a factor, the broader macroeconomic environment shaped by trade tensions plays a critical role.
In response, McDonald's emphasizes value offerings to attract and retain customers navigating a challenging economic landscape. The company's struggles mirror those of other businesses in the hospitality sector, which also report reduced consumer spending on dining out. The situation at McDonald's serves as a clear illustration of how complex trade policies and the resulting economic uncertainty can have far-reaching consequences, affecting diverse industries and altering consumer behavior on a fundamental level.

Is the US Dollar Preparing for a Bullish Comeback?The DXY is currently maintaining a bullish setup amid trade negotiations, election developments, and anticipation of key leading U.S. economic indicators this week.
An inverted head-and-shoulders formation is visible on the 4-hour time frame. A decisive catalyst and a breakout above the 100.00 and 100.30 levels are needed to confirm a more sustained bullish bounce from multi-year lows, with targets at 102.00, 103.30, and 104.70 — reversing recent strength in major global currencies.
On the downside, a breach of the 97.00 level could trigger a decline toward the lower boundary of the long-term uptrend channel established since 2008, aligning with the 92.00 zone, and potentially lifting gold and major currencies globally.
Several key events this week could challenge or reinforce the current bullish setup amid ongoing Trump–China trade negotiations:
U.S. Advance GDP & Core PCE — Wednesday
BOJ Rate Decision & U.S. ISM PMI — Thursday
U.S. Non-Farm Payrolls — Friday
Mega Cap Earnings — Wednesday/Thursday
While long-term signals remain bearish, short-term charts suggest a potential bullish recovery, with trade negotiations likely to tip the balance.
Written by Razan Hilal, CMT

EUR/JPY Technical Outlook: Demand Zone Bounce Sets Up RallyGood Morning Traders,
Trust you are good.
Below is my analysis of the EURJPY pair.
Overview
Price is currently at 161.243, showing signs of a bullish rebound following a sharp drop. A clear bullish structure is forming, characterized by higher lows and a breakout from a recent consolidation zone. The demand zone between 160.900 and 161.100 has held strong, acting as a reliable support level.
Idea
A recent bullish impulse broke above minor resistance, followed by a healthy retracement into the demand zone—shaping a potential bullish flag or continuation pattern. This retracement aligns with the 50% Fibonacci level, providing added confluence for a continuation to the upside.
The projected target is 164.174, a level likely to contain buy-side liquidity and act as a magnet for price in the short term.
Conclusion
Despite macro uncertainty due to ongoing trade tensions, recent news of a 90-day tariff pause from Trump has eased some pressure, allowing the EUR to show resilience. As a result, EUR/JPY may continue its bullish push toward the 164.174 target. However, a break below 160.245 would invalidate this outlook.
Cheers and happy trading!

Trump vs. Powell: 4d Gold Price Roller Coaster📊 Summary of Recent 4 Trading Days
During the ongoing US-China trade war, President Trump has ramped up his public criticism of Federal Reserve Chair Jerome Powell. Though he lacks the authority to remove Powell directly it seems, Trump's frustration with the Fed’s independent policy direction has led to an apparent institutional power struggle.
This conflict hasn’t gone unnoticed by the markets. Just the mention of removing Powell caused the gold price to spike, as stock market money got squeezed out, amplified by tensions in the trade war. The Federal Reserve’s credibility is high, so such remarks naturally trigger significant volatility.
After Trump's initial outburst, gold surged $216. But when he softened his tone, the price reversed just as dramatically—falling about $240 (with the trading day still ongoing at the time). Hopes for progress in trade negotiations also played a role in this sharp reversal.
⚠️ Warning Signs of Market Distortion
Statements from the US President now function almost like market-moving events in addition to normal news. For gold traders, this creates an unstable environment where typical technical setups may fail.
The past days showed signs of manipulated or artificial movements—with potential insider activity. One notable example: Gold looked set to break higher after a 1-hour candle closed above the EMA 20 line. But a sudden $12 bearish candle in the last 30 seconds erased the setup. It felt orchestrated—possibly by institutional players defending key levels.
💡 Trader’s Takeaway
Don’t blindly trust technical signals in this environment.
Watch for political noise—it’s louder than usual.
Prefer quieter markets if you’re risk-averse.
Expect $100+ daily ranges and frequent price whipsaws.
🗣 What’s your take?
Is Trump really influencing the gold market on purpose—or just creating chaos? Let’s discuss below. 👇
-------------------------------------------------------------------------
This is just my personal market idea and not financial advice! 📢 Trading gold and other financial instruments carries risks – only invest what you can afford to lose. Always do your own analysis, use solid risk management, and trade responsibly.
Good luck and safe trading! 🚀📊

Why Did 3M Stock Soar Despite Tariff Clouds?Shares of industrial giant 3M Co. experienced a significant rally following the release of its first-quarter 2025 financial results. The surge was primarily driven by the company reporting adjusted earnings and total net sales that exceeded Wall Street's expectations. This performance signaled a stronger operational footing than analysts had anticipated.
The positive results stemmed from several key factors highlighted in the report. 3M demonstrated solid organic sales growth and achieved notable adjusted operating margin expansion. This margin improvement reflects the effectiveness of management's ongoing cost-cutting initiatives and strategic focus on operational efficiency, contributing directly to double-digit growth in earnings per share during the quarter.
While the company did warn about potential future impacts on 2025 profit due to rising global trade tensions and tariffs, management also detailed proactive strategies to mitigate these risks. Plans include supply chain adjustments, pricing actions, and leveraging their global manufacturing network, potentially increasing U.S. production. The company maintained its full-year adjusted earnings guidance, notably stating that this outlook already incorporates the anticipated tariff effects. Investors likely responded positively to the combination of strong quarterly performance and clear actions to address identified headwinds.
