Chinese secret weapon, BoC interest rate decision & US GDPYesterday was “dictated” by the dollar but without new highs and explosive growth. By and large, consolidation at the top is continuing. For a breakthrough to new local maxima, a serious reason is needed. In theory, today's data on US GDP might be a reason for this. These are revised growth figures for the first quarter. However, analysts are skeptical enough - the majority is expecting a revision of the preliminary value downward. We also tend to the fact that the data will come out either extremely close to 3% or even lower. So, in our opinion, the dollar would rather “rush” downward than upward. In this regard, our position on finding points for sales, the dollar has not changed. Rather, the current entry points are very close to the ideal ones.
The trade war escalation initiated by the United States naturally raised a question on a retaliatory strike from China. So far, Sino actions were more than restrained, but there is a huge range of methods in Chinese to influence. We are going to talk about a secret weapon today. Everyone has heard about the volume of US government debt owned by China and the markets attention is oriented in that direction, but a blow could be struck out of the blue. China is the world leader in the supply of rare-earth elements (controls about 80% of the world market), which is crucial for many modern industrial products. So hypothetically, as a means of counteracting US aggression, the Chinese authorities may limit their deliveries to the United States, which, in turn, will have a very negative impact on a number of American companies.
The decision of the Bank of Canada on the parameters of monetary policy was announced yesterday. The rate was left unchanged. Comments of the Central Bank as a whole were cautious. The Central bank is concerned about the uncertainty due to the trade war.
All investors' attention will be focused on data on US GDP. As for our trading positions, they have not changed: we will look for points for buying of the euro and the pound against the US dollar, sales of oil and the Russian ruble, as well as buying of gold and the Japanese yen.
Tradewar

Trade war price, short dollar and Bank of CanadaTuesday turned out to be another quiet day. So, we have time to talk about global things. For instance, about the possible price of a trade war for the United States, China and the world as a whole. The fact is that trade wars have been discussed often, almost constantly, but at the same time, some things are sounded as self-evident without any refinements to detail.
Therefore, today we would like to talk about the price of trade wars. In the end, this problem will be solved until the end of this month (the meeting of the United States and China leaders at the G-20 summit), and the losses are already taking place now.
So, economists at Bloomberg Dan Hanson and Tom Orlik analyzed the main scenarios of a trade war and its consequences. Their main conclusion is: if tariffs spread to all trading process between the USA and China, then global GDP will lose about $ 600 billion by 2021. By the way, this year will be a peak in terms of losses from trade wars.
If tariffs turn out to be at current levels, in a couple of years China’s economy will lose 0.5% growth as well as the United States - 0.2%. If tariffs are distributed to all groups of goods, then China will lose 0.8% of economic growth, the USA will lose 0.5%, just like the world as a whole.
So, the trade war is, indeed, a key aspect for the modern global economy. No wonder its is paid so much attention by markets and analysts.
Meanwhile, Brandywine Global Investment Management LLC. - an investment fund with $ 72 billion of assets – is predicting the end of the dollar rally. The reason is that the United States will agree with China: the damage from trade wars is too high for both sides. In addition, a trade war hurts US consumer, and setting people up against, on the eve of the US Presidential election, is the last thing Trump wants to do.
Returning to the current situation in the financial markets and the news background, we note that the main event of the environment will be the results announcement of the Bank of Canada meeting. The rate is likely to remain unchanged. We also are not waiting for aggressive comments from the Central Bank - it is not the time to show aggression. Trade war escalation is more than a serious reason to continue to pause. Despite the fact that we do not expect a hawkish position from the Bank of Canada, we believe that the current price of USDCAD is simply excellent in terms of its sales. So, we recommend today to look for points for its sales. In general, you need to sell about 1.35. We place stops above 1.3550, and put profits at the bottom 1.33.
The rest of our trading positions have not changed: we will look for points for buying of the euro and the pound against the US dollar, sales of oil and the Russian ruble, as well as buying of gold and the Japanese yen.

Is silver a safe commodity ?Is silver a safe commodity ? This is the main question. In the short, maybe yes.
The price of silver has once again returned to lateralize in this channel. Between static support at 14.07 and static resistance at $ 14.75 an ounce. Until one of the two is violated, the trend remains flat. So speculators will tend to trade this commodity on very short time frames.
In any case, from a technical point of view, the silver seems to be directed towards the support just mentioned. In any case, from a technical point of view, the silver seems to be directed towards the support just mentioned. A test of the area around $ 14 will trigger a series of long entries by investors, who will keep the positions in the medium period, keeping them in their portfolios up to the maximum target between 16.50 and 17 dollars. Coinciding with the dynamic resistance zone identified by the EMA200 periods.
Basically, this raw material tends to start rising again immediately. The tensions caused by a trade war between the USA and China, the political and economic instability that plagues Europe and a possible return to an even more restrictive monetary policy by the United States, will lead investors to take refuge and differentiate their portfolio with assets such as silver and gold, or other precious materials.
Operative ideas
So, as we said before: Is silver a safe commodity ? Maybe with this strategy.
Having said that, it is advisable to start to position ourself long on the SILVER and increase if the price falls to the support indicated, from a purely technical point of view.
As a first target we can hypothesize the resistance of the channel in which the price is lateralized ($ 14.75). If it is broken to the upside, you will see an acceleration of the price up to the second target in area 15.23. The short-term final target is located close to $ 15.74 an ounce.

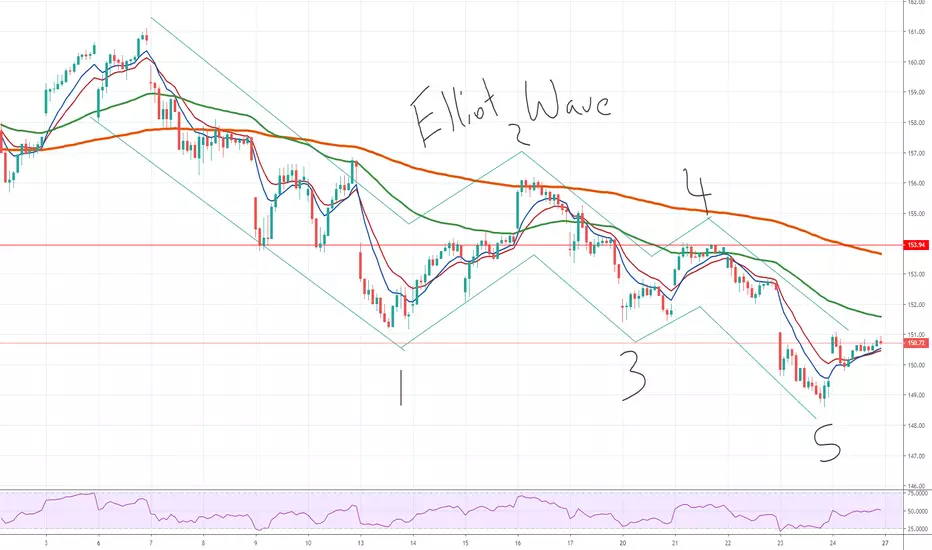
Trade Idea " ES-MINI SP500 " by ThinkingAntsOkTRADE IDEA: E-Mini SP500
Price is on a major descending Trend since 1st of May when the Trade war started escalating between China and the US. we expect this situation to keep bringing uncertainty and making the price to fall. That’s the context of the trade
Technically we see the yellow bearish trendline as the main one of the descending movement. If the price reaches it will be a major zone to look for reversals, also we have the middle trendline of the Weekly ascending channel, That trendline has been working as a major support/resistance zone for a long time ago ( more than 200 days)
4H VISION:
Items you should wait before Trading:
-Reversal Candlestick patterns on the trendline
-Volume Decreasing when the price reaches the trendline.
-A clear ascending structure where you can draw a pattern, like a Wedge for example.
-All the final arrangements do it on a 15 or 10 minutes chart to confirm that the ascending movement towards the yellow trendline is weak.
-If the situation goes as expected consider risk management of 0.5% or less, the stronger concept of the trade will be the position of the Stop.
If all these items happen, then look for a BO of the ascending structure with your TP and SL close to the areas that are shown on the picture.
Use this as information to improve or discard any trade made by your own analysis, remember always take your decisions! ALWAYS!
Please note that the above perspective is our view on the market, We do not give signals and take no responsibility for your trades.

US DOLLAR INDEX (DXY) 4-HR TECHNICAL & FUNDAMENTAL ANALYSISthis forecats will be unique and split in two as we look at the geo-political factors affecting the US dollar.
Technicals:
---------------
The US dollar index is moving in an uptrend, making a series of higher highs and higher lows. It has recently broke a counter-trendline on the 4-hour timeframe and is expected to move higher. The dollar has continued to strengthen against major currencies like the sterling pound and the Australian dollar over the past weeks.
Fundamentals:
-------------------
The Trump administration has made it clear that it aint scared of escalating the trade war against China, as long as they feel China still needs to learn a lesson. Trump made it known to the world (on Twitter obviously!!!) that he will not be reaching a consensus with the Chinese any time soon. This has proved positive for the United States dollar as the US has all the leverage against China, with goods of up to USD$200 billion at stake. China is at crossroads with it's flagship telecommunications company Huawei also being hung out to dry by American companies like Google and the SD Association. China clearly is moving one step closer to Mr Trump's "nuclear football" in this "cold war" warfare. It is surprising that people still hate Trump after all he did for the US economy. It's like how they rejected the prophets even though they had good intentions. I believe most hate stems from Mr Trump's no-nonsense immigration stance as foreigners fear that they will be chased back to their motherland. Otherwise some of the racism claims are baseless. And yeah they almost purged Kanye West for saying that Trump was gonna make America "great again". My loyalty lies with whoever makes me money, though that my leave my ethics in question. The truth is as a trader, Mr. Trump has made it easier for me to understand the dollar movement and therefore he has my respect. If you already feel like throwing up after reading this then go book a session with Hillary Clinton and Obama. First black president but aint done nothing but the crappy Obamacare. Lest you doubt, let me tell you some of the highlights of Trumps office run:
1) Managed to stop World War 3 by having talks with the mental North Korean Supreme Leader, Kim Jong-un, convincing him to reduce/stop the nuclear race.
2) Best stock market rally with Dow Jones Index closing at $26,828.39
3) Started the biggest trade war in history and still has leverage (still on top)
4) Almost 4 million jobs created since election.
5) More Americans are now employed than ever recorded before in our history.
6) Created more than 400,000 manufacturing jobs since election.
7) Manufacturing jobs growing at the fastest rate in more than THREE DECADES.
8) Economic growth last quarter hit 3.2 percent.
9) New unemployment claims recently hit a 49-year low.
10) Median household income has hit highest level ever recorded.
11) African-American unemployment has recently achieved the lowest rate ever recorded.
12) Hispanic-American unemployment is at the lowest rate ever recorded.
13) Asian-American unemployment recently achieved the lowest rate ever recorded.
14) Women’s unemployment recently reached the lowest rate in 65 years.
15) Youth unemployment has recently hit the lowest rate in nearly half a century.
16) Lowest unemployment rate ever recorded for Americans without a high school diploma.
17) Veterans’ unemployment recently reached its lowest rate in nearly 20 years.
18) Almost 3.9 million Americans have been lifted off food stamps since the election.
19) The Pledge to America’s Workers has resulted in employers committing to train more than 4 million Americans.
20) 95 percent of U.S. manufacturers are optimistic about the future—the highest ever.
21) Signed the biggest package of tax cuts and reforms in history. After tax cuts, over $300 billion poured back in to the U.S. in the first quarter alone.
22) As a result of the tax bill, small businesses will have the lowest top marginal tax rate in more than 80 years.
23) Helped win U.S. bid for the 2028 Summer Olympics in Los Angeles.
24) Helped win U.S.-Mexico-Canada’s united bid for 2026 World Cup.
25) Opened ANWR and approved Keystone XL and Dakota Access Pipelines.
26) Record number of regulations eliminated.
27) Enacted regulatory relief for community banks and credit unions.
28) Obamacare individual mandate penalty GONE.
29) More affordable healthcare options for Americans through association health plans and short-term duration plans. The FDA approved more affordable generic drugs than ever before in history. Many drug companies are freezing or reversing planned price increases.
30) Reformed the Medicare program to stop hospitals from overcharging low-income seniors on their drugs—saving seniors hundreds of millions of dollars.
31)Signed Right-To-Try legislation.
32) Secured $6 billion in NEW funding to fight the opioid epidemic.
33) Reduced high-dose opioid prescriptions by 16 percent during his first year in office.
34) Signed VA Choice Act and VA Accountability Act, expanded VA tele-health services, walk-in-clinics, and same-day urgent primary and mental health care.
35) Increased coal exports by 60 percent; U.S. oil production recently reached all-time high.
36) United States is a net natural gas exporter for the first time since 1957.
37) Withdrew the United States from the job-killing Paris Climate Accord.
38) Cancelled the illegal, anti-coal, so-called Clean Power Plan.
39) Secured record $700 billion in military funding; $716 billion next year.
40) NATO allies are spending $69 billion more on defense since 2016.
41) Process has begun to make the Space Force the 6th branch of the Armed Forces.
42) Confirmed more circuit court judges than any other new administration.
43) Confirmed Supreme Court Justice Neil Gorsuch and nominated Judge Brett Kavanaugh.
44) Withdrew from the horrible, one-sided Iran Deal.
45) Moved U.S. Embassy to Jerusalem.
46) Protecting Americans from terrorists with the Travel Ban, upheld by Supreme Court.
47) Concluded a historic U.S.-Mexico Trade Deal to replace NAFTA. And negotiations with Canada are underway as we speak.
48) Reached a breakthrough agreement with the E.U. to increase U.S. exports.
49) Imposed tariffs on foreign steel and aluminum to protect national security.
50) Imposed tariffs on China in response to China’s forced technology transfer, intellectual property theft, and their chronically abusive trade practices.
51) Net exports are on track to increase
52) Improved vetting and screening for refugees, and switched focus to overseas resettlement.
53) Begun building the US-Mexico border wall which will curb drug trafficking from Mexico.
Source: www.whitehouse.gov

MY AAPL (Weekly)Mi análisis técnico personal en visión semanal. Neutral, por decir algo.
Aunque no hay certeza de nada, puede ser probable el escenario debido al conflicto imperial en curso.
Salud!
------------------
My personal technical analysis in weekly vision. Neutral, to say something.
Although there is no certainty of anything, this scenario may be probable due to the ongoing imperial conflict.
Cheers!

Nasdaq bullsthe UStech100 has retested the 7264 level 3times is time to buy the ustech100 or will it fall to the lower levels and break the trandline anyway i follow the trend because its my friend till the end will have to wait and see stops in oder in case im wrong.

IWM, iShares Russell 2000 Index, forming downward Elliot Wave.The IWM iShares Russel 2000 Index has formed a downward Elliot Wave pattern on the 30 min interval chart. This is a sign of strong bearish sentiment, likely due to the continuously escalating trade war between Washington and Beijing. Similar patterns are seen on the 30 min charts of other index ETFs, such as the SPY S&P 500 index, the QQQ Nasdaq Trust, and the indices themselves, such as SPX, IXIC, etc. Essentially, this pattern is shared market-wide, suggesting further medium-term bearish movement. If this is accurate, it is not to say that the market will make small bullish moves; those are necessary to the structure of the Elliot Wave.
NZDUSD BUY TRADE - TARGET 0.66800-WEEKLY TIMEFRAME HAMMER CLOSURE
-HAMMER AFTER 8 DAY BEARISH TREND\
-HELD AT DAILY PURPLE RESISTANCE AT 0.65150
-DAILY & H4 BREAK OUT OF BEARISH TREND
-NO LONGER SITTING BELOW MOVING AVERAGES ON H4 DAILT TIMEFRAMES
-FIB RETRACEMENTS WORK AS TARGET ZONES

Gold: 2nd and Strong Breakout of Falling TrendlineSince the first breakout of the 3-Month falling trendline, the gold fell all the way close to the previous low and found support at 1273.2.
The price consolidated for about 2 trading days and yesterday it finally jumped and broke above the falling trendline for the second time.
This is also fundamentally caused by falling stock prices and weakening of the dollar as it found resistance at the previous high which is largely the cause of the US-China trade war.
The dollar is most likely to fall further resulting in a stronger gold price in the short to mid-term perspective.
Wait for the price to retrace lower and look for buy opportunity again when the price is closer to 1280.

NVDA $208 Don’t Slack, I’m Bringing Sexy Back1. Face it, Bitcoin is back and NASDAQ:NVDA got crushed end of 2018 specifically because of the rev losses from their flagship mining chips. (Which i was not aware are connected to the A.I. in self driving vehicles). Billions are going into that industry too.
2. They beat earnings on Thurs, 5/16 and shot up to $173 after hours, however what i’m about to show you is the algos needed to hit their 618 fib level target first... Which they did in the last 10 min of trading on Friday, 5/17. From a wall street perspective it’s, “Why would i go long and buy the crap out of NVDA when the algo division of my own firm is still shorting the crap out of it, until they hit their target.”. I propose they finally hit their target late Fri.
3. Possible headwinds lie in the China trade war, which ironically may give crypto a boost. The boost being, “If i have to pay a ridiculous tariff on this one thing my company uses everyday, then why not pay for it with Bitcoin/Litcoin/Stellar and save myself a shit ton of money”. Bypassing the tariffs.
STOP LOSS IS VERY TIGHT. If NVDA drops & closes below $152 = BAD and sell all call options.. That would indicate that NVDA is possibly just still a gigantic year long correction. The yellow arrows are the 3 price & expirations staggered out for optimal risk/reward. Your welcome.

Alibaba FractalsLet's say you are going to trade it, are you short or long? For me it's screwed up, I pass this one.

Prospects for peace in trade wars, Japan’s GDP, OPEC+ and BrexitThe previous week has been having a hard time fundamentally duo to Sino-U.S. trade war. China does not intend to a resumption of negotiation still Washington is continuous to speak from a position of strength and power. Therefore the “happy end” was very close but suddenly became subtle. Investors have been hoped for restarting the dialogue and rising in seeking compromise, but on Friday it became clear that it is not something should be counted on. According to the Chinese state media, the country sees no reason for the resumption of the negotiation process. Thus, all hope for a meeting of the heads of China and the United States in the framework of the G-20 summit at the end of June. That is, another month and a half should not count on stress-reduction.
From the perspective of such news, we have become even more confident about our position to buy safe-haven assets (Japanese yen and gold). Accordingly, we are planning to look for points for buying safe-haven assets (Japanese yen and gold) on the intraday basis. As for the yen, today's data on Japan's GDP is additional and a strong argument in favor of buying the Japanese currency. GDP growth in the first quarter significantly exceeded analysts' expectations.
Everything is still bad with the pound, that ended the week with the strongest decline in the last few years. Markets are selling duo to another Parliament vote failure in Britain. Prime Minister Theresa May is under pressure by not only her opponents but also members of her own party. We are talking about her resignation from the post of a leader according to the results of the fourth vote in Parliament. And the results for the current scenario are predictable - a vote “against” the May plan. Despite the extremely attractive points for pound buying, we continue to wait for a fundamental reason for their start.
The results of the previous week appeared pretty successful for oil. But we are still full of pessimism. On the one hand, the trade war is a very negative signal for oil demand, and therefore for a possible increase in asset prices. In addition, we are skeptical about the future of OPEC +. That is, from the supply side in the near future there is a very serious threat. Total, this week we will continue to look for opportunities to sell the asset. But do not tend to get carried away and each intraday position has to be limited with fairly rigid stops. The fact is that the OPEC + meeting held this weekend somehow reassured investors who were nervous. OPEC + participants expressed readiness to comply with the agreement until the end of 2019. And yes, the number of active rigs in the United States has fallen to a minimum over the last 13 months. There are enough bullish signals for oil, especially considering very serious tensions and problem situations in Iran, Venezuela and Libya.
As for our preferences for this week in general and Monday in particular, they are as follows: we will look for points for buying the euro against the US dollar, selling oil and the Russian ruble, as well as buying gold and the Japanese yen. Considering how uneasy the financial markets are, we will limit our positions with fairly shortstops, especially since some of the deals are definitely at odds with the current mood on the markets.

Trade War and Commodities - Technical Behavior ExplainedFirst let's take a look what happened between China and United States.
FUNDAMENTAL VISION
-At the beginning of 2018, United States started a trade war with China, imposing tariffs on different products.
-In response to this measure, the Chinese government imposed tariffs on US products including some raw materials, the main product exported by the United States to China.
-In relation to this, there was an excessive decrease in exports, reaching the minimum quantity exported in the last 8 years.
-By decreasing the demand for products, this led to a decline in prices. In the case of soybean, we saw a few days ago how the price reached the minimum since 2008.
TECHNICAL VISION
WHEAT WEEKLY CHART
SOYBEAN WEEKLY CHART
-We observe that price behavior was pretty similar in both assets.
-In case of Soybean, the first down move was stronger than the Wheat, but then both of them started a similar consolidation/accumulation process to continue the down move.
-In the case of Wheat, price did a -18% movement since the previous Max., and then formed a flag pattern that lasted around 5 months. The breakout was perfect, and the bearish trend continued with a -16% movement. In total the downside movement of Wheat was around -28%.
-The first down move of Soybean, was around -24%. The pattern of consolidation was an ascending wedge for about 6 months, in which the movement after the breakout was slow at the beginning, but then it dropped on a -12% move.

GBPJPY LONGExpecting a big move up very soon on this pair as you can see we have been in a downward correction for a while now.
However, if we break below the blue line then I will be looking to exit this trade.

Buy soya, as trump is hinting to subsidize itthis trade is based on trump's tweet:
"If we bought 15 Billion Dollars of Agriculture from our Farmers, far more than China buys now, we would have more than 85 Billion Dollars left over for new Infrastructure, Healthcare, or anything else. China would greatly slow down, and we would automatically speed up!"
This is with regards to american agricultural exports to china -> Soybeans
This is similar to subsidy, if government subsidies consumer, the price goes down,
in this case the producer is subsidised so the price will go up (government will buy no matter what..)

China on the move, strikes a blowLooks like China's on the move by devaluing their currency against the dollar.
This looks to me to be further escalation.
Bloody Friday in US equity markets tomorrow?

AUDJPY Swing SHORT Trade Executed! Price Aiming For 74.500
Have a look at the above link for the analysis behind this trade setup.
Entry level: at around 77.400
STOP LOSS: 80.300
TAKE PROFIT: 74.500
RR: 1:1
With Trump threatening fresh tariffs on Chinese goods imports, the aussie made a gap down there by breaking the trendline and looks to set to continue its downward channel move!
shall there be any updates, i will update them below as needed. cheers

The USA vs CHINA a view over the 2 Index by ThinkingAntsOkUSA vs China
-Trade War between those two country’s has shown how the markets react on a Negative way to this kind of events.
-Since May 1, Sp500 futures have been falling 5% from Historical Higher highs due to conflicts with China, however, China Index has been on a bearish movement since 17th of April accumulating a bearish move of -10,21%, more than twice of the E-mini SP 500
-While this conflict keep on going we can expect markets to keep reacting on a negative way
-On E-Mini Sp500 we can see that price is inside a bearish channel since the beginning of the movement, this channel has been working as the main trend of that move.
- By Elliott wave theory we can label this structure as a Complex corrective form “ Triple - Threes” and we can expect price to reach again the bottom trendline of the bearish channel, before starting a correction of the whole down movement
- On China Index if price consolidates below 10645.00 we can expect a continuation of the bearish trend towards 9962.00

AUDUSD - Depreciation of the Aussie Dollar AcceleratesAs I said two weeks ago, the AUDUSD went lower than 0.70 and now I believe it will go to 0.68 where there is a strong support from January 2016 for the following reasons:
1- US Dollar Index is on the Upside.
2-The weekly MACD looks bearish.
3- Bad news from the Reserve Bank of Australia.
4- US-China trade war: AUD seen as a proxy for China’s economic wellbeing.
On the other hand, if there are good news from the US-China trade, AUD will be one of the currencies to buy in the short time. However, I do not expect any good news.

S&P 500 - Daily: How serious is this trade war with China?Sentiment: Short
Market Structure: Confirmed Double Top
Daily Resistance Level: 2950
Daily Support Level: 2800
Other Key Levels: 2700 - 2350 - 2125
November 9th, 2016 - a date we may hear a lot of in the next few months. The S&P 500 hasn’t closed below this day ($2,137) since Trump took office. The market rallied over 45% over the last two years, but this trade war with China has triggered a “national emergency” and is starting to eat into investors profits.
The technicals also line up with the tension from the trade war. Let’s break down the Daily chart to grasp what is in store for the lifeline of the US economy.
Let’s start with the previous high at the $2,940 area. Price creates an all-time high however immediately experienced a loss of -20% to our key level $2,350 breaking through multiple key levels.
Next, price pushes back up creating consistent higher highs and lows. A beautiful, almost artificial trend. This trend is respected for months until price reaches about $2,956, not able to confidently clear the highs created at $2,940. Could be the beginning of a double top with $2,350 acting as a neckline.
Looking closer you see that between May 1-7 a double top is confirmed as it pushes through the neckline.
The following week, we have a confirmed EMA crossover and a test of our support level $2,800.
After the retest of current support, there is a 61.8% retracement on May 15th.
Predictions
Fundamentals: We’re following the trade talks, but most news outlets will try to reinforce a positive sentiment to prevent panic because watching your retirement fund lose 5% in a week is never a reassuring feeling. A positive deal will still result in lingering tension as the two leaders battle it out on the world stage and China tries to hold firm.
Technicals: A conservative predication would include a retrace back to the blue line marked retest area, which is also the neckline of the double top. If we find market structure at the retest area this would create another shorting opportunity. The first target level would be support, the $2,800 level. A riskier prediction would be to look for price to push through the $2,800 level within this week or next. Levels for taking profit would be the 38.2%, and 61.8% retracement levels.
What would make this trade invalid?
If price forms market structure at the $2,800 level I would look for long opportunities.
If news comes out regarding trade talks, I would exit positions until indecision has subsided.
A confirmed break pass the retest area
View this article on 9to5FX.com

EURJPY: Trade War For My Account Also Welcome everyone to this new trading analysis on this Wednesday!
We are looking at the EURJPY pair on the 4h chart. Trade war between Trump and Xi is real.. Trump stated a few minutes ago that Xi from China offered something good between the deal.
Instantly all XXX/JPY pairs gained momentum to the upside. Good for my positions as im going to the worst trading week since im trading profitable. How is your trading during the trade war going? Any tips for become super focused on anything besides trading?
Comment Below.
Wishing everyone success and great weekend!

US30 SHORTHigher prices have been rejected on the daily, 4 hour & hourly chart. Massive bearish engulfing candle on the daily and also on the 4 hour, due to trump having a major impact on the movement of the market we had a major rally up towards the top of the channel but as you can see the channel trend was still respected and because of that along with my multiple confluences i am favouring a move to the downside, 25000 is my target area and i will be closing partials along the way down.
i have been monitoring the US30 for some time now and have been anticipating a very big short, it seems that the short has been delayed and not derailed so because of that along with everything else i am staying in this sell and will update you as this moves along.
Lets secure the bag together because everyday is Money day!
Follow my social platforms, Instagram - Vellly - Instagram - Learnitempire
Youtube - Learn interact trade.
