Former Resistance as Support? Now that we are above resistance, are we now about to conceptualization previous resistance as support? It's hard to say given the crazy amount of volatility around Brexit which will be coming if Parliament fails to pass legislation, or if US-China trade war is still on which is trending back in that direction, or if the Fed realizes that they want to actually cut rates towards the end of 2019 given the speed in which they transformed from hawks to doves. Long story short-->price levels to me are still uncomfortably high. I don't think the sky will fall tomorrow, but I'm keeping a close eye on the aforementioned global themes which move markets the most.
If you find this analysis helpful, then please look at the rest of my work at www.anthonylaurence.wordpress.com
Tradewar

CHFJPY Confined in A Weekly wedge. Awaits breakout Momentum!The blue lines represents the support and resistance levels drawn from the monthly charts. If the price breakouts of the triangle in either direction the support or resistance levels next to them needs to be broken decisively in order for the technical aspects to be in our favour of the trade.
shall there be any updates i will post them in a new thread. this just represents my outlook and analysis on this pair. if the technical aspects of this trade meets, i will post the entry and exit details in a new thread. cheers

AUDJPY Looking To HIT 81.000 Level If the Range Breaks!AUDJPY is currently range trading that is visible by looking at the 4hr and daily timeframes. Looking at the main chart it can be seen that the price is confined in between the blue lines (range). Shall a breakout of the range occur to the upside, the price will look to target the 81.000 area where the weekly EMA 50 is present. Have a look at the snapshot of the weekly charts below:
From the chart above, the price is confined in a descending channel and is currently en-route to testing the dynamic EMA 50. Furthermore, the 78.000 psychological level is a concrete support drawn from the monthly charts which has been rejected on too many occasions notably most recently on the monthly candle and the flash crash that happened last month.
A LONG position is favored only if the range breaks to the upside, in other words the daily candle and NOT the 4hr Candle must close outside of the range on the daily charts . Followed by a slight retracement before we could execute a LONG entry. In the future if the price decisively closes above the weekly 50 EMA we could take this pair LONG towards the descending trendline of the main weekly channel.
RISK ON appetite in the market would make AUD more valuable in comparison to safehaven yen which tends be sold off more together with GOLD AND CHF, therefore if a trade deal is made which is a likely scenario we can expect the AUD to rally against the YEN.
This just represents my analysis for this pair, shall the opportunity arise i will post the entry criteria in a new thread. stay tuned and cheers

Trade War Alleviation Gives Much Evidence for UpsideVolatility is decreasing as the trend upwards slows down. I think there is large potential to the upside as the US-China trade war comes to a detente. However, many resistance levels remain in the way before that can happen. On the other hand, the index quite easily blew past previous levels of resistance with no problems. Want to see more talk towards trade war resolution before I'll be bullish. More words on the matter here: anthonylaurence.wordpress.com

DXY Rising WedgeIf trade war resolution between US and China, then short. But if its not substantive or if it doesn't happen at all, then expect this trend to continue.

Yellow Metal Aiming to test 1267.00 level Amid Risk ON appetite!
The above represents the analysis behind this trade setup. keep in mind our target set here is the weekly 50 EMA. Below are the entry details
TRADE TYPE: INSTANT SELL POSITION AT AROUND 1294.00 LEVEL
STOP LOSS: 1321.00
TAKE PROFIT: 1267.00
RR: 1:1
SHALL THERE BE ANY UPDATES I WOULD BE PROVIDING THEM IN THE THREAD. CHEERS

EURUSD - POTENTIAL LONG TERM BEARISH TRADE IDEAHi traders,
The EURUSD is retesting a broken ascending channel that lined up with 61.8 Fib ratio and moving averages.
.
This pair seems to have completed a three-wave correction that unfolds as a double zigzag pattern after a text-book five-wave impulse in wave (i) "red."
.
If this count is correct, the 5-3 wave cycle is almost complete, and a bearish reversal for the start of wave (iii) of 3 down can be anticipated.
.
Considering that price has broken & retested the blue CTL, and we have bearish rejection candles on both daily & H4 chart, we have valid reasons to sell this pair.
.
What's your view on EURUSD? Let me know in the comment.
Safe Trading!
Veejahbee.

USDJPY DAY TRADING Pending Short Trade order!TRADE TYPE: PENDING SHORT ORDER
SELL LIMIT PRICE: 110.518
STOP LOSS: 110.964
TAKE PROFIT: 110.072
REFER TO THE RELATED LINK FOR THE TECHNICAL AND FUNDAMENTAL IDEA BEHIND THIS TRADE SETUP. I SHALL KEEP UPDATING IN THE THREAD BELOW. CHEERS

GOLD Could FALL Before Reaching 1370 level Amid Risk ON AppetiteAs seen, GOLD is trapped in a range bound trading and is currently en route to the crucial resistance level of 1370. However the real question lies whether the GOLD momentum can continue towards this crucial resistance amid a possible and likely RISK ON appetite in the financial markets?
Today FED chairman Powell speaks which could cause intense volatility in FX markets, however it seems the market has already priced in of what is to be expected of his speech today. Markets are already in a RISK ON appetite mode amid the resolution of trade war and tariffs being delayed by the president.
What is Risk-On Risk-Off
Risk-on risk-off is an investment setting in which price behavior responds to and is driven by changes in investor risk tolerance. Risk-on risk-off refers to changes in investment activity in response to global economic patterns. During periods when risk is perceived as low, the risk-on risk-off theory states that investors tend to engage in higher-risk investments; when risk is perceived to be high, investors have the tendency to gravitate toward lower-risk investments.
SOURCE : www.investopedia.com
With the current trade war already coming close to a resolution, RISK ON currencies in this scenario such as AUD, NZD and the EURO could appreciate whereas RISK OFF assets and currencies such as GOLD, CHF and JPY could depreciate. However keep in mind these safehavens are not evenly correlated. For instance JPY could fall if the market are on FULL RISK ON mode whereas CHF could fall slightly given its assets are backed by GOLD itself.
On the Topic of GOLD, the yellow metal is precious and perceived by many as a good future investment given its rising longterm value! Therefore fundamentally it remains to be seen what the chairman of FED has to say today and if the US-SINO trade deal can be agreed soon and what are their terms behind the deal.
Technically speaking GOLD is headed towards the crucial 1370 resistance level where it has bounced off on a numerous occasions. Currently the price is confined in a rising steep daily channel as shown on the main chart. Should anything drastic happen such as a trade deal being closed to agreed then GOLD may breakout of the channel and head towards the rising trendline beneath. On the flip side if the trade talks are slow, then we can expect GOLD to respect the channel and head towards the 1370 level. After reaching there it could be a possible scenario that it keeps climbing or reverses to the lows depending on the technical and fundamental picture at that time.
It remains to be seen what happens. this is just my analysis and not a trade signal. shall the criteria meet i will post the trade signal in the new thread. cheers

EURAUD Likely To Test 1.55 level Amid Risk ON Appetite!With the potential Trade deal getting even closer among the worlds two largest economy and trump delaying the tariffs, The Australian Dollar may appreciate but NOT too much. In the analysis below i explained why the AUD is in for some benefit but DO NOT expect it rally should the trade deal be made!
Same goes Fundamental analysis goes for the EURAUD however in this case shall the trade deal be made the EUR would likely be appreciating but not as compared to the AUD. this week kicks off with busy schedule today with FED chairman about to comment on the monetary policy and the impact the trade war is having on the economy. Have a read at the article below:
Daily FX Market Roundup February 25, 2019
Kathy Lien, Managing Director of FX Strategy for BK Asset Management.
We are starting this busy trading week with solid gains in equities and currencies. Thanks to President Trump who officially delayed the next round of tariffs, all of the major currency pairs are trading higher led by gains in the Australian and New Zealand dollars. While the president hinted at this outcome last week, investors were relieved that his views did not change before an official announcement was made. Of course, the decision to extend the deadline was an easy one because it creates good will without a real commitment. Still, investors liked that it was open ended and that the truce will last until the summit between President Trump and President Xi next month. Assuming that both sides continue to make progress, Trump says they will be planning for a Summit at Mar-a-Lago to conclude an agreement.
Speculation has now shifted from an extension to a conclusion of the trade war. Memorandums of understanding are being drafted in 6 key areas that include cyber theft, intellectual property, currency and non-tariff barriers. While there will be legs to this rally, it's important to understand that a final trade agreement could take many forms. The US could promise to keep tariffs where they are (with no further increases) and review them in a few months/years or they could abolish them completely. There’s also the possibility that a deal “might not happen at all” according to Trump but he’s motivated to get it done.
Fed Chairman Powell is headed to Capitol Hill Tuesday to testify before Congress. His prepared comments on the economy and monetary policy will be released at 9:45AM NY/14:45 GMT and they should drive EUR/USD, AUD/USD and NZD/USD higher. If the trade deal gives Powell a new sense of optimism, risk appetite will improve, lifting high-beta currencies. If he remain cautious, stresses the need for patience, talks about the downside risks to growth and the possibility of fewer rate hikes, the US dollar will fall, which should still be positive for EUR, AUD and NZD. USD/JPY on the other hand will rise on optimism and fall on pessimism. EUR/USD ended the day at its highest level in more than 2 weeks but it remains firmly within its recent range. A move above 1.1390 is needed for the upside breakout to be real.
Sterling extended its gains above 1.31 versus the U.S. dollar after Prime Minister May delayed the “meaningful vote” to March 12, two weeks before they are scheduled to leave the European Union. This decision should have been negative for the currency but investors believe that by running down the clock, May leaves Parliament with no choice but to take over the Brexit process. She’ll have to request an extension of Article 50 or risk being shut out of negotiations. There’s talk that the European Commission could consider a 2-year delay and the Labour party is moving toward supporting a second referendum. Both choices are better than the current course, which is what investors are banking on.
The Canadian dollar was the only major currency that failed to benefit from the risk rally and oil prices are to blame. Crude tumbled more than 3% after a tweet from President Trump that simply said “Oil prices getting too high. OPEC, please relax and take it easy. World cannot take a price hike – fragile!” While there was no specific threat, investors feared that the president, who hasn’t tweeted about oil since December, is returning to his criticism of the alliance. It is also a nudge to Saudi Arabia who previously raised output on the back of pressure from the Trump Administration
*************************************************** END OF ARTICLE ****************************************************************************************************
SOURCE: www.investing.com
With FED chairman speaking this week, the USD is in for a shakeout which inturn would affect other currencies specifically speaking about AUD, JPY, NZD and EURO.
On a technical perspective of this trade analysis, the price on the daily TF is forming a rough head and shoulders pattern and the neckline is just seem to be present above the weekly 50 EMA. Shall the neckline break it would also be favorable the price breaks the weekly 50 EMA in the process with convincing fashion. The next support based on the Monthly charts lies at the 1.55 crucial level where the price is expected to be headed!
Based on all the fundamental analysis and technical ones shall the criteria meet i will likely wait for the neckline to break and retest before making any suitable entry. However we are also keeping an eye out for the AUDUSD pair as these two are kind of correlated which makes executing two trades a risky scenario. Whichever pair gives the best outcome i will possibly take either one of these AUD related pair trade!
This just represents my analysis on this pair, shall there be a suitable trade criteria i will post them in a new thread. cheers

SINO-US TRADE DEAL COULD MAKE AUSSIE REACH 0.73000 LEVEL!With Tariffs delayed which were suppose to come into effect on 1st march and renewed optimism that a trade deal could be reached soon between the world two largest economy, Aussie could be in for a benefit! China usually imports many of its raw material from Australia and if a trade deal can be reached soon (which is a likely scenario) aussie dollar could make a jump towards the crucial 0.73000 level where weekly 50 EMA is present.
As of right now the AUD has started the week on strong positive note gaining more than 0.64% of its value since Trump announced that the tariffs that were suppose to come into effect would be delayed and he also signaled that a trade deal would be achieved soon. If a deal is achieved, Chinese economy will slowly start to pick up pace again and thereby taking the AUD higher against the USD and other currencies.
However do NOT be fooled thinking that this may make the AUD rally! The AUD faces a lot of resistance on its path to uptrend not only technically but fundamentally too. On a fundamental aspect even though a trade deal could be struck soon, other factors are not in the AUD favor such as the RBA cutting its forecast on the rates and a chinese region banning coal imports from Australia, even certain economic indicators are showing results below the forecast. Taking all this fundamental aspects into consideration, the AUD will likely not make a big move to the upside but a rather short one and after that it remains to be seen what will happen to this pair. Overall market sentiment are bearish on both AUD and NZD dollars!
Now coming to the technical aspect on this pair, the daily chart shows a descending trendline being respected on numerous occasions, a sustained break above this trendline would mean the price will likely target the 0.73000 level where the weekly 50 EMA is present. So for now its best to wait for the price to break the trendline and retest certain levels before we can make our move!
0.70000 level is a crucial support if viewed on the monthly charts and since the flash crash happened that day numerous support levels were tested and rejected, projecting that the AUD buyers are present at those levels. For now if the trendline is broken then we will wait for it to break convincingly and retrace slightly so we can make a move.
shall there be any updates i would provide them in a new thread. this post just represents My personal outlook on this current pair. cheers

Emerging Market ETFThis ETF looks to continue to boom especially after the China and US have optimistic trade talks. Mainly China companies inside this ETF.

DOLLAR INDEX (DXY) Showing Signs of Exhaustion! With the crucial 97.00 area rejected and acting as a concrete resistance, DXY is showing signs of exhaustion both technically and fundamentally!
Looking at the fundamental picture, the FED has already signaled that its pausing its rate hike, moreover the trade war among the two largest economies in the world is just putting to much pressure on the greenback. FED signaled the economy is stable however the signs of slight economic slowdown are already visible with china imposing high tariffs on US goods. Today's core durable order and Philadelphia manufacturing index both came below expectations and as we wait for the existing home sales report later today it would not be a surprise if the reading is below expectation. Even considering the future economic calendar releases most of the readings will likely be below the forecast as well considering if a trade deal has not been reached. In short at the moment its not looking that good for the greenback at the moment fundamentally!
Looking at the technical aspects, the crucial 97.000 level was the key resistance that was rejected and now if the trendline is violated the price might head towards the next support that lies in the 93.00 region.
If the trendline is violated we should be prepared for a big drop in the DXY. Certain pairs that are highly correlated with the DXY such as EURUSD can be traded with added confluence.

ES_F Not looking good with the trade news coming out...I've scaled out of some equities. This isn't looking good at all, first target for shorts is previous low.

USDNOK BULLISH TRADE IDEAHi Traders,
The USDNOK reversed from a weekly support level and broke out of descending trendline and resistance level.
.
Price seems to be making an ABC zigzag corrective pattern which is likely to attract buyers at the 38.2 Fib ratio that lined up with swing level and moving averages.
.
We will wait for the completion of the corrective structure and then look for buy entry once the price breaks the blue CTL.
.
According to Elliot Wave principle, when wave (i) is extended, wave (iii) through to (v) is often 61.8 - 78.6% relative to the size of wave (i). So the price has the potential to move up towards the 61.8 - 78.6 Fib Extension level that lined up with a key resistance as planned on the chart.
.
Thanks for reading!
Veejahbee.

EURGBP BEARISH TRADE SETUPHi Traders,
The EURGBP reversed from a resistance level and broke below a key support level with an impulsive move labeled wave A "blue."
.
The price has completed a bearish ABC zigzag corrective pattern which retested the broken support that lined up with 38.2 - 50.0 Fib ratio and moving averages, labeled wave B "blue."
.
Considering that price has broken out of the blue CTL, and Friday's candle closed as a bearish engulfing bar at our area of interest, this setup has met our criteria for short order.
.
The price has the potential to move downward toward the 61.8 and 1.0 Fib Extension to complete the wave C of (Y) as planned on the chart.
.
I wish you all a fantastic start to the week.
.
Veejahbee.

GBPJPY BULLISH CONTINUATION SETUPHi traders,
The GBPJPY seems to have completed ABC zigzag corrective chart pattern, which could indicate a continuation of the uptrend.
.
GBPJPY bearish correction is probably a wave (iv) of a larger impulsive wave 1.
Considering that the price has breaks above the blue CTL after rejecting a swing level that lined up with moving averages and 38.2 Fib ratio; we have a valid reason to buy this pair.
.
Price has the potential to move higher and complete impulsive wave (v) "blue." The main target is -27.0 FE that lined up with descending channel resistance as projected on the chart.
.
Thanks for reading!

USDCHF looking to Break High Or Low. All eyes on Trade Talks!As the trade talks begin today among the two largest economies in the world, this pair is looking at the outcome carefully. Any decision either good or bad can make this pair trade sharply. The Franc and JPY Often act as safe haven FX pairs when traders apply the risk aversion effect. GOLD also acts as a safe haven commodity too, but since switzerland's FRANC is backed by more than 75% of GOLD reserves its no surprise that FRANC acts as a stable currency.
Looking at the current chart of this pair the price seems to be rangebound in a weekly timeframe. the current price action seems to be forming an ascending trendline, furthermore as we head up a crucial resistance of 1.00500 can be found and should the pair break the resistance we can opt to go LONG and should it break the trendline we can opt to go SHORT. I feel the outcome of any of the above scenarios is purely based on the trade talks but i feel more confident in taking this pair SHORT as it would be backed by the claims that the FED will likely not meet the rate raising target this year.
Nevertheless, this a swing trade opportunity that i am watching closely and shall there be any developments i will be posting the update under this thread. I will also be looking to day trade this pair but i will need the trade talks to settle down and give clear direction as to where this pair is headed. be mindful that this week we also have the FED minute meeting release which might hide some important clues

MSFT: Bear Market Risk Increases on Chinese Manufacturing NewsMicrosoft has been under heavy distribution and has begun a risk of top formation. The markets opened with a downside gap this morning due to Chinese markets imploding. This is a high risk factor for a potential bear market catalyst. Any US company that has a high revenue source from China is at risk of serious downside runs during such a crisis and for as long as the Trade Wars between these two nations continue. Sell Shorters will use this gap at open as a level to buy to cover for profits. IF the retail crowd does panic quickly, then it will be a rout.
For now MSFT is at risk of breaking to the downside. The Top formation is a Rounding Top, which is harder for most technical traders to recognize before completion. The support is strong between $86 – 98, which was a trading range from earlier this year. The stronger volume on down weeks and declining Accumulation/Distribution indicator show heavy large-lot selling over the past couple of months. The stock’s bounce risk levels are black lines on this weekly chart.

SP500 at tipping pointThere's been a lot of FUD going on in the market lately. Multiple days of several hundred point drops will do that.
Ignore the FUD, and read the tea leaves. Here's what the charts say to me:
SP500 remains in the bull wave channel which began nearly 10 years ago in March 2009. As long as the price remains in this channel, the bull market continues.
Red line is long term support. Blue is long term resistance.
Failure of the red support is bad. If 2940 is in fact the market high, then 2460 is the first short target and will likely be the first domino all the way down to 1580 -- perhaps even 1140-1200 if we retrace in a similar fashion to 2008/2009.
Right now, I think the price is more likely to go back up than down, but should the red line fail, GTFO.


AUDUSD (Looks Like a Bull, Smells like a bear)Whats up a traders -
We're sideways on this one, not quite sure.
Have a look at the explanation on the chart.
Comments are welcome.

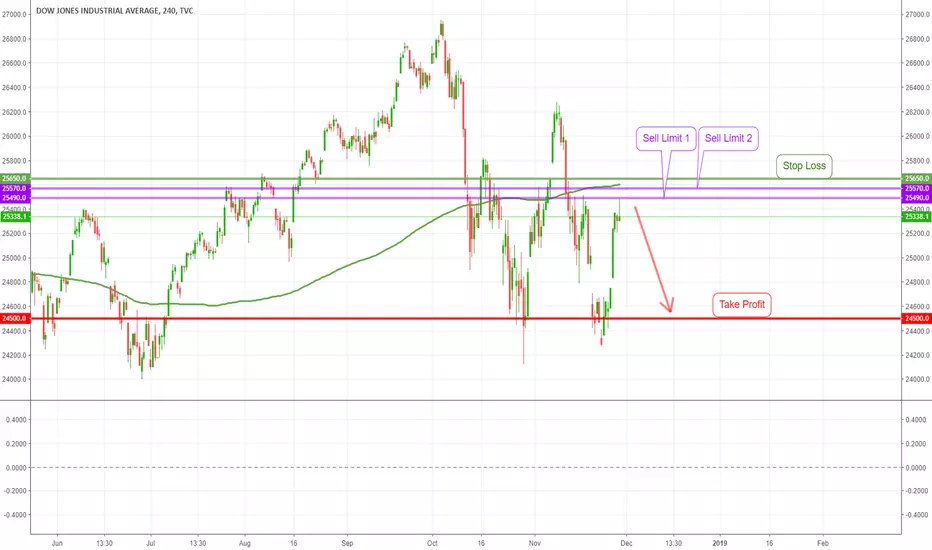
DOW JONES SELL LIMIT 1st Sell Limit: 25490
2nd Sell Limit: 25570
Take Profit: 24500
Stop Loss: 25570
Happy Trading!