EURUSD Holds Below 3-Year HighsAs the U.S. dollar lingers near 3-year lows, the euro is testing 3-year highs—holding critical resistance zone at 1.1520.
This level marks a pivotal point, further challenging the broader downtrend that has shaped the EUR/USD chart since 2008.
A confirmed breakout above 1.1520 could open the door to further upside toward 1.17 and 1.20, revisiting the highs last seen in 2021.
Should the euro fail to break higher and begin to retreat, key support levels to watch include 1.1270, 1.1140, 1.1000, and 1.0920.
A potential pullback may be amplified if overbought momentum begins to fade—particularly as the current 3-day RSI levels echo those last observed in 2020.
Written by Razan Hilal, CMT
Tradewar

Crude Oil Holds at Key ResistanceFollowing a sharp rebound from the $55 low—mirroring broader market strength and gains in U.S. indices—oil is now hovering near a key resistance level at $64. Meanwhile, major U.S. indices remain below their respective resistance zones, awaiting confirmation of further uptrends.
A sustained break and hold above $64 could open the door for additional upside toward $66 and $70.
On the downside, if gains fail to hold and prices slip back below $64, support levels to watch are $60, $58, and $55.
A decisive break below $55 may trigger a steeper decline, potentially driving oil prices back toward the $49 per barrel region.
Written by Razan Hilal, CMT
USDCAD Forecast: Key Levels in SightFollowing softer Canadian CPI data, the Bank of Canada held interest rates steady at 2.75%, sending USDCAD toward the 1.3820 support level — an area that aligns with the November 2024 lows and a key resistance zone extending back to the highs of September 2022.
The 1.3820 low aligns with the 0.272 Fibonacci retracement of the uptrend from May 2021 to January 2025. This support also coincides with RSI levels not seen since 2021.
A sustained hold and reversal from this zone may push the pair toward 1.4040, 1.4150, 1.4350, and eventually 1.4500. On the downside, a firm break below 1.3820 could open losses toward 1.3670, 1.3570,1.3430, and 1,3270.
Written by Razan Hilal, CMT

Gold Price Rollercoaster: Is the Rally Just Beginning?The gold price has had a pretty crazy six days, jumping from 3,014 USD on April 9, 2025, to 3,357 USD on April 17 – that’s a solid 11%+ gain. So, what’s going on now? Is the gold rally over, or could we see even more upside? Let’s break it down.
🔥 What’s driving the gold price?
The big reason behind the recent surge is the trade war between the US and China. Trump has slapped new tariffs on imports from China, Mexico, and Canada, which has shaken things up in the markets. The Fed has also warned that these tariffs are bigger than expected, and could slow down growth and increase inflation.
When things get uncertain, investors tend to rush to safe havens like gold, and that’s exactly what’s happening right now. The demand for gold is up, and so is the price.
📉 What does the ECB rate cut mean?
The European Central Bank (ECB) has lowered interest rates by 0.25% today, dropping from 4.5% to 4.25%. They’re trying to help the economy out and ease inflation.
Lower rates mean fixed-income investments aren’t as attractive, which makes gold a better option. But, the US Fed has made it clear they won’t cut rates before June 2025, which could strengthen the US dollar and make gold a little less appealing.
🕊️ What if there’s a trade deal?
Now, imagine there’s a breakthrough – a trade deal, fairer tariffs, and everyone’s calming down. That could change things for gold:
📉 Less risk = less demand for gold: If things chill out, less capital will flow into gold.
💵 Stronger Dollar?: A trade deal could make the US dollar stronger, which isn’t necessarily great for gold. But Trump has made it clear that he doesn't want a strong dollar, since it makes US goods less competitive abroad. Even if the dollar does strengthen, it might put pressure on gold since it becomes more expensive for people using other currencies.
🔁 Money shifts: If things get calmer, investors might move away from gold and back into stocks or bonds for better returns.
So, a deal could definitely slow down or even end this gold rally.
🧭 What does this mean for investors?
Daytraders
For day traders, the current ups and downs can offer some good opportunities, but they also come with risks. The markets are super sensitive to news about the trade war and rate cuts. Quick gains are possible, but you’ve got to be careful. If a trade deal happens, expect the classic “Sell the News” scenario where the market cools off.
Medium-Term Investors (1 Month)
Over the next few weeks, we’ll see if more trade war news or central bank decisions impact the gold price. The rally could keep going, but nothing is guaranteed. If you’re in it for the medium-term, keep your positions flexible and manage risk closely. A trade deal could be bad news for gold, though.
Long-Term Investors
Long-term, gold is still a great way to hedge against inflation and geopolitical risks. The current trends could help gold prices, but keep in mind there could be some ups and downs. If the price drops due to a trade deal, it might actually be a good opportunity to buy.
📊 The Bottom Line
Gold has been on a hot streak lately, driven by the trade war and central bank moves. Whether this rally continues or cools down depends on what happens next. A trade deal could bring a correction. So, keep an eye on things and adjust your strategy accordingly.
-------------------------------------------------------------------------
This is just my personal market idea and not financial advice! 📢 Trading gold and other financial instruments carries risks – only invest what you can afford to lose. Always do your own analysis, use solid risk management, and trade responsibly.
Good luck and safe trading! 🚀📊

S&P 500 - Key Levels and April 7-11 Weekly Candle StructureApril 7-11 will easily be remembered in 2025 as one of the craziest weeks in modern history.
Intraday swings were face ripping all from a Monday "fake news" becoming Wednesday "real news" with the US pausing tariffs for 90 days
5500 major resistance on S&P
4800 major support on S&P
I believe the market will struggle to provide any clear direction in the coming weeks without some shift in narrative (for better or worse). I'm sure most traders are hoping for an optimistic tone but be prepared to be disappointed as the world's alliances and economies are being strained with massive uncertainty and angst.
There are trading opportunities in the short-term, but I'm not taking any major risks. If I can survive, the upside will be easier and a pleasant surprise.
I expect the weekly candles to dance inside the April 7-11 low and high levels and hopefully it provides some ventilation to a VIX > 30

EUR/USD Holds Steady Near 1.15000The EUR/USD has gained more than 4% over the past three trading sessions, with bullish momentum remaining strong, as markets fear that a continued escalation in the trade war may keep heavy selling pressure on the U.S. dollar. With tariff-related uncertainty persisting, the euro continues to attract capital fleeing the dollar in search of a temporary safe haven.
Bullish Trend
Currently, the most relevant formation on the chart is a short-term bullish trend, which began in early March. Price action has continued to show consistent upward momentum, moving steadily toward the next psychological resistance at 1.15000, which has further reinforced buying pressure in the near term.
However, it's important to note that the volatility seen in recent sessions has been significant, which could open the door to short-term corrective pullbacks.
RSI Indicator
The RSI line has started to oscillate above the overbought level at 70. Additionally, a relevant divergence has begun to emerge: while the RSI continues to post flat highs, the price of EUR/USD is printing higher highs.
These signals suggest a possible imbalance between buying and selling strength, indicating that a short-term correction could be on the horizon.
Key Levels to Watch:
1.15000: A tentative resistance level aligned with a key psychological threshold. Sustained bullish moves above this zone could strengthen the current upward bias and lead to a more pronounced uptrend.
1.11549: A nearby support level, which could act as the first zone of interest if a short-term correction unfolds.
1.09513: A key support area, representing the most important neutral zone tested in recent weeks. A break below this level could put the current bullish structure at risk.
By Julian Pineda, CFA – Market Analyst

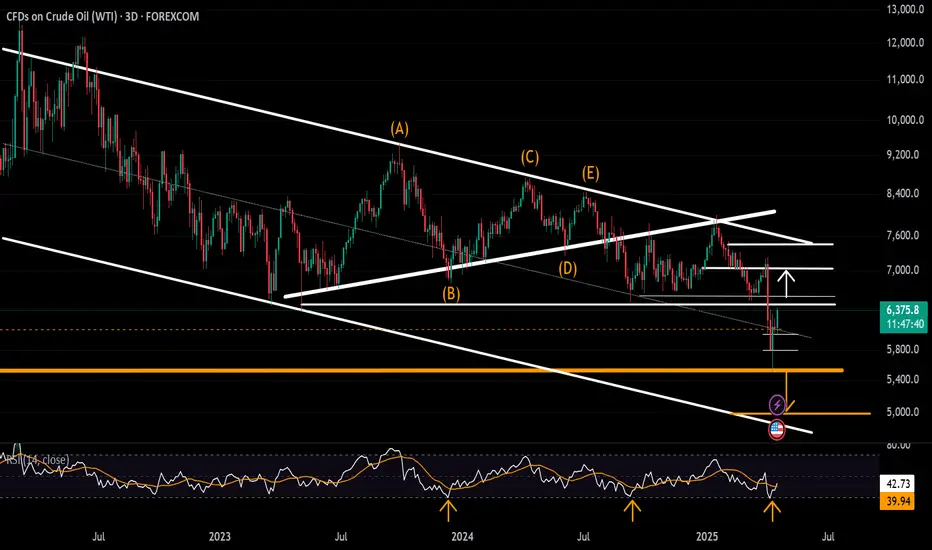
Crude Oil Holds Rebound Above $55Crude oil's sharp rebound from the $55 support—aligned with the 0.618 Fibonacci retracement of the 2020–2022 uptrend—faced immediate resistance at the long-standing support-turned-resistance zone around $63.80, established in 2021.
A decisive move above $63.80 may clear the way for further gains toward $66, $68, $69.60, and ultimately $73. On the downside, a drop below $58 would bring $55 back into focus.
A clean break below that level could trigger further downside toward $49 per barrel, which aligns with the lower boundary of crude oil's long-term uptrend.
With global powers competing for oil, key events this week include:
🔹 OPEC report amid tariffs and efforts to regain market share
🔹 US–China trade talks
🔹 Chinese GDP, IP, Retail Sales (Wed)
Written by Razan Hilal, CMT

Tata Motors at ₹600: Support Zone in Focus...
Tata Motors at Key Technical Support: A Long-Term Buying Opportunity..?
Tata Motors is currently trading near the ₹600 level, which marks a significant technical support zone. This level is important not only because of historical price action but also because it aligns with the 0.5 Fibonacci retracement level of the broader uptrend seen in recent months.
The ₹600 mark has acted as a strong support on the monthly chart, suggesting a potential reversal point for long-term investors looking for value entry. From a purely technical perspective, this level could provide a solid foundation for a possible bounce or even a continuation of the longer-term bullish trend.
However, it is important to note that while technical indicators may suggest an attractive entry point, Tata Motors remains subject to various fundamental factors that could drive volatility in the short to medium term. These include:
- JLR (Jaguar Land Rover) Sales Data
- Quarterly Earnings Results
- Global Tariff and Trade Policy News
These elements can significantly impact investor sentiment and stock performance, sometimes overriding technical signals.
Disclaimer: This analysis is based solely on technical chart patterns and should not be considered financial advice. Market conditions can change rapidly, and it’s crucial to conduct your research and consider fundamental factors before making any investment decisions.

Trump Tariffs - Trade War - High Volatility - Key LevelsEasy trading for 2025, right? Haha
We are seeing some of the wildest swings ever in the markets
Extreme intraday swings and volatility is getting everybody's attention
This video discusses all key levels and current seasonality
Hoping for the best and preparing for the worst

British pound keeps rolling as UK GDP shinesThe British pound is up sharply on Friday, extending its rally for a fourth straight day. In the European session, GBP/USD is trading at 1.3088, up 0.94% on the day. The pound has surged 2.9% since Monday.
UK GDP higher than expected February with a gain of 0.5% m/m. This followed a revised 0% reading in January and beat the market estimate of 0.1%. This was the fastest pace of growth since March 2024. Services, manufacturing and construction all recorded gains. For the three months to January, GDP expanded 0.6%, above the revised 0.3% gain in January and higher than the market estimate of 0.4%.
The strong GDP data is welcome news amid all the uncertainty created by US President Trump's tariff policy. The UK's largest trading partner is the US and the 10% tariffs on UK products will hurt the UK export sector (Trump has suspended an additional 10% tariff for 90 days).
Bank of England expected to lower rates in May
The turmoil in the financial markets and escalating trade tensions has the Bank of England worried. The markets have priced in a rate cut in May, betting that the BoE will ease policy in order to support the weak economy, even with inflation above the 2% target. The BoE kept rates unchanged in March and meets next on May 8.
The US-China trade war rose up a notch on Friday, as China announced it would raise tariffs on US goods to 125% from 84%. This move was in response to the US lifting tariffs on China by 125% this week, for a total tariff rate at 145%. The trade war will dampen China's economy and Goldman Sachs has lowered its 2025 GDP forecast for China to 4.0% from 4.5%.

USD/CHF drops to lowest since 2015The risk-off trade has just gathered pace. A few moments ago, gold hit a new record above $3175 as the dollar sold off, with the USD/CHF dropping to its weakest point since 2015 and stocks extending their drop on lingering trade war concerns.
With risk appetite fading once again, the USD/CHF could be heading down to 0.8000 handle from here, should the breakdown below the key 0.8330-0.8375 zone (now key resistance) holds.
Although the latest US inflation data came in weaker, it doesn't seem to be the main driver behind the dollar’s renewed decline — the greenback was already under pressure before the figures were released. The persistent uncertainty surrounding the trade war continues to weigh on sentiment, keeping the USD/CHF outlook tilted to the downside.
After yesterday’s BIG relief-driven rally, markets are back well in the red today, with the S&P some 6% lower at the time of writing. While Trump’s 90-day suspension of reciprocal tariffs sparked short-term optimism, the broader picture hasn't improved much. The 10% blanket tariff is still in effect, and cumulative duties on Chinese imports have climbed to a steep 125%. With Beijing likely to respond, the situation remains tense.
Investor caution lingers as the US struggles to secure meaningful trade deals with other key partners, including the EU.
Safe-haven flows into the Japanese yen and Swiss franc suggest that market sentiment remains shaky.
By Fawad Razaqzada, market analyst with FOREX.com

New Zealand's central bank expected to lower rates by a quarter-The New Zealand dollar has rebounded on Tuesday. NZD/USD is trading at 0.5615, up 1.3% on the day. This follows a 5% plunge over the past two days.
The Reserve Bank of New Zealand is widely expected to lower interest rates by a quarter-point at its rate meeting on Wednesday. The markets have priced in a quarter-point cut at 75% and a jumbo half-point cut at 25%. The RBNZ slashed rates by a half-point in February, a response to weak economic growth and an inflation rate of around 2%, the midpoint of its target band.
The market meltdown and escalation in trade tensions due to new US tariffs could force the RBNZ to lower rates faster and deeper than previously expected. There is massive uncertainty in the air and the central bank will have to re-evaluate inflation and growth expectations, given the tariff turmoil.
There is growing talk of a global recession, which would badly hurt New Zealand's export-reliant economy. China is New Zealand's largest trade partner and the escalating trade tensions between the US and China could turn into a New Zealand nightmare. China has imposed 34% reciprocal tariffs on the US, drawing a threat from President Trump that he will counter with a 50% tariff if the Chinese tariff is not removed.
The RBNZ is dealing with the tariff crisis without Governor Adrian Orr, who suddenly resigned last month in the middle of his five-year term. The government has appointed Christian Hawkesby as Governor for a six-month term, after serving as the acting governor after Orr resigned.

USDCNH Tests Key Pattern Resistance on PBOC’s Loose Yuan FixThe trade war between China and the U.S. is escalating, and the Chinese yuan is starting to feel the pressure. After the U.S. raised tariffs to a total of 54%, China responded with a 34% increase of its own. Now, Trump has threatened an additional 50% tariff hike if China doesn’t withdraw its retaliation.
It appears unlikely that either side will back down at this stage, and the trade war is set to intensify further.
In addition to retaliating, China is also preparing to defend its economy. According to several news reports, Beijing is planning to frontload stimulus measures aimed at boosting domestic consumption, subsidizing exporters to cushion the blow from reduced U.S. trade, and supporting stock market stability. The People’s Bank of China will likely play a central role in this effort, using tools such as rate adjustments and daily yuan fixings.
The latest yuan fixing came in above 7.20, the highest level since 2023. With this looser fixing and ongoing trade war pressure, USDCNH is pushing higher. The ascending triangle formation which typically breaks to the upside is also supporting bearish bets on the yuan.
If China proceeds with a small and controlled devaluation, as many expect, a breakout from this triangle pattern is likely.
The potential target for the breakout could align with one of the parallel lines of the lower boundary of the formation, which are currently around 7.61 and 7.75, and gradually rising. With time, a move toward 7.80 is well within reach by the end of the year.

Merck & Co. (NYSE: $MRK) Sets Up Q125 Earnings Call for April 24Merck & Co. (NYSE: NYSE:MRK ) will hold its Q1 2025 earnings call on April 24 at 9:00 a.m. ET. Company executives will present financial results and performance updates during the call.
As of April 4th, 2025, MRK closed at $81.47, down $4.92 (5.70%). The stock has declined steadily since peaking at $134 in June 2024.
In Q4 2024, Merck posted global sales of $15.6 billion, a 7% increase from the previous year. Sales growth stood at 9% when excluding foreign exchange effects. Full-year 2024 revenue reached $64.2 billion, a 7% increase over 2023. Human health sales grew 8%, driven mainly by oncology treatments.
KEYTRUDA remained the company’s top product with sales of $7.8 billion in Q4, rising 21%. WINREVAIR generated $200 million in sales, while new vaccine CAPVAXIVE added $50 million. The Animal Health division showed strong momentum, growing 13% year-over-year. Merck’s global reach extended to nearly 500 million people in 2024.
However, GARDASIL vaccine sales dropped 18% in Q4 due to lower demand in China. This led Merck to pause GARDASIL shipments to the region temporarily. Operating expenses for the quarter totaled $7.4 billion. The company reported a gross margin of 80.8%, up by 3.6 percentage points. Earnings per share came in at $1.72.
For 2025, Merck expects revenue between $64.1 billion and $65.6 billion. EPS guidance is set at $8.88 to $9.03, excluding foreign exchange impact. The Medicare Part D redesign could reduce revenue by about $400 million in 2025. This would affect WINREVAIR and other small molecule oncology drugs.
Technical Analysis
MRK stock is currently testing a major support level at $81.A confirmed breakdown at this critical level could push the stock lower. Price momentum and volume suggest a likely continuation of the bearish trend unless support holds. With the bearish pressure in place, the next support level lies at $70.
The weekly chart shows consistent lower highs and lower lows since June 2024. MRK has fallen nearly 65% from its peak of $134.
If the $81 current support holds, a short-term rebound is possible, with an immediate resistance target around $95. Reclaiming this level may signal early signs of a trend reversal. If a strong break at the $81 level is witnessed, the next target remains the $70 support.
The current trend favors sellers. One thing to watch closely is the April 24th, 2025, earnings call as performance updates may provide clarity on near-term price direction.

S&P 500 Records Largest Weekly Decline Since 2020The S&P 500 Index has suffered its steepest two-day drop since the pandemic crash in March 2020. On April 4th, 2025, the benchmark index closed at 5,074.08, down 322.44 points (5.97%). This marks a loss of $5.4 trillion in market value across just two sessions.
The sell-off followed comments from Federal Reserve Chair Jerome Powell. He warned that President Donald Trump’s new tariffs could lead to persistently higher inflation. All 11 sectors in the S&P 500 closed in the red. Only 14 stocks remained positive as Nvidia and Apple fell more than 7%, while Tesla dropped 10%.
The Nasdaq 100 Index plunged 6.1%, confirming a bear market after losing over 20% from its February peak. The rapid decline mirrors the speed seen during the 2020 COVID crash and the 2000 dot-com bust.
President Trump announced sweeping tariffs on U.S. imports on Wednesday. These include a 10% general tariff and higher rates on dozens of countries. China responded by imposing a 34% levy on American goods. The tit-for-tat measures triggered fears of a full-scale global trade war.
Global markets reacted sharply. Investors pulled out of stocks and moved into safer assets like government bonds. The two-day loss of $5 trillion on the S&P 500 set a new record, surpassing the $3.3 trillion loss during March 2020.
Rick Meckler, of Cherry Lane Investments, said the escalation is now deeper than many investors expected. The initial belief that tariffs were a negotiation tactic has now given way to serious market concerns.
Technical Analysis: Price Approaching Key Support Zones. Will They Hold?
The S&P 500 has shown a bearish trend since early 2025. Several weekly candles have closed bearish, confirming a strong downtrend. Currently, the index is trading lower toward a key ascending trendline near $4,930.
The $4,930 support level may offer short-term support. A bounce from here could see a brief recovery. However, the sentiment remains bearish without strong economic data or policy changes.
Further Downside Risk If Support Fails
Another horizontal support sits at $4,780. If both support levels fail, the index may fall toward the $4,500 psychological zone. This level is crucial as it marks a long-term support and potential reversal point.
At present, bearish momentum dominates, with much strength coming from trade war fears. Unless data shifts investor sentiment, the downtrend may persist.

Jaguar Land Rover Temporarily Halts U.S Shipments Amid TariffsJaguar Land Rover (JLR), owned by Tata Motors, has paused shipments to the U.S. market this April. The move follows a 25% import tax on vehicles imposed by U.S. President Donald Trump. JLR described the U.S. as a vital market and stated it is now adjusting to new trade rules with business partners.
The pause is a short-term step. The company aims to finalize longer-term strategies to manage the new tariffs. Analysts believe other British carmakers may soon follow this approach. Britain's auto sector faces pressure from falling domestic demand and the costly transition to electric vehicles.
David Bailey, a University of Birmingham professor, predicts more stoppages. He said automakers will reassess their plans amid rising costs and trade uncertainty. Recent data shows U.K. car production fell 13.9% last year to 779,584 units. Over 77% of these vehicles were exported.
The Society of Motor Manufacturers and Traders (SMMT) voiced concern. CEO Mike Hawes said the timing worsens an already challenging period. He urged swift trade talks to protect jobs and growth. The SMMT has stayed in regular contact with the U.K. government to seek solutions.
To soften the tariff’s impact, carmakers rushed to build inventories in the U.S. JLR was among them. U.K. car exports to the U.S. jumped 38.5% in Dec, 12.4% in January and 34.6% in February.
According to official figures, British automakers shipped £8.3 billion ($10.7 billion) worth of cars to the U.S. in the 12 months through September. Cars remain Britain’s largest goods export to the U.S. However, goods make up a smaller portion of overall trade. Services account for 68.2% of the £179.4 billion ($231.2 billion) in total U.K.-U.S. trade during the same period.
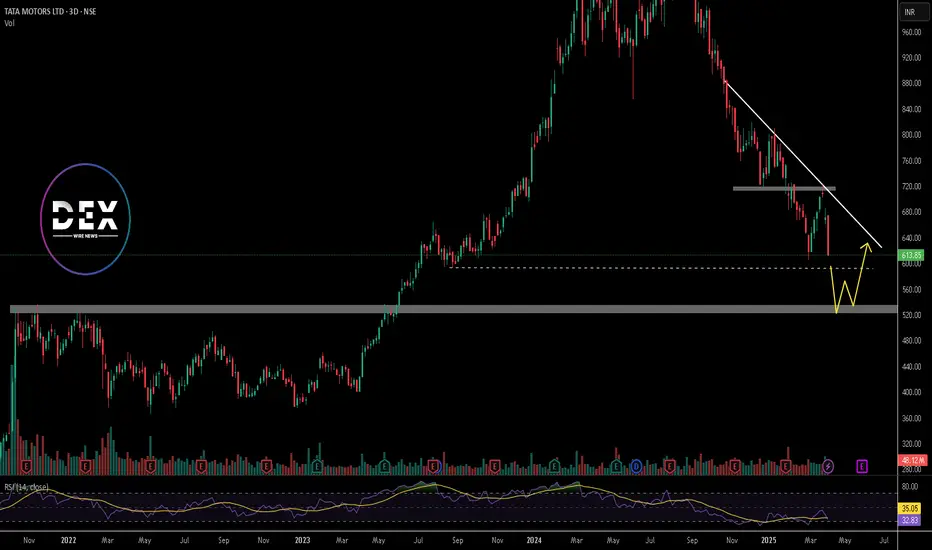
JLR is not independently listed. But looking at the parental company, Tata Motors (TATAMOTORS.BO) trades on India’s BSE. Its stock closed at INR 613.85 on April 4th, 2025 (6.15%).
Technical Analysis: Bearish Momentum Since July 2024 Highs
Tata Motors stock peaked at INR 1179 in July 2024. Since then, it has shown a sharp downtrend. It has surged in bearish momentum and has been breaking major support levels. In late January 2025, the price broke below key support at INR 715 and has retested it in March 2025. Currently, it trades lower and is approaching the next support at around INR 591.
If this level fails to hold, the price may fall to INR 525. The downtrend has persisted for months, indicating sustained bearish pressure in the market. The weekly RSI now reads 32, derived from deep bearish sentiment. If the RSI dips further, it may signal oversold conditions. However, the current momentum suggests the stock could still drop.
If INR 591 holds, a short-term bounce may follow, with a short-term recovery phase that could push the stock toward the descending trendline. Still, bears maintain control for now, and a break below 591 may accelerate further losses.
NFP beats but focus is fixated on trade warToday’s NFP report was NEVER going to take much attention away from the trade war – and so it has proved with mixed readings. US rates were being priced lower amid deteriorating trade war risks, which remains the main focal point. Powell is up next, while CPI, PPI and UoM surveys all on tap next week.
The nonfarm payrolls data beat expectations, with a headline print of 228K. Most of those gains were in full-time jobs. But the unemployment rate ticked higher to 4.2% from 4.1% unexpectedly. Market’s focus is on trade war, and rightly so. They were never going to go wild on this NFP release.
Average earnings came in as expected, rising 0.3% on a month-over-month basis, but the prior month weas revised lower a tad. Year-over-year rate was weaker 3.8% vs. 4.0%. Nothing to get too excited over, but potentially good news as far as inflation is concerned.
By Fawad Razaqzada, market analyst with FOREX.com

The Trade War Strikes Back: Market Reeling from Trump’s Tariff MThe markets are not taking Trump’s new round of tariffs lightly.
As the S&P 500 dips sharply, investors are reacting to the growing tension between the U.S. and China over trade policy. The new tariffs have ignited fears of a prolonged trade war, sending shockwaves through tech-heavy sectors and dragging major names like NASDAQ:NVDA , NASDAQ:MSFT , NASDAQ:AAPL , and NASDAQ:AMZN deep into the red.
📉 What we're seeing:
SP500 is breaking recent support with heavy volume.
Tech sector is leading the sell-off, especially chipmakers and global exporters.
Uncertainty is pushing investors toward safety, further increasing volatility.
🧠 Key takeaway: This is more than a dip—it’s policy risk priced in real time. Until there's clarity, traders should prepare for more erratic moves. Short-term sentiment has clearly flipped bearish.
💬 Are you buying the fear or staying out of the storm?

USOIL: Key Levels and Bullish Prospects Amid Trade War ConcernsGood morning Traders,
Trust you are doing great.
Kindly go through my analysis of USOIL.
USOIL is currently experiencing market imbalance due to the nature of its opening range, following a gap-down decline last night in response to trade war concerns that have fueled recession fears. The price dropped from its weekly high of 72.22 to a key support zone at 69.00, which is near the week's low. As we anticipate the release of the ISM Services PMI at 3 PM GMT+1, I expect the demand zone to hold, driving the price higher—initially to fill the gap and subsequently toward the 71.35 region. Furthermore, this outlook is strengthened by the formation of a bullish Bat pattern on the M30 chart.
The key levels I will be monitoring for potential price action include the previous week's high at 70.10, the five-week high at 70.62, and the 71.35 region. These areas represent significant resistance levels that could be tested as price moves upward. A break below 68.80 will invalidate this outlook.
Cheers and Happy trading.

UK inflation cools more than expected, GBP/USD loses groundUK inflation for February rose 2.8% y/y, below the market esti mate of 2.9%. This was lower than the 3% gain in January. The main contribution to the drop in inflation was lower prices for clothing and housing. On a monthly basis, CPI rose 0.4%, up from 0.1% in January but lower than the market estimate of 0.5%. Core CPI also eased, falling from 3.7% to 3.5%.
The drop in inflation is good news, but the Bank of England remains concerned about the upside risk of inflation. Services inflation, which has been sticky, was unchanged at 5%.
The BoE will consider a rate cut at the next meeting in May, but will be monitoring the effects of increased employer taxes starting in April as well as today's Spring Statement.
At last week's meeting, the BoE expressed concern over worsening "global trade policy uncertainty" and pointedly mentioned US tariffs. The Trump administration's new trade policy has raised trade tensions and a global trade war would hurt growth and boost inflation.
The slight drop in inflation is also good news for Finance Minister Rachel Reeves, who is delivered the budget update earlier today. The update did not contain any further tax increases and announced deep spending cuts. Borrrowing a phrase from the Bank of England at last week's meeting, Reeves said "increased global uncertainty" had increased borrowing costs and led to economic instability.
GBP/USD has pushed below support at 1.2940. The next support level is 1.2864
There is resistance at 1.2940 and 1.2991

Gold Trend for Today: Likely to hit its Support area 3000-2980Wednesday, March 26, 2025, with a specific scenario based on your support level at 2980 and the prior context of resistance at 3035–3060 and downside targets at 3000 and 2960. I’ll outline two plausible scenarios—a bounce at 2980 and a break below 2980—to give you a clear picture of what might unfold today. Projecting from a hypothetical opening near $3,020

Recap: Weekly Trade Plan March 10th, 2025CME_MINI:ES1!
In this TradingView blog, we will recap our trade plan posted on March 10th, 2025.
Please note that this is a recap, and since then, we have also published our updated price map and weekly plan for the current week. Today is also the Federal Reserve's decision day.
Here is our updated price map from the weekly plan published on March 10th, 2025:
Our updated price map for ES Futures
Key Levels:
• Important Level to reclaim if no correction: 5795.25 - 5800
• Key LVN: 5738 - 5696
• Mid 2024 range: 5574.50
• Key Support: 5567.25 - 5528.75
• 2024-YTD mCVAL: 5449.25
• 2022 CVAH: 5280.25
It is important to note that when we provide our thoughts and reasoning for the levels we map in our recap, we have the benefit of hindsight. Likewise, when we publish our weekly trading plan and share our thoughts at the start of the week, we are anticipating potential market movements on the hard right edge. This is where randomness and uncertainty are key points.
If we were to rank our process chronologically, this is how we note the importance of each component that makes up our plan.
1. Big Picture
2. Key Levels/Price Map
3. Scenarios
Our big picture is based on how we view the global macroeconomic and geopolitical landscape.
Key levels are mapped utilizing our methodology considering market auction theory and volume profiling. Note how our key level, 'Mid-range 2024', on higher time frame provided support.
At times you may see two scenarios, at other times three. Scenarios are just an anticipation which a trader should adjust should any new information come to light. Although you may note that our scenarios play out mostly from reviewing our blogs. Our aim is to help you create a process for yourself. Note how we anticipated near-mirroring price action for the week, though our reasoning was influenced by higher inflation data. However, the inflation reading came in lower than expected.
Fast forward to today, all eyes are now on the Federal Reserve’s rate decision, SEP, and the FOMC press conference scheduled for later today.

Gold Forecast: Key Levels Above $3,000Gold remains persistent in targeting its inverted head and shoulders pattern on the daily timeframe, eyeing the 3,040-resistance.
However, monthly overbought conditions—seen in 2024, 2020, and 2011—raise caution for potential sharp reversals.
• In 2011, an overbought RSI led to a nearly 900-point retracement
• In 2020, a similar overbought condition resulted in a nearly 450-point decline
• In November 2024, another overbought reading triggered a nearly 250-point drop
• Now, gold has once again reached these overbought levels, raising caution for a potential momentum recharge.
Key Events:
🔹Israel-Gaza tensions escalate as the 2-month ceasefire ends
🔹Trump and Putin negotiate a ceasefire with #Ukraine
🔹The US Dollar weakens amid trade war risks, with focus on Wednesday’s FOMC for the long-term outlook
Key Levels:
🔺Above 3,040: The trend could extend to 3,080
🔻Below 3,040: A reversal may test 3,000, 2,955, 2,930, and 2,900
- Razan Hilal, CMT
