USDCAD Trading PlanThe fundamentals that move the Canadian Dollar the past week or so were the updates on the NAFTA deal. If a deal struck, Canadian will definitely strengthen. However, the Commodity Market is an important catalyst as well specifically Oil. US-China Trade war somewhat affecting market sentiment and the energy market is no different. The market sentiment at the moment is fragile.
Having said that though, technically we have setups and if the market players decided to dump their CAD longs that I would hope will be illustrated in the chart as a bullish engulfing candle, then I will be a CAD Bull. Should there be an update of the NAFTA deal specifically hinting or confirming a NAFTA deal will be struck, I will short the pair and target according to the daily range.
Tradewar

US 30 in Complex ABC Correction WaveThis is a complex ABC correction coming off the August highs. Did not quite get to the Gartley Fibo at 26268, but within 100 pts of it for Fibo 1.55 will have to do.
There is a clear corrective 5 wave impulse evident in the A down leg, which is an organized, complex actionary impulse (labeled 1-2-3-4-5). This is not like the WXY pattern we saw in early August, it's true corrective trend actionary impulse and will likely carry index to significantly lower levels. This represents early technical breakdown.
We are near the end of countertrend reactionary B wave, which challenged Fibo 0.786 and then again came up to 0.618 before falling back.
This is a bull trap reaction wave.
Most recently, thanks to the Donald, a third rally attempt Friday to reclaim the highs was crushed. Thanks be to Trumptweets!
Given the constant tweeting, ongoing trade uncertainty and most importantly, cash outflows from mutual funds as parents return from vacation and withdraw assets to pay for prep schools and new cars for their college kids, it seems unlikely the markets will rally high enough to challenge the August low-volume highs.
It's no secret; people take their money out of the markets in September because they want to spend it. Real simple- seasonality.
And what better time to cash out than at the alltime high?!
'A' wave carried Dow -362; B retraced 224 pts at Fibo 0.618; C will be rough, at least as deep as A length, quite possibly 1.618xA = -586, as low as index 25,335 (target zone).
Look for a weak rally attempt early in the week of 10 Sep; before tweet Friday a rally was starting up and it is likely the bulls will try again once more.
Look for H&S and ascending wedges as the market struggles to regain higher price levels to enter shorts. Short entry above 26000 will likely be profitable.
As always, I post these opinions purely for speculative amusement and education, this does not in any way constitute investment advice;
trade at your own risk!
Good luck!

S&P PlaytimeS&P has retraced from all-time high back to breakout. Current options position is (slightly) net short but approaching 0 deltas and considering going net long with some shorter dated end of month calls. Also short on UVXY just in case we chop around for a while.
Lots of potentially juicy decisions and policies to look out for right now:
-US-China tradewar updates (200 billion or nah)
-US Federal Interest rate decision end of September (postponement of hikes could indicate fed worry over trade war's negative effect on US economy)
-NAFTA negotiation result eh

NZD Battered by Strong USD, Trade ConcernsNZDUSD has extended its losses for the sixth day in a row, touching key levels in the 0.65’s. A strong US dollar and US/China trade concerns have both spilled over into NZD. There are many bearish signs, and if we break through the 0.65’s, there is a vacuum zone to the 0.62’s, which we haven’t seen since 2015.
At the time of this writing, NZDUSD was trading at 0.6549.
Levels from above will provide resistance, including:
0.6727 from highs and lows over the past 14 periods
0.6851 from highs and lows over the past 30 periods
0.7061 from highs and lows
Levels from below will provide support, including:
0.6547 from highs and lows over the past 14 periods
As for Technical Analysis we have the following. Volatility has narrowed a bit but may continue more before a breakout. The RSI indicator suggests that we are in a bear trend, but not oversold yet. The MACD is above the signal line, but not by too much, suggesting that we are in a bull trend which may continue. NZDUSD is below the 50 period SMA, indicating a bear trend. The ADX indicator suggests a bear trend, at 30.
We have some room until we reach lower bound of the Kovach Reversals Indicator at 0.6535. We are likely to find resistance at the central moving average of the KRI at 0.6659.
Daily Scores: Bull Score: 1 Bear Score: 3 Ranging Score: 0
NZDUSD intraday seems to be ranging, clinging on for dear life at the immediate moment after taking a beating the past couple days.
Levels from above include:
0.6562 from gaps
0.6592 from sma 50
0.6650 from gaps
0.6702 from gaps
0.6721 from highs and lows over the past 100 periods
Levels from below include:
0.6542 from highs and lows over the past 14 periods
Technical analysis for NZDUSD intraday is as follows. Volatility has consolidated slightly. The RSI indicator suggests that we are in a bear trend, but not oversold yet. The MACD suggests that we are in a bullish phase but not overbought yet. NZDUSD intraday is under the 50 period SMA, which is currently at 0.6592, indicating bearishness. Additionally, NZDUSD intraday is below the 100 period SMA, which indicates a bear trend, but not oversold yet. Finally, the 50 period SMA is about on par with the 100 period SMA which suggests we are ranging. The ADX indicator, at a value of 37 observes a modest bear trend.
We are below the central moving average of the Kovach Reversals Indicator at 0.6571, and fairly close to it. If we lose momentum, we'll have support from the lower bound of the KRI at 0.6524.
Intraday Scores: Bull Score: 1 Bear Score: 4 Ranging Score: 1

Short USDCNHHead and shoulders for USDCNH forming (Head @ 6.9500 and Shoulders at 6.9000), with Take Profit @ 6.6000 and Stop Loss @ 6.8520.
People's Bank of China has announced a change to Yuan policy to keep currency steady and restrain the depreciation to downplay speculation on a devaluation of the currency due to US-China trade war. In fact, China may be looking at appreciation her currency to appease US.

EURUSD and the Big Bear Flag 2nd TryI thought we are gonna get a reversal with the huge bid upon tagging the 200 weekly MA but so far its just retesting the breakout
Entry: 1.15665
Stop: 1.7459
Target: 1.06670

USDCHF (Long)Whats up Guys,
All of the information is on the chart - be sure to hover over the Note for fundamental analysis.
Ten Likes and I will update the chart
Intelligent disagreement welcome
Good Luck - See you on the trading floors
#Crypto #BTC #cryptocurrency #forex #USDCHF
-Nix

USD/CNH Shooting star reversal!#USD_CNH just formed #Bearish #ShootingStar reversal candle on the #Weekly timeframe with a long wick that implies for a reversal signal for a wave of short positions coming to drag spot PA from 6.85 to our TP targets and key support levels at 6.70 & 6.58!
While #CNH #Renminbi appreciating against #Greenback , #GOLD #XAU_USD will accelerate to the upside to gain some short-term #Bullish momentum to hover around 1195 & 1205

Are there buyers yet?If there going to be buyers , this is where they are supposed to turn up. I like dealing with facts and the only fact is , sellers are currently in control of this market. We need a significant excursion on the upside or downside to tell us what to do next. Let price decide.

Talk about goldThese days the seizure has grown in the global market
It's not easy to look at market behaviors
But traders should deal with caution in global markets
According to my predictions
I was expecting this That's the price of golden glove Under $ 1,200 And many did not believe
In this price range There may be strange things
According to the psychology of gold prices in the global market
There is no definite opinion
My theory is these days for the price of gold in the world
In August 2018 gold be move range in the price 1175 to 1150 to swing
But traders should wait for next month in september
Considering the limit loss
Expecting that
if gold break down price of 1150 its going for two month or one month under 1100
but if gold support from 1150 expect gold a little rising with slow time and month to 1200 and 1300
However, traders must be in a deal on condition that they comply with the limitation
i also trying more publishing about gold update
be good luck
If want donations
Ways to pay:
Bitcoin : 3Fu1Uec5JZBcWYqwUGa1eUHYTxAHXG96DY
ETH : 0x18b5294006b30f940c107268147b84ffe29dc0ce
Bitcoincash BCH : bitcoincash:qpxdq93uk9tjx73ukvuavqmdejzk2pzc55nlzlk3jk
XMR Monero : 49xuiff58xo3EMtcJLJjCLcubLi8FPyb57b3ccwAdbkg3mtXoUHu58ejXqrT3anyZ22j7DEE74GkbVcQFyH2nNiC3bnyC3d
XVG Verg coin : DKQ2SjmRC3msYHLPA9hKSTjh2xcYyyMLUg
ZEC Zcash : t1dM3n21YtrtnNrTfHCi8aKVy6ZEucGP5XB

Selling NZDJPY if it gets near trendlineThe yen pairs appear to be moving higher despite an increase in risk to trade in the global markets. Sentiment appears to be holding up, perhaps to do with the good economic data we are receiving at the moment, however, in recent trading days we have had a lot of trade war noise. The US seems to be serious about the next $200bn of tariffs against China and that must have a negative effect. The indices look like they might be turning lower which would normally drag the yen pairs down but that dynamic is not playing out. Should the trade war noise start to turn into some hard facts and data about reduced trade then we can expect to see a more significant fall in the indices and a possible flight to safety that will drag the yen pairs lower and boost assets like Gold. Of all the currencies NZD appears to have the weakest fundamental backing with a dovish central bank, falling export prices (especially dairy) and an export-driven economy that needs good global trade to survive.
My preferred option in a risk-off scenario is to sell NZDJPY, the technical situation looks quite strong, we have a clear downward trend with a series of lower lows and lower highs marked by the orange trendline and no real resistance for some time marked by the red line. At the moment NZDJPY is bouncing from a recent low and it appears to be trading out a three wave bounce, the prefered scenario for wave traders as it gives a target for the end of the bounce. In this case, the target is right at the trendline where a turn lower might be expected.
The plan is as follows:- If risk sentiment starts to fall away (more trade war talk, indices moving lower, gold moving higher) and the current NZDJPY bounce continues in three waves I will sell it somewhere near the trendline risking 2% of equity hoping for a risk reward of 3:1

Planning for Friday, buying the USDTRYTomorrow has some potentially market-moving news. It is the first Friday of the month which means we get the usual raft of data from the US, the headline is the NFP figure followed by the unemployment rate in the US and this months big ticket item the average hourly earnings. If earnings pick up above the forecast 2.8% (last month 2.7%) then it will add real momentum to the dollar as it will speak to a faster interest rate hiking cycle, it is a realistic possibility that the Fed is already behind the curve with the US economy and is going to have to apply the brakes sooner rather than later. If rates are going higher then the emerging market economies are those likely to suffer most and the Turkish Lira seems particularly at risk, Turkey has increased its interest rate to 17.5% in recent months (thats not a typo 17.5%) and as you can see from the chart the technicals still look really bullish.
Friday is also the day that the US tariffs against China are due to start and if they do it could trigger an increase in trade war intensity. China have said that as soon as the tariffs become effective they will introduce their own and Mr Trump has threatened that if China does respond he will quickly impose tariffs on another huge section of Chinese goods.
The countries most at risk from trade wars are Emerging markets which puts the Turkish lira in the firing line again.
If the data was not due tomorrow I might have just bought on the technical data but the plan is as follows
If US data is good and tariffs go ahead I will buy the USDTRY risking 2% of equity hoping for a higher than usual risk reward of 2:1

AUDUSD (Short)Whats up Guys,
95% of the the meat and potatoes of this chart is explained on the chart -
Fundamentals Behind my Technicals -
No surprise and not the only thinking this - the trade war with the US and China is currently and for the medium term in the FAVOR of the US. This hurts China. Australia is a major exporter to China. This hurts Australia. Australia remains Dovish with their interest rates and nothing spectacular happening in their economy ATM.
The Red Lines above the ST on my chart - show - in the event that I am wrong and the AUDUSD breaks out Upwards, areas of potential resistance to the breakout.
Keep a close eye on this one guys - i think its ready to pop.
Ten Likes and I will update the chart
Intelligent disagreement welcome
Good Luck - See you on the trading floors
#Crypto #BTC #cryptocurrency #ADA #CARDANO #LTC
#LTCUSD #LitecoinNation #XRPCommunity #XRP #Ripple
#EOSUSD #BCH #BITCOINCASH #forex #EURUSD #AUDJPY #GBPUSD
#USDCFH
-Nix

One of DJI's Confirmations Not Looking Good - DJTAs is suggested by the heading even though we're seeing a rebound of DJI's rally one of it's confirming indicators is showing weakness. For the most part we use the Dow Jones Index as loose indicator of the overall economy, when it's performing well, on it's face, we discern that the economy is humming along well. As a confirmation for the thought process we use the Dow Transports Index, among others, and discern from if the rally is real or not. The reasoning being, as an index that follows the biggest transporting companies within the economy, it's reasonable to think if transports are performing well then commerce within the economy must be doing well. So, when DJI is rallying and it's confirmed by the DJT, along with other factors, we can discern that the economy is performing well. I'll move onto the analysis, to explain how the index is tracking.
Weekly
1. Noticed that there's been high volume in the last two years of trading relative to long-term trend, 200-moving average.
2. It's been trading in a channel YTD which is confirmed by relatively accurate tracing stochastic indicator.
Daily
1. Within the YTD channel, there's an interior resistance that's quite robust. That's where we find the index, today-July 25, 2018, and as with the other reactions from that interior resistance it's retracing back to the bottom of the channel.
2. The Stochastic indicator is tracing accurately with the index, which is on tracing downwards confirming the hypothesis.
Conclusion: The Dow Jones Index has been on an upwards trend but one of the confirming indicators is showing that that might be a faux-upswing. In terms of the overall economy, we're starting to see that the market starting to be affect by the tariffs and the trade war.

CAT LONG OR Short IdeaTrade wars is going to hurt it or not it's up to big money holding the stock. Boxes are where i see price hitting in the next week to two. Will investors pull money of this and other US leaders and start putting it to work in other markets? Which markets would you pick?

DAX on all the way down?Beautiful chance my friends!
If the resistance of our double-top-pattern gets confirmed it`s time to sell. :-)
Take a look at the 1h Chart and see the Breakout of the Up-trend-Channel.
I dunno how to add more charts. ;-)
Peace and good trades

DXY by Presidential PartyTrump is about to leave his mark. There will be a flight to safety at some point, but there are more secure currencies being developed daily.

Selling Value Area In The USD/CADFriday has brought a myriad of challenges to currency players. Trade war hysteria has boiled over, with the USD fading against the majors. It appears that selling the Greenback is the play across the early U.S. forex session. The 1.3134-40 area has set up as value in the USD/CAD for the last two days. If this market tests it once again, a nice position to the short will be in play.
Here it is:
1)Entry: Sell 1.3134
2)Stop Loss: 1.3176
3) Profit Target: 1.3092
4) Risk vs Reward Ratio: 1/1
In the event that this trade goes live before today's forex close, the short position will stand over the weekend. If not, scratch the trade.

Gold (XAU/USD) Trade Sideways- NFP Breakout Looms As we can see, the volatility is really thin today as traders are waiting for the NFP figures. Gold is also stuck in a narrow range of $1,251 - $1,259. Probably we will see a breakout on NFP. So brace yourself!
Stay tuned for more updates.

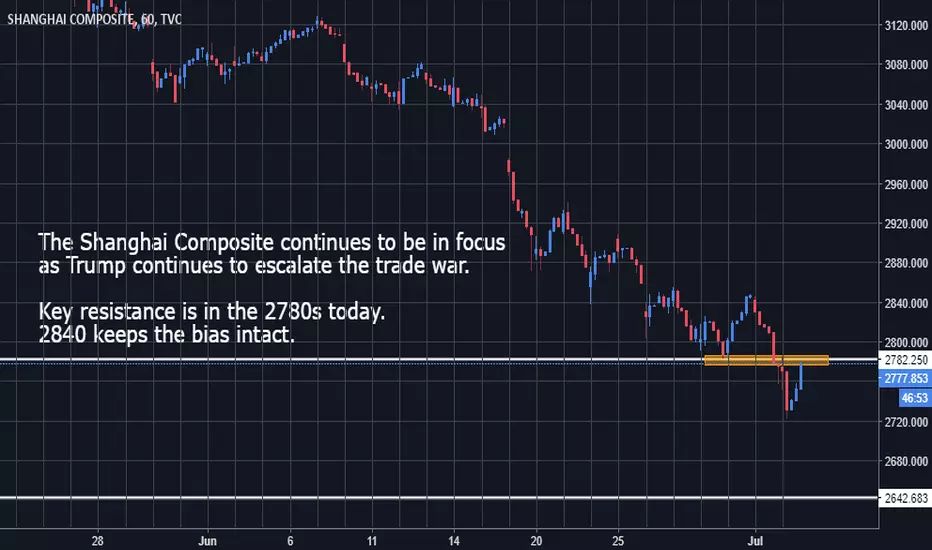
SHCOMP - Bias remains negative Trump continues to escalate the Trade War, now hitting China Mobile.
Chinese bourses are being watched in order to gauge the seriousness
of Trump's moves.
Remember that Tariffs come into place Friday July 6th.
Gold Standstill as Market Sentiment Turns to Risk-offGold has a very strong support near $1.246 today. I will be looking to stay bullish above $1,246 to target $1,252, while selling entry will be preferred below $1,252. Good luck and stay tuned for more updates!

Bulls moving in on Crypto with the help of Trump #tradewar.It was quite an intense week in terms of headlines related to the trade war. The dollar is easing and this inevitably affects the price of BTC.
We can see a strong correlation here between the EURUSD and BTCUSD. The gross majority of Crypto-investors are poised to buy on an upward break and this was maybe just the hint we needed to get back in there and buy. I see the 6400 and then 7800 as major areas of consolidation.

Brace! Avoid being flushed out in the 'Economic Colonic'. In this screencast I show how I attack the US30. It's very different to what you see 'out there'. This is about a robust and real trend-following methodology. And not - I'm not selling anything! WYSIWYG. Totally for free! Everybody deserves a chance.
Reality has come home to the markets - globally. There is a mega trade war on at the moment and it has been for several weeks. The impatient and greedy will lose their money to those who are patient and strategic.
