Nasdaq Hits Double Top Target – What's Next?Amid declining economic confidence and economic growth forecasts, stimulated by expanding trade wars, the Nasdaq has reached the double top pattern target formed between the December 2024 and February 2025 peaks at 19,100.
This level also aligns with the 0.618 Fibonacci retracement of the uptrend from the August 2024 low (17,230) to the February 2025 high (22,245).
The 19,000 barrier holds significant technical weight, as it coincides with:
The golden Fibonacci ratio and the double top pattern target.
Oversold conditions on the daily RSI, previously seen in August 2024 and dating back to similar levels in 2022 on the 3-day time frame.
Key Levels to Watch:
🔻 Downside Risk: If market turbulence intensifies and the Nasdaq drops below 19,000, the next key level is the 0.786 Fibonacci retracement at 18,300, with potential interim support at 18,700.
🔺 Upside Potential: If markets respond to oversold momentum conditions, a break above the short-term resistance at 19,700 could trigger rallies toward 20,000, 20,300, 20,700, and 21,000. A strong hold above 21,000 could extend bullish momentum back toward record highs.
Key Events to Watch:
US PPI Data (Today)
US-Canada Trade War Developments
US Consumer Sentiment Report (Friday)
- Razan Hilal, CMT
Tradewar

EURUSD: Trump’s trade war crosses the Atlantic You may be sick of hearing about tariffs, but they are currently the catalyst for a huge amount of volatility in the market and a huge amount of trading opportunities.
And now Trump’s trade war has crossed the Atlantic
Today, the European Union announced retaliatory tariffs on approximately €26 billion worth of U.S. goods in response to President Donald Trump's recent increase in tariffs on steel and aluminum imports. Targeted products include Harley-Davidsons, bourbon, and jeans—key American exports that have been caught in previous trade disputes.
The EU has said it remains open to negotiation but has not ruled out further action.
In response, Trump vowed to retaliate, stating, “Of course I’m going to respond.” The daily chart for the EUR/USD shows the pair could fall into a larger corrective decline, given overbought RSI conditions.

GBPUSD Holds Below 0.618 Fibonacci RetracementFollowing the DXY's decline, the British pound surged back above the trendline connecting lower highs between 2014 to 2021, aligning with a key resistance at the 0.618 Fibonacci retracement of the downtrend between the September 2024 high (1.3434) and the January 2025 low (1.2099) at 1.2945.
Current Market Setup:
RSI on the 3-day time frame is now overbought, aligning with the inverted head and shoulders target formed by the RSI trend near oversold levels, reinforcing reversal potential.
Further downside risks persist, with market sentiment hinging on growth data, trade war developments, and US inflation figures.
Key Levels to Watch:
A decisive close above 1.2850 could pave the way toward 1.3020, 1.3160, and 1.34.
Failure to hold gains could trigger a pullback toward key support zones at 1.28, 1.27, and 1.2570.
Key Events This Week:
US CPI
UK GDP
Trade War Developments
- Razan Hilal, CMT

Crude Oil: Is There More Downside?Following crude oil’s rebound from its September 2024 low of $65.20, the risk of a reversal remains uncertain amid ongoing bearish pressures.
Key Events This Week:
Chinese deflation risks
OPEC monthly report
US CPI data
Trade war developments
Potential Scenarios:
🔻 Bearish Scenario:
A clean break below $65 could extend losses toward $63.80, a key level that may determine whether the market holds neutral and rebounds or breaks further into a steeper bearish trend towards $62, $60, and $55 (the 0.618 Fibonacci retracement of the 2020–2022 uptrend).
🔺 Bullish Scenario:
If the rebound sustains above $67, resistance levels at $68.70, $70.80, and $72.50 could come back into play.
- Razan Hilal, CMT

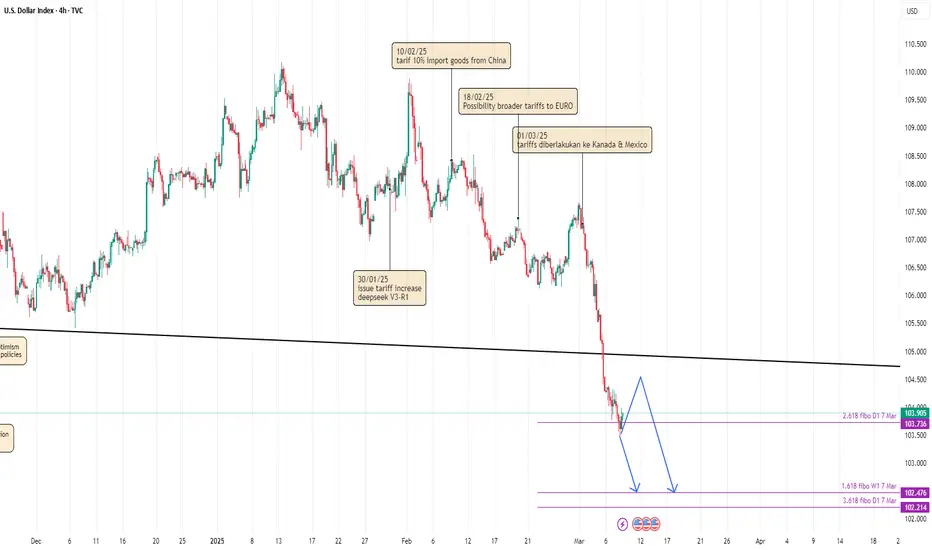
DOLLAR GAINS BUYER AMID NFP BAD DATA??Dollar seems on hold in it's 2.618 fibonacci support after NFP data released. Will it go higher next week?
I see dollar still waiting next data release. I mention JOLTS Job Opening & CPI which both of them crucial in current context of US macro-economy. Strong job opening & CPI means investor and retail trader must be no worries about US macro-economic despite concern about trade war. Otherwise, weak job opening & CPI means labor market and inflation continue cooling down. It will push THE FED to give clear path about their plan for future Interest Rate.
So, dollar could make sideways movement (or even gain buyer) but overall still in bearish momentum. Dollar still driven by concern of trade war and if job opening comes weaker than expected, it could gives more power to seller.
Canadian dollar higher as US suspends auto tariffsThe Canadian dollar is steady on Thursday after gaining around 1% over the past two days. In the European session, USD/CAD is trading at 1.4351, up 0.07% on the day. We could see some volatility from the Canadian dollar over the next two days, with the release of the Ivey PMI today and the employment report on Friday.
The Trump tariff saga took a twist on Wednesday, as the US announced it would exempt automakers in Canada and Mexico from 25% tariffs for 30 days provided they complied with existing free trade rules. Trump made clear that the trade war between the US and its two neighbors was not over.
Trump has been shooting from the hip, imposing, suspending, and re-imposing tariffs against Canada. Is this merely a heavy-handed negotiation tactic? If so, chances are good that a deal can be reached and a damaging trade war can be averted. Canada can ill afford a trade war with the US, as some 75% of Canadian exports head to its southern neighbor. A trade war would tip the weak Canadian economy into a recession.
The Bank of Canada is nervously watching as trade tensions escalate between Ottawa and Washington. The BoC has said that a trade war with the US would inflict "permanent" damage on Canada's economy and boost inflation. The BoC is in the midst of an easing cycle and a trade war would complicate plans to futher lower rates.
Canada's Ivey PMI fell sharply in January to 47.1 from 54.7, its first contraction in five months. The PMI is expected to rebound in February, with a market estimate of 50.6, which would point to stagnation. On Friday, Canada and the US release employment reports.
143.75 and 144.19 are the next resistance lines
There is support at 143.00 and 142.56

USD/MXN: The Mexican Peso Weakens as New Tariffs Take EffectOver the last three trading sessions, the pair has risen by more than 2% in favor of the U.S. dollar as the threat of tariffs has become a reality. So far, President Trump has confirmed that the measures will take effect today, and there is currently no hope for another deadline extension.
The President of Mexico has traveled to the United States for an official meeting, but at this time, there are no expectations that the measure will be lifted in the short term. Given this, investors have determined that the U.S. dollar is likely the strongest currency to consider, especially if there is a potential economic slowdown in Mexico’s activity in the coming months.
Consistent Sideways Range
For now, USD/MXN remains in a sideways range, defined by a ceiling at 20.91 pesos per dollar and a floor at 20.07 pesos per dollar. The recent bullish momentum has once again tested resistance, and if upward pressure on the U.S. dollar remains strong, it is possible that the sideways channel could give way to an uptrend, which has remained dormant. It is important to note that the latest candlestick in the formation shows strong neutrality, highlighting the barrier imposed by the current resistance level.
ADX Indicator
At the moment, the ADX line has started an upward trend and is now above the neutral level of 20 on the indicator. This suggests that the average of bullish movements in recent trading sessions is becoming trend-defining. However, it is crucial that the ADX line continues to move away from the neutral level to confirm that buying pressure is strengthening in the short term.
Key Levels:
20.91: Major resistance, marking the upper boundary of the broad sideways range and acting as the most critical barrier for the latest bullish move. Breaks above this level could lead to new highs, ending the current consolidation phase.
20.43: Important support, aligning with the Ichimoku cloud barrier as well as the 50 and 100-period moving averages, highlighting the strength of this level. If the price falls below this point, the sideways range could extend further in the coming sessions.
20.07: Final support, positioned at the lowest price levels recorded in December 2024. If the price nears this zone, it could reinforce the bearish outlook, completely invalidating the long-term bullish trend.
By Julian Pineda, CFA – Market Analyst

GOLD (XAU/USD)—$2,975 HIGH SPARKS BUZZGOLD (XAU/USD)—$2,975 HIGH SPARKS BUZZ
(1/9)
Good afternoon, TradingView! Gold (XAU/USD) hit $ 2,975 in Feb ‘25, up 5-7% YTD 🌍 2024’s 26-27% gain shines—here’s the breakdown.
(2/9) – PRICE RISE
• 2024 Gain: 26-27%, best since 2010 📈
• 2025 YTD: 2,955-2,975, 5-7% up 💡
• Feb 24: +0.52% to new high 🌞
Gold’s climb, safe-haven rules.
(3/9) – MARKET MOVES
• Trade Fear: Tariffs spark inflows 🌟
• FASB: Coinbase tie lifts mood 🚗
• Dip: $ 2,940 Feb 25, profit takes 📊
Gold’s humming, tension fuels it.
(4/9) – SECTOR SNAP
• Price: 2,940-2,875, $ 20T+ cap 🌍
• Vs Silver: Outpaces XAG’s wobble 💪
• Forecasts: UBS $ 3,200—value gap? 📉
Gold’s steady, peers falter.
(5/9) – RISKS IN FOCUS
• Fed: High rates cap upside ⚠️
• USD: Tariff boost stings 🔒
• Profit Takes: -1.27% Feb 25 🐻
Gold’s firm, but headwinds nip.
(6/9) – SWOT: STRENGTHS
• Gain: 26-27% ‘24—tough haul 💪
• Demand: Banks, ETFs pile in 🏋️
• Hedge: 4.3% inflation shield 🌱
Gold’s gritty, crisis-proof.
(7/9) – SWOT: WEAKNESSES & OPPORTUNITIES
• Weaknesses: No yield, USD bite 🙈
• Opportunities: Tariffs, $ 3,200 zing 🌏
Can gold vault past the snags?
(8/9) – Gold’s $ 2,975 peak, your view?
1️⃣ Bullish, $ 3,200+ soon 😎
2️⃣ Neutral, Holds, risks linger 🤷
3️⃣ Bearish, $ 2,800 dip looms 😕
Vote below! 🗳️👇
(9/9) – FINAL TAKEAWAY
Gold’s $ 2,975 Feb high and 26% ‘24 stack up, safe-haven star Trade fears lift, risks loom, gem or pause?

Bitcoin Slips: Buy the Lows or Ride the Sell-Off? Following an extended expanding consolidation from Dec 2024 – Jan 2025, bearish pressure intensified after a downside breakout, increasing the probability of a double-top formation at 108,360 – 109,350. This raises concerns about a potential drop towards the previous major support-turned-resistance zone at 72,000 – 74,000.
🔹 Momentum Check: The RSI has hit oversold levels last seen in Aug 2024, when BTCUSD found a bottom before rallying past 100K.
🔸 Bullish Scenario: If BTCUSD holds above 82,000, upside targets include 86,500, 93,000, and potentially a retest of 109,000.
🔻 Bearish Scenario: A close below 82,000 could accelerate declines toward 79,500 & 72,000, aligning with the 50% & 61.8% Fibonacci retracement of the Aug 2024 – Jan 2025 uptrend.
- Razan Hilal, CMT

Gold NEW ATH to $2,954?! (1H UPDATE)Gold on the 4H TF is within its final Wave 5 bullish move, there’s no arguing with that. The only thing to debate is how high can Wave 5 push up before reversing?
While it’s possible that Wave 5 has now peaked at $2,942 & ready for a major correction, on the 1H TF I see a small possibly of it creating a new ATH toward $2,954. HIGH RISK TRADE.
Confluences👇🏻
⭕️Distribution Schematic Taking Place Between Wave 3 High, Wave 4 Low & Wave 5 High.
⭕️Wave E Rejected From Psychological Number Of $2,940 (LQ Trap).
⭕️No Strong Sell Off Yet To Indicate A Reversal Has Started.

Evaluating the Future of Midcaps: How Much Pain Is Left....?Midcap Correction: How Much More Pain is Left..?
The midcap sector has experienced a significant correction, currently down approximately 18% amid the broader market downturn. This raises an important question: how much more pain is left for midcaps?
Historical Context and Market Correction :
If we look at past trends, this 18% to 20% correction is not unprecedented. A similar downturn occurred in 2022, when the midcap index was corrected by around 23.3%. Therefore, it’s important to remember that such market fluctuations are a normal part of the cycle and not something entirely new.
Primary Causes of the Correction :
Two key factors have contributed to the current market correction. Firstly, the high valuations of midcap stocks coupled with slower-than-expected earnings growth over the past two quarters have created pressure on prices. While there are other contributing factors, these two stand out as the primary drivers behind the recent downturn.
However, this correction may not persist for long. Looking ahead, earnings are expected to pick up in the coming quarters, fueled by an anticipated boost in consumption due to the new income tax bill presented in the latest budget. As a result, a combination of market correction and improving earnings growth could lay the foundation for a potential recovery and a return of the bull run.
Technical Support Levels and Future Outlook :
From a technical analysis standpoint, the midcap index is currently hovering around the 49,650 mark, which is a significant support level. Additionally, this price point coincides with the 0.5 Fibonacci retracement level, reinforcing its importance as a key technical support area. The broader Fibonacci golden zone, which spans from 50,180 to 46,800, also suggests that this range will provide strong support for the midcap index in the near term.
Given these technical factors, it’s reasonable to anticipate that the downside could be limited to around 5% more from the current level of 49,650. Beyond this range, the market may stabilize, and with expected earnings growth, we could witness a market rebound in the upcoming quarters.
Risks to Consider :
While the outlook for midcaps appears optimistic, investors should remain cautious. One major risk is the ongoing trade war, which continues to create significant uncertainty in global markets. Any escalation in trade tensions could weigh on the broader market, including midcaps, and introduce additional volatility.
Conclusion :
In summary, while the midcap index has experienced an 18% correction, this level of decline is not unprecedented, and there is potential for recovery. With strong earnings growth expected in the coming quarters and key technical support levels in place, the midcap sector could see a return to positive momentum. However, caution is advised, especially considering the uncertainties surrounding the trade war. Investors should keep an eye on these developments to navigate the market with caution and opportunity in mind.

China - U.S. Tariff Trade War!🩸China has slapped the U.S. with 10% tariffs on Energy products & automobiles as a retaliation🩸
China’s tariffs on U.S. energy & cars will hurt American exporters by reducing demand & pushing down prices, affecting profitability. Energy producers may struggle with oversupply, while automakers like Tesla and Ford face declining sales in China.
The move escalates U.S.-China trade tensions, discouraging investment and increasing market volatility. While lower energy prices could help inflation, job losses in key industries may offset any benefits.
U.S. policymakers might respond with countermeasures. If tensions rise further, a broader trade conflict could emerge, increasing risks for the global economy.

$FESX1! EURO STOXX 50: 7 WEEKS OF GAINSEUREX:FESX1! EURO STOXX 50: 7 WEEKS OF GAINS
1/7
The EURO STOXX 50 is on track for its seventh consecutive weekly gain! 📈⚡️
This winning streak continues despite global trade war jitters and shifting market sentiment.
2/7
Why the optimism? 🤔
Investors appear cautiously confident about U.S. trade policy developments, with Europe seen as a more stable option amidst American economic uncertainties.
3/7
Key influences to watch:
• U.S. Jobs Data: Friday’s payroll numbers may affect overall risk sentiment.
• Trade War: Trump’s tariff talk + a one-month reprieve for Mexico & Canada = a temporary sigh of relief?
4/7
Currency factors also play a role. 💱
The Yen’s strength due to expected BoJ rate hikes could affect export-related optimism if the Euro shifts in tandem.
5/7
Commodities?
Gold remains steady near record peaks, signaling some investors are still seeking safe havens—even as equities rally.
6/7 What’s driving the EURO STOXX 50’s resilience?
1️⃣ Diversified European economy
2️⃣ Stable/dovish monetary policy
3️⃣ Shift to Europe as a “safer” bet
4️⃣ Combination of factors
Vote below! 👇✅
7/7
Market watchers see Europe’s diverse economic base 🏭🛍️ shielding stocks from U.S. volatility. Plus, the possibility of more accommodative European monetary policy adds extra support.

China's kicked off Year of the Snake: Trade War Meets AI Rally China's Markets in 2025: Trade War Meets AI Rally 🐍📊
1/9
Chinese stocks kicked off the Year of the Snake with mixed signals. Trade tensions with the U.S. are rattling markets, while AI-sector hype led by DeepSeek is lifting tech stocks. 🛑⚡ Will AI innovation outshine trade fears?
2/9
After a holiday break, mainland Chinese markets opened under pressure. The Shanghai Composite Index (SSE $000888) struggled to gain momentum, reflecting concerns over new U.S. tariffs. 📉 Trade wars continue to haunt global markets.
3/9
Meanwhile, Hong Kong-listed Chinese stocks rallied strongly despite tariff risks. Investors remain optimistic about cross-border business resilience and opportunities in tech. 🏢📈
4/9
Currency Stability: The firm fixing of the yuan signals that Beijing is stepping in to manage volatility. Stability in currency markets is crucial for maintaining investor confidence. 💴 Will this intervention calm the storm?
5/9
Trade tensions escalated with new tariffs from the Trump administration. While the measures were less severe than feared, the negative sentiment still weighed on broader market performance. ⚖️ What’s next for U.S.-China trade talks?
6/9
On the upside, the AI sector surged. Buzz around DeepSeek—a rising Chinese AI player—sparked gains in tech giants like Alibaba ( NYSE:BABA ) and Baidu ( NASDAQ:BIDU ). 🚀 AI is becoming a crucial driver of China’s economic narrative.
7/9
Technical Watch:
Shanghai Composite Index (SSE $000888): A bellwether for China's economic sentiment.
CSI300 ($000300): Captures performance across top Chinese blue chips, reflecting key market trends.
8/9
Chinese tech giants like Alibaba and Baidu are riding the AI momentum, but the backdrop of geopolitical and regulatory risks could temper gains. 📊 Can AI innovations outweigh trade turbulence in 2025?
9/9
What’s your outlook on China’s markets this year? Vote now! 🗳️
Bullish: AI-led rally continues 🐂
Neutral: Trade volatility offsets gains ⚖️
Bearish: Trade war worsens 🐻

TAO DAILY For me there are two possible entries for TAO caused by the trade war situation in the US, so this is my take on the chart:
- Wicks get filled as a rule of thumb, so this capitulation wick that has reset all the progress made in Q4 2024. My preferred entry would be a sweep and reclaim of the wick as this coincides with range low and a bullish orderblock, an area of extreme support on the high timeframe.
- Another entry would be the breakout of the diagonal downtrend resistance, if this could coincide with the reclaim of the 0.25 line in the range that would add further confluence and a better R:R IMO.
For both entries the Midpoint would be a key S/R level and would be very high resistance.

DXY Analysis & ConsiderationsOverall Trend & Context:
Long-Term Uptrend: The DXY exhibits a clear uptrend from late 2023, indicating persistent USD strength.
Key Levels:
Resistance Zone (109.50 - 110.00): This zone has proven a challenge for the DXY to break decisively. A sustained break above this level is crucial for further upside.
Support Zone (107.00 - 108.00): This zone has provided support during pullbacks.
EMAs (25, 50, 100, 200 - 4-Hour Chart): The DXY is trading above all EMAs, a bullish sign. The 25 EMA is acting as dynamic support, and a bullish crossover (25 above 50) has occurred.
Potential Scenarios & Probabilities:
Bullish Breakout (High Probability) : The bullish EMA alignment favor an upside breakout above 110.00. Increased volume would confirm this scenario.
Pullback to Support/EMAs (Medium Probability) : A pullback towards the support line or the 25 EMA (around 108.80 - 109.00) is plausible, especially given the overbought RSI. This could offer a good long entry opportunity.
Breakdown Below Support (Low - Medium Probability) : A break below the support line and the EMAs would weaken the bullish outlook and could lead to a deeper correction.
Trading Considerations:
xxxUSD pairs - If the dollar goes up we should look for short positions.
USDxxx pairs - If Dollar goes up we can look for long positions.
A pullback to the support zones or the 25 EMA could offer a lower-risk long entry, provided these levels hold and there is sufficient demand on the USDxxx pair you're trading. (technicals should always be prioritized)
Consider placing stop-loss orders below key support/demand levels to manage risk.
Look for increased volume during breakouts or bounces off support to strengthen signals.
Watch for bearish divergence on the RSI as a potential bearish warning sign on the DXY.
Geopolitical Factors:
De-dollarization Efforts: Some countries are exploring alternatives to the US dollar for trade and reserves. While this is a long-term trend, any significant announcements or actions could impact the dollar's value.
Sanctions and Trade Policies: US sanctions and trade policies can influence the dollar's strength, particularly against the currencies of targeted countries. The US imposed tariffs are creating ripples right now.
Let's quickly look at what 'tariffs' are -
By now you should all know about the US imposed tariffs on several major trading partners including China, Canada and Mexico (and that they've retaliated with their own tariffs on US goods).
What does this all mean?
In the US any goods that are imported from Canada for example, will now cost more to the general public. To put it simply, the US is now charging a "handlers fee" and that will increase the overall price.
These tariffs are intended to encourage these countries to change their trade practices.
The tariffs have disrupted global supply chains, increased costs for businesses, and created uncertainty.
Make no mistake, this is without a doubt, a trade war.
Potential Impacts on the US Dollar:
Positive Impact:
Safe-haven demand: Increased global economic uncertainty due to the trade war could drive investors towards the US dollar as a safe-haven asset, increasing demand and its value. People will flock to the take no s#it protocols implemented by the Trump administration.
Reduced imports: If tariffs lead to a significant decrease in US imports, there could be less demand for foreign currencies to purchase those imports, indirectly increasing demand for USD. This means that trade conducted by the US will increase the overall Dollar output - thus making it seem more valuable. (If we assume the Trump administration is playing petty games, we're badly misinformed, we should assume that these are well calculated risks)
Negative Impact:
Reduced US exports: Tariffs can make US goods less competitive, leading to a decrease in exports. This can reduce foreign demand for USD, as fewer foreign buyers need dollars to purchase US goods.
Economic slowdown: The trade war could negatively impact economic growth in the US and globally. A slowdown in the US economy could make the dollar less attractive to investors.
Retaliatory tariffs: If other countries retaliate with their own tariffs on US goods, it can further dampen US exports and reduce demand for the dollar.
Trade Wars and Uncertainty:
The uncertainty and potential for escalation associated with trade wars can negatively impact investor confidence and lead to a flight to safety. While the USD is often seen as a safe haven, extreme uncertainty could lead investors to seek other safe-haven assets or reduce their overall exposure to USD (Right now Gold is something you should be looking into as a trader and investor).
Final Notes:
The technical picture is strong and does favour a breakout. But the geopolitical risks reduce the probability. Be prepared for fundamentals to override technicals in the short term.
Given the heightened risks, traders should be cautious and wait for clear confirmation signals before taking positions.
Closely follow news related to the debt ceiling, economic data, and geopolitical events.
Disclaimer: This analysis is for informational purposes only and does not constitute financial advice. Trading involves substantial risk and may not be suitable for all investors. Conduct your own research and consult with a financial advisor before making any investment decisions.

Solana Breaks Key Support Level – Is a Short Opportunity Ahead.?Solana has recently breached its previous support level of $221, signaling a potential shift in market dynamics. Given the technical analysis indicators, there may be an opportunity to initiate a short trade upon the price retesting this level, which could serve as a new resistance point. However, traders should exercise caution in their approach, particularly in light of the ongoing trade tensions involving the United States, Canada, China, and Mexico. These geopolitical factors could introduce volatility and impact market sentiment significantly, making it essential to implement risk management strategies when executing trades.

Trading Gold Futures Amid Global Trade TensionsCOMEX: Micro Gold Futures ( COMEX_MINI:MGC1! ) #Microfutures
The United States will be implementing new tariffs on Saturday, February 1st, including 25% tariffs on Mexico and Canada as well as a 10% duty on all goods from China. These countries are the Top 3 U.S. trading partners, contributing to 40% of all goods and services imported into the US in 2023, collectively.
On Friday, gold prices surpassed the key $2,800 mark for the first time ever. Spot gold rose 0.6% to $2,810.55 per troy ounce, after hitting a record high of $2,817.23. The record rally is fueled by a flight to safety as trade tensions rise.
Gold futures are trading at a premium to spot gold prices. The lead April contract of the benchmark COMEX gold futures settled at $2,833 on Friday.
Looking back, the trade tensions between the US and China have intensified since 2018. This time, higher tariffs will be applied globally, not only to competitors of U.S. interests, but also to close allies such as Canada, Mexico and the European Union.
Lessons from the US-China Trade Conflict
How would the global trade conflicts shape up? Uncertainties remain elevated. Luckily, the US-China trade conflict provides us historical lessons with present-day relevancy.
Let’s have a quick review of the major timeline of key events:
• July 6, 2018: The trade conflict begins as the US imposes 25% tariffs on $34 billion worth of Chinese goods. China retaliates with tariffs on an equal amount of US goods.
• August 23, 2018: The US imposes additional 25% tariffs on another $16 billion worth of Chinese goods. China responds with tariffs on $16 billion worth of US goods.
• September 24, 2018: The US imposes 10% tariffs on $200 billion worth of Chinese imports. China retaliates with tariffs on $60 billion worth of US goods.
• December 1, 2018: A temporary truce is agreed upon during the G20 summit, with a 90-day period for negotiations.
• January 15, 2020: The "Phase One" trade deal is signed, easing some tariffs and committing China to increase purchases of US goods.
Gold prices responded quickly at each stage of the trade conflict, creating ample trading opportunities. On June 7, 2022, I published “Event-Driven Strategy Focusing on Global Crisis” on TradingView, based on my own trading experience from 2018-19. A link to this write-up is provided here for your information:
In summary, I observed patterns in gold prices while the trade conflict was progressing, and designed event-driven strategy based on Game Theory. Here are the highlights:
• US initiated new tariffs; Gold prices went up (“Risk On”)
• China retaliated with new tariffs; Gold prices went up further ("Risk On”)
• US and China announced trade negotiations; Gold prices went down (“Risk Off”)
• Negotiations broke down followed by new tariffs; Gold prices went up (“Risk On”)
• Negotiations resumed; Gold prices went down (“Risk Off”)
• Trade agreement was reached; Gold prices went down sharply (“Risk Off”)
The “Fight-and-Talk” could go multiple rounds, pushing tariffs to higher levels. Just how high?
China previously maintained a 12% import tariff on U.S. pork products. In its first round of trade retaliation in 2018, China imposed an additional 25% tariff on US pork. A month later, another 25% was added. Pork tariff went up a further 10% in the third round of retaliation, making the total tariff on US pork at a mind-boggling 72%!
As shown in the chart, gold responded in an observable manner following each key event. This repetitive pattern made it possible to set up trades in anticipation of the next moves.
The Sequence of Next Moves in Trade Conflicts
Learning from the previous experience, we could simulate a series of scenarios when new tariffs are imposed on goods from Canada, Mexico, China and the EU.
• US initiates new tariffs; Gold prices go up (“Risk On”)
• The other country retaliates with new tariffs; Gold prices go up further ("Risk On”)
• The two countries announced trade negotiations; Gold prices go down (“Risk Off”)
• Trade agreement is reached; Gold prices go down sharply (“Risk Off”)
In my opinion, the countries involved would retaliate but may want to avoid a costly trade conflict dragging on. With the brutality of the last trade conflict still fresh in mind, trade deals could be reached more quickly. From a trading perspective, the Fight-and-Talk patterns could be repeated multiple times, making our event-driven strategy reusable.
Given that Canada, Mexico, China and the EU are the biggest U.S. trading partners, the price swing in gold could be more volatile. Conflicts with smaller trading partners, such as Taiwan and the Southeastern Asian countries, may not trigger big moves in gold.
The CFTC Commitments of Traders report shows that on January 28th, total Open Interest (OI) for Gold Futures is 577,505, up 15% from the level last November when the U.S. election was held. Interest in using gold for trading or hedging goes up with the escalation of risk.
“Swap Dealers” own 363,051 contracts, making them the largest trader category to own gold futures positions.
• Swap Dealers have 29,725 in Long, 272,549 in Short, and 60,777 in Spreading
• The long-short ratio of 1:9 indicates that “Smart Money” is overwhelmingly bearish
There is another supporting factor for a bearish view:
A key driver in gold prices is the geopolitical crisis. President Trump announced that he planned to meet with President Xi of China within the first 100 days in office. A meeting between President Trump and Russian President Putin is also being planned.
As we know, bullion is a preferred asset during times of turmoil. We may soon see the geopolitical risks unwinding, which will send gold prices sharply down. This could happen when Russia and Ukraine end their military conflict with a peace treaty.
Trade Setup with Micro Gold Futures
If a trader shares a similar view, he could express his opinion by shorting the COMEX Micro Gold Futures ( AMEX:MGC ).
MGC contracts have a notional value of 10 troy ounces. With Friday settlement price of 2,833, each April contract (MGCJ5) has a notional value of $28,330. Buying or selling one contract requires an initial margin of $1,150.
The MGC contracts are very liquid. On Thursday, MGC has a daily trade volume of 126,712 contracts and an Open Interest of 30,633.
Hypothetically, a trader shorts April MGC contract and gold prices pull back 5% to 2,691. A short futures position would gain $1,420 (=142 x $10). Using the initial margin as cost base, a theoretical return would be +123% (= 1420 / 1150). The risk of shorting gold futures is rising gold prices. Investors could lose part of or all their initial margin.
Traders could express the same view with the standard COMEX Gold (GC) futures or the newly launched 1-ounce gold futures, which represent just 1/10 the size of a Micro Gold (MGC) futures contract and 1/100 of GC futures contract.
To learn more about all the Micro futures and options contracts traded on CME Group platform, you can check out the following site:
www.cmegroup.com
The Leap trading competition, sponsored by CME Group, will begin at TradingView on February 3rd. I encourage you to join The Leap and compete to be the best in CME Group futures trading and win a share of $25,000 in cash prizes or an additional six months to your TradingView subscription.
www.tradingview.com
Happy Trading.
Disclaimers
*Trade ideas cited above are for illustration only, as an integral part of a case study to demonstrate the fundamental concepts in risk management under the market scenarios being discussed. They shall not be construed as investment recommendations or advice. Nor are they used to promote any specific products, or services.
CME Real-time Market Data help identify trading set-ups and express my market views. If you have futures in your trading portfolio, you can check out on CME Group data plans available that suit your trading needs www.tradingview.com

Why Tariffs & Why Now?Trump's tariffs aim to reshape international trade. They target imports from China, Mexico, and Canada starting February 1.
The president sees tariffs as both a policy tool and a growing revenue stream. By imposing fees on foreign goods, he hopes to protect U.S. industries and encourage fair trade practices. U.S. manufacturers face an uneven playing field when compared to foreign counterparts like those in Mexico and China, due to differences in regulations and quality controls.
For instance, China doesn’t have strict regulations like OSHA, which ensures worker safety and environmental standards in the U.S. Additionally, Chinese manufacturers often don't face the same level of quality control scrutiny that domestic manufacturing companies do. These disparities make it difficult to directly compare commodities, as U.S. manufacturers shoulder higher costs to comply with regulations, while foreign manufacturers benefit from fewer restrictions. As a result, domestic manufacturers and distributors struggle to compete on price, which is one of the reasons tariffs are viewed as protecting national strategic interest.
Jamie Dimon, CEO of JPMorgan Chase, in a CNBC interview today from Davos, Switzerland, where the World Economic Forum is taking place said, “I would put in perspective: If it’s a little inflationary, but it’s good for national security, so be it. I mean, get over it.”
Citation: www.cnn.com
Tariffs are not new to Trump’s strategy. The trade war with China in 2018 established a framework for using tariffs to gain leverage. This latest round builds on that approach, with broader goals for economic influence. Trump has proposed a 10% tariff on Chinese goods. The reasoning ties to China’s fentanyl production and export practices.
This decision follows conversations with China’s President Xi Jinping. Trump urged stricter measures against fentanyl production and shipping, linking it to broader trade concerns. American businesses already face up to 25% tariffs on many Chinese imports. These new fees would add further strain to supply chains, raising prices for consumers. However, it will promote domestic manufacturing and bulster this important sector of the economy.
Mexico and Canada are also in Trump’s sights. He plans to impose 25% tariffs on goods imported from these neighboring countries. Canadian Prime Minister Justin Trudeau has expressed concerns saying that Canada supplies vital materials like oil, steel, and lumber. He went on to claim that the U.S. Tariffs could disrupt this trade and raise costs for American industries.
Both nations aim to avoid direct trade conflict while protecting their economies from potential damage. Trump’s tariffs serve multiple purposes. They are designed to pressure trade partners, reduce deficits, and address what he views as unfair practices. Tariffs also play a role in domestic revenue generation. They are a tax on imported goods, and higher tariffs mean more money for government programs. Economists warn of potential downsides, including higher consumer prices. Some argue that the inflationary effects could complicate the Federal Reserve’s plans for interest rate cuts. Let's explore that further now.
What does the data say concerning Tariffs?
The ISM Manufacturing PMI (Purchasing Managers' Index) is a key economic indicator that measures the health of the U.S. manufacturing sector. Compiled through surveys of supply chain executives, it tracks new orders, production, employment, supplier deliveries, and inventory levels. A reading above 50 indicates expansion, while a reading below 50 signals contraction. As a barometer of economic activity, the PMI provides valuable insight into broader economic trends and business conditions.
Since the second half of 2022, the ISM Manufacturing PMI has been in contraction territory, reflecting ongoing struggles in the manufacturing sector. Factors such as high interest rates, which increase borrowing costs for businesses, and weaker global demand have weighed heavily on production. Tariffs, while aimed at protecting domestic manufacturing, could potentially exacerbate these challenges by raising input costs, further pressuring profit margins. Critics argue that higher tariffs could contribute to inflation, limiting the Federal Reserve’s ability to lower interest rates and support broader economic growth.
A strong dollar has also added to manufacturers' woes, echoing the environment during Trump's 2017 inauguration. A strong dollar makes U.S. exports more expensive and imports cheaper, reducing competitiveness for domestic manufacturers. In 2017, the dollar weakened after initial strength leading into the Trump inaguration, providing a temporary boost to manufacturing by making exports more affordable and imports pricier. A similar trend today could aid the sector, but its timing and magnitude remain uncertain, leaving manufacturers navigating a complex and challenging economic environment.
A strong dollar is closely tied to domestic interest rates, as higher rates make U.S. financial assets more attractive to global investors. With the Federal Reserve’s benchmark interest rate, or Fed Funds Rate, at elevated levels, there is a strong incentive for multinational corporations and foreign investors to acquire dollars to purchase U.S. Treasuries.
These assets offer a combination of safety and competitive yields, drawing capital inflows that drive up demand for the dollar. For instance, the U.S. 2-year Treasury yield currently sits at 4.295%, significantly higher than China’s 2-year yield of 1.26%. This wide yield differential makes U.S. Treasuries a far more appealing investment, strengthening the dollar in the process.
The Fed’s success in controlling inflation has further bolstered the dollar's appeal. As inflation trends downward toward the 2% target, the relative stability of the U.S. economy enhances confidence in dollar-denominated assets. This dynamic creates a feedback loop: high interest rates attract foreign capital, which strengthens the dollar, making U.S. exports more expensive and imports cheaper. While this helps curb inflation, it poses challenges for domestic manufacturing by eroding competitiveness. This delicate balance underscores the complexity of managing monetary policy while considering its ripple effects on trade and the broader economy.
One bright spot for domestic manufacturing is that it appears to have hit rock bottom after years of sharp declines. Similar to the transportation sector, which shows signs of recovery as reflected in the recent ATA tonnage index, manufacturing seems to be stabilizing. The worst may be over, and the sector is finally showing signs of life. New orders for manufacturing have moved back into growth mode, offering hope for a sustained rebound. This shift signals that demand is returning, which could provide a foundation for manufacturers to rebuild and capitalize on future opportunities.

AUDUSD-The first interest rate cut is postponed until next year?The AUDUSD currency pair is below the EMA200 and EMA50 in the 4H timeframe and is moving in its downward channel. In case of a valid failure of the channel ceiling, we can see the supply zones and sell within those zones with the appropriate risk reward. The loss of the drawn support range will pave the way down for this currency pair.
The Australian government’s plan to reform the central bank by splitting its board into two divisions is close to becoming law.Prime Minister Anthony Albanese’s administration is pushing through dozens of bills in the Senate during the final parliamentary session of the year to implement these major reforms.
In this process, the government and the minority Green Party reached a last-minute agreement to revive stalled legislation. Previous negotiations had failed because the Greens demanded an immediate interest rate cut by Treasurer Jim Chalmers, which critics argued could undermine the central bank’s independence. Now, with sufficient political support, these long-awaited reforms are set to be enacted soon, potentially reshaping Australia’s monetary and economic policies.
Australia’s four major banks—ANZ, Commonwealth Bank, National Australia Bank, and Westpac—have adjusted their forecasts for when the Reserve Bank of Australia (RBA) will make its first interest rate cut. Westpac and NAB now expect this to occur in May 2025, while CBA and ANZ continue to anticipate a February 2025 cut, albeit with caution. The next RBA meeting is scheduled for December 9–10, 2024.
S&P Global Ratings, in its outlook for the global economy in Q1 2025, stated, “Risks are increasing as the new U.S. administration’s policies are likely to heighten inflationary pressures and tighten financial conditions.” The agency predicts global GDP growth of about 3% in 2025, with U.S. economic growth dropping below 2% and China moving toward 4% growth.
According to Bloomberg, economists anticipate that China’s exports will hit a record high this year as international customers place orders early to avoid potential tariffs threatened by Trump. Meanwhile, Australia, known as a safe haven for heavy-duty pickup trucks, is set to experience its most significant automotive shift in years, with new models arriving, including the first off-road hybrid vehicle from China’s BYD.
Australia, famous for its love of SUVs and petrol-fueled pickups, remains one of the laggards in adopting electric vehicles. According to the Australian Automobile Association, EV sales in Q3 dropped by 25% compared to Q2, accounting for just 6.6% of the market—the lowest share since 2022. However, the arrival of new hybrid models like the BYD Shark 6 could transform Australia’s automotive market and boost demand for electric and hybrid vehicles.
Meanwhile, a spokesperson for China’s Ministry of Commerce reiterated the country’s opposition to unilateral U.S. tariffs. He urged the U.S. to adhere to World Trade Organization (WTO) rules and emphasized that imposing tariffs would not solve America’s economic challenges. China’s stance against unilateral tariff increases, including those threatened by Trump, remains consistent.
On the other hand, the U.S. economy grew at a robust pace in Q3, primarily driven by a significant surge in consumer spending as inflation continued to ease. GDP rose at an annual rate of 2.8% during this period. Consumer spending, the primary engine of economic growth, increased by 3.5%, marking the highest rate this year.
According to the GDPNow model, the real GDP growth rate (seasonally adjusted annual rate) for Q4 2024 was revised to 2.7% on November 27, up from 2.6% on November 19. Following the release of the U.S. Bureau of Economic Analysis’ Personal Income and Outlays report, real personal consumption expenditures growth for Q4 was revised upward from 2.8% to 3.0%.

Will the Dollar Index Redefine Global Economic Equilibrium?In the intricate dance of international trade and geopolitical strategy, the Dollar Index emerges as a critical compass navigating the turbulent waters of economic uncertainty. The article illuminates how this financial barometer reflects the profound implications of proposed tariffs by the U.S. administration, revealing a complex interplay of currencies, trade relationships, and global market sentiments that extend far beyond mere numerical fluctuations.
The proposed tariffs targeting key trading partners like Canada, Mexico, and China represent more than economic policy—they are strategic maneuvers with potential seismic shifts in global trade dynamics. As the Dollar Index climbs, reflecting the U.S. dollar's strength, it simultaneously exposes the delicate balance of international economic relationships. The potential consequences ripple through supply chains, consumer markets, and diplomatic corridors, challenging the post-World War II trade paradigm and forcing nations to recalibrate their economic strategies in real time.
Beyond the immediate market reactions, these developments signal a broader philosophical question about economic sovereignty and interdependence. The tariff proposals challenge long-established multilateral agreements, potentially accelerating a transformation in how nations perceive economic collaboration. While the immediate impact is visible in currency fluctuations and market volatility, the long-term implications could reshape global economic architecture, prompting a reevaluation of the U.S. dollar's role as the predominant global reserve currency and testing the resilience of international trade networks.

Can Japan Weather the Semiconductor Tempest?In the intricate landscape of global semiconductor trade, Japan's recent decision to restrict exports of chipmaking equipment to China has ignited a tempest of geopolitical tensions. The move, while intended to limit China's technological advancements, risks triggering severe economic retaliation from Beijing. As a leading player in the semiconductor industry, Tokyo Electron finds itself caught in the crossfire, grappling with the potential consequences of this escalating dispute.
The semiconductor industry, a cornerstone of modern technology, is intricately intertwined with global economies. Disruptions to the supply of advanced chipmaking equipment could have far-reaching consequences, affecting industries from automotive manufacturing to artificial intelligence. The potential for economic retaliation from China, a major market for Japanese exports, further complicates the situation.
Japan's decision to impose export controls is driven by a strategic imperative to limit China's technological capabilities. However, this strategy carries significant risks. China has responded with a strong warning, threatening severe economic retaliation. The broader geopolitical context further complicates the situation, as the United States and its allies have been working to limit China's technological advancements.
The question remains: Can Japan successfully navigate this delicate balancing act, maintaining its economic interests while adhering to its strategic objectives? The answer to this enigma will likely shape the future of the semiconductor industry and the global technological landscape for years to come.

YINN China Bear #X Leverage ETFAMEX:YINN
China has had lockdowns, trade wars, delisting and
so on yet it hangs in there,
The YINN ETF downtrend is in early reversal.
An entry point may be soon RSI provides
confirmation.
