Triangle Pattern Should Send EURCAD HigherAfter a lot of whipsawing price action on EURCAD, and AUDCAD, I could now see the kind of price pattern in the making.
When there is a range-bound or contracting price action, it usually tends to be a Triangle. I'm able to label the price action on EURCAD.
And if the count is correct, price should resume higher from or near the current market price and the invalidation level should remain intact for the bullish bias to remain valid.
What's your thought? Bullish or Bearish?
Tradewar

EURUSD BIAS IS CLEARLY BULLISH - HOW TO TRADE IT?After a lot of struggling to identify EURUSD bottom, the market has clearly indicated the direction of the trend.
The Zigzag pattern from the weekend analysis actually completed the corrective structure in wave (ii).
Since then, the price has made a five-wave up which I counted as an expanding leading diagonal, but it might as well be a "1-2, (i-ii), i-ii" wave pattern.
What's most important is that we should see a pullback to the near support to get in at a value price, and also the wave (ii) low remains the current invalidation level for any buy position.
What's your thought about EURUSD?
Thanks for reading!
Veejahbee.

GOLD "XAUUSD" CORRECTIVE CYCLE IS YET TO BE COMPLETEDI have posted a series of analyses on GOLD in the last few weeks forecasting a bullish run in the longterm but seems the bears are not giving the bulls a chance.
Here we go again as I'm looking at Gold from a fresh perspective after last Friday's sell-off.
The GOLD corrective structure in wave 4 is becoming more complex. The visible count for the correction right now is a triple ZigZag Elliot Wave pattern.
The retracement which is most likely to be completed within the blue zone that lined up with 50% Fibonacci retracement of wave 3 rally, and wave (iv) low of one lesser degree.
This is a critical level to defence the bears and any move lower that breach wave 1 high @ $1348.0/oz will invalidate wave 4 idea.
Another Elliot Wave Principle that's guiding this retracement is called alternation.
The guideline stated if wave 2 corrective structure is shallow and simple in nature, then wave 4 will be complex and deeper.
In Gold case, wave 2 is a simple zigzag and retraced 38.2% of wave 1, and so we're anticipating wave 4 to retrace 50% in a complex and time-consuming triple zigzag pattern.
NOTE: This bearish bias on gold will most likely drag bitcoin price lower, as explained in the video I published on Sunday.
What's your view on Gold, Bearish or Bullish longterm?
Thanks for reading!
Veejahbee.

CHFJPY ELLIOT WAVE PATTERN FAVORS THE BULLS!I've already explained a lot with the description on the chart!
I will be looking for a pullback to the structural level to position for a long trade in one of the biggest impulse wave, wave iii of (iii).
I will be keeping eyes on it and GJ or EJ for a possible long trade!
What's your thought about CHFJPY? Kindly let me know in the comment!
Best of luck on the charts,
Veejahbee!

NAS100 H4Price has formed a double top formation at the all time highs, & is now forming a bigger picture head on shoulders reversal pattern. Price has now broken the double top neckline & retested with a sharp rejection, pushing price back below mirror level support. Watching for a pullback to retest broken support as new resistance for price to then make its way all the way back down to the head on shoulders neckline.

EURJPY where to go?i think this week will be a slowwwww week.
All the investor waiting for trade war tariff direction due on 15th.
wait confirmation for next move.

EURUSD: Correction Becoming ComplexThe corrective structure on EURUSD is becoming complex! This is expected as the currency used to mimic one another.
GOLD and SILVER are moving lower in the short term so EURUSD should at least wait for them before heading higher.
The retracement seems to be unfolding as a double zigzag Elliot Wave pattern. This gives us the opportunity for a short term bearish move.
If this count is correct, price should resume the rally once the short-term move is completed within the blue box area, comprising of the 78.6% Fibonacci of the impulse, and a zone where wave "y" will equal wave "x".
What's your take on EURUSD? Let me hear from you!

Copper: TARGET 3.00 on positive tariff Deadline newsDonald Trump set December 15 (this Sunday) as the date to impose more tariffs on China. If this date gets pushed back - or a phase one trade deal is achieved - Copper could move up to 3.0 on the prospects of more demand from China

EURUSD Setting Up for Wave (iii) of 3 RallyPrice reversed from wave 2 low and broke out of the descending trendline in a five-wave pattern in wave (i). The subsequent move which is unfolding as a zigzag pattern has the potential to find a bottom within the blue zone comprising the 61.8% Fibonacci of the impulse, a retest of the broken trendline, and wave c will be equal 1.618x wave a, at the same area.
If this count is correct, the invalidation level should remain intact, and price should advance higher in wave (iii).
What's your view about EURUSD? Kindly let me know your thoughts in the comment.
Thanks for reading!
Veejahbee.

XAUUSD Short SetupPrice broke down from the 1480 level due to Trade news and NFP News.
The price broke through the liquidity region and closed below on the 4HTF
Strong support is at the 1450 level, as the price consolidated in that area for a few days before breaking up
In order for the price to move back to that area, a liquidity grab for volume is required to push the price lower.
Expect some wicks into the liquidity zone and then further downside.
Entry @ 1462
Sl @ 1467
TP @ 1450
R/R @ 2.4

BIDU entry $105; hold for return to $200China stock Baidu is way down for the year and dipping this week on trade war news, but the company's earnings outlook has recently improved, with strong positive surprises on the last two quarterly reports. Based on analysts' revisions of the forecasts, I think this stock could see $200 per share again within the next two years. I should note, however, that December tends to be a bad month for Baidu, so rather than buy at the current price of $113, I suggest waiting to buy at the volume node at $105. (The average analyst price target is about $143.)

ORBEX: Trump Triggers Recovery Trade while Pound Soars!In today’s market insights I talk about Trump’s latest comments surrounding the US-Sino rhetoric and why they have triggered a full or partial recovery in risk assets!
Watch me analyse risk vs safety using Elliott Waves, as well as the incredible surge in the British pound!
It seems that BoJo’s chances to win the elections are cracking fresh multi-month price levels! Will this continue being the case?
Timestamps
#EURGBP 1D 01:05
#AUDJPY 4H 04:40
Stavros Tousios
Head of Investment Research
Orbex
This analysis is provided as general market commentary and does not constitute investment advice.

The glass broke 2 days agoAccording to the CICO report and Cashflow indicator, the selloff began two days ago.
Hello friends, its been a minute. I try not to overwhelm you with daily noise. My intent is to give only important information. Trust me, if you heard from me everyday you would be annoyed.
According to the CICO 13 MA on the daily chart, we had our first red day in about a month. What this means is the running sum of new money is leaving the SPY. More people are selling than buying; they want their cash. When a sell off begins the only certainty is nobody knows when it will end. I am a self proclaimed bear. What this means is I naturally prepare for results to be the worst case scenario and then I peel back layers of the emotional onion. Meaning, I think of the worst possible scenario and then question the reasoning. My goal is to uncover as much information as possible and then make a decision. I try to look at the good and the bad in totality. Being thorough in a decision is very important to me.
However, the unique thing about the stock market is it has no feelings. Computer programs literally ignore emotion. Machine learning and AI are currently trading against you and they don't care about the impeachment or a trade war.
I want our politicians to work together and solve problems. I think our present circumstances present a unique opportunity for unity. I'd suggest that border security is both digital and physical. Democrats want digital security from the Kremlin. Republicans want physical security on all borders. I suggest a comprise that all Americans want, complete security.
Please focus on making life better for all Americans, not just half of us.
I'd love to hear your feedback on the indicators listed. Leave them a like if they help you in anyway. I hope you take your money back today.

Gold up to $1500? Trade war seems to think so...Gold was recently looking really bearish as trade news started to flush out of the US that did not look to good for the remainder of the year and the schedule they had planned. A double bottom formed on Gold at $1447-1450 where price rallied and nearly hit $1490 on its way up. The idea here is that there is strong resistance at $1485-1490 based on the low volume node from the year to date volume profile and the previous structure support that is going to act as resistance this time through. Should that level break we can see a move into the year to date POC and ultimately the $1500, the $1490 area will act as support on the retrace lower as well. This upside can be further opened on gold if the trade talks continue to deteriorate over the next few weeks and it puts downside pressure on the US equity markets. If this area holds resistance and there are intraday rotations at the level then we could see another move down to $1445-1450.
Disclaimer: This idea is for educational purposes only, this does not constitute as investment or trading advice. TRADEPRO Academy is not responsible for any market activity.

A scaled entry plan for SOXLOne of the best long-term performers in the stock market is the semiconductor sector. With a strong likelihood that AI will change the world in the next 10-20 years and disrupt every other industry, there are big profits to be made in semiconductor companies that are heavily invested in AI research and provide the processors to power it.
That said, the current price point on SOXL is pretty high, so it makes sense to look for a lower entry. With the market (and especially the Nasdaq) turning downward this week on China trade war news, I've developed a scaled entry plan for SOXL. There are four entry points: the recent highs around 198, the high-volume node at 159, and the recent lows near 131 and 90. Normally I triple my position at each level, but I doubt we'll hit the bottom two targets on the current trade war news, so I'm weighting my entries a little more toward the two upper ones. I already made my first entry this morning near 198.

GJ IMPORTANT RED LINEObserve this red line, if daily close below it, still is sideway.
No way to shoot 90 pips for short period.

GU, where you want to go?i believe today movement is fake break out resistance zone. RSI already shoot over 80.
More seller will come in soon.

GOLD is depends on - TRUMP Tweeterhardly predict for gold sometimes.
At this moment, i still seeing is downtrend. But negative news for trade war. If day TF break 1480 level, i think it will continue up to next level.
temporary i will shorting it first,
SL 1482-1485.
TP 1475
TP 1463
TP 1453

ORBEX: Trump Dents Markets Days Before OPEC+In today’s market insights I talk about the massive Trump sell-off seen in the markets following his comments that a phase 1 trade deal could be now dragged later than the 2020 election.
Gold and Oil were affected by the pessimistic rhetoric as participants received the delay announcement!
The yellow metal appreciated while Crude oil jaw-dropped days ahead of the critical OPEC+ meeting in Vienna.
Watch me analyse the two #Commodities and what I expect in the short and medium-term using #ElliottWaves!
Timestamps
XAUUSD 1H 01:40
WTI 1H 04:15
Stavros Tousios
Head of Investment Research
Orbex
This analysis is provided as general market commentary and does not constitute investment advice.

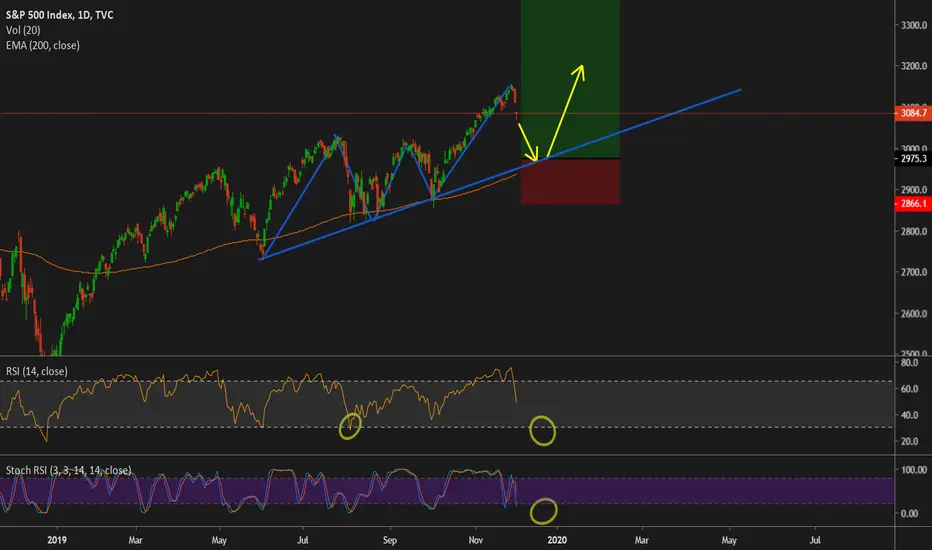
SPX Long After Trade Talk PullbackTVC:SPX
Looking for an SPX long entry of 2975. With trade talks looming from the president it is good to sit and wait for a market pullback for re entry. Both the fundamentals and technicals line up. Ascending triangle based on recent Daily candle trend and a bounce off of the 200 EMA.
Will currency wars replace commodity wars?In general, Monday began quite peacefully. China has been non-aggressive in its response to Trump who has signed into law a bill that supports pro-democracy protesters in Hong Kong. And it seemed that we were waiting for another boring day.
However, Trump once again showed why we prefer the sale of the dollar for a quite long time. He began the day by accusing Argentina and Brazil of understating their national currencies value to gain a competitive advantage for their products in the US market. In response, the President of the United States raised tariffs on the import of steel and aluminium from these countries.
Well, he continued with the Fed’s traditional accusations of overvaluation of the dollar and called on the Central Bank to weaken monetary policy and the dollar.
Markets took it as signals for sales of the American currency. Moreover, the buyers on the dollar were not happy with the data on the ISM Index in the US manufacturing sector: 48.1 pips with a forecast of 49.2 pips. Recall that an index value below 50 signals a deterioration in business activity in the US manufacturing sector.
Well, returning to Trump and his actions on Monday, in the light of such events, it’s premature to talk about the end of the trade wars. Rather, on the contrary, there is a reason to talk about the transition of trade wars to currency wars with the consequences that maybe even more devastating for the global economy. In general, the future looks rather bleak. In this regard, our recommendations to buy safe-haven assets remain relevant.
Our basic positions for today are: finding points for sales of the dollar, purchases of gold and the Japanese yen, sales of oil and the Russian ruble. We also note that while the period of low volatility continues on the foreign exchange market, it is worthwhile to continue aggressive trading on the intraday basis without obvious preferences, for which you can use watch oscillators.

Dax - Short Below Key Support Level We see the Dax moving lower towards 12500 as long as it consolidates below the key support level at 13172 as global market mainly drop on the back of Trump imposing steel tariffs on Brazil and Argentina. There are fears over the impact tariffs and trade wars are having on the global economy so we are look out for key data releases next week ending with non farm payrolls on Friday.

ORBEX: Has the Santa Rally Started Already?In today’s market insights I explain why equities are not affected by reports that China wants existing tariffs removed in order to proceed with phase one of a deal! Perhaps, investors couldn't care less about the consistent back and forth between US and China before they go home for Christmas...
I reveal how I expect the S&P500 to perform in December, and while at it, I also analyse the US index!
Stavros Tousios
Head of Investment Research
Orbex
This analysis is provided as general market commentary and does not constitute investment advice.
