Is a Reversal on the Horizon or a Deeper Correction? 🔘Gold Faces Strong Resistance at 3300 – Is a Reversal on the Horizon or a Deeper Correction? ⭐️
Gold has recently faced a significant price correction after bouncing off key resistance levels. As geopolitical events settle and economic data comes in, the market is now testing crucial support levels. Today’s session could provide important insights into whether gold will maintain its bullish momentum or continue to correct further.
🔹Market Overview – USD Rebounds, Creating Short-Term Pressure on Gold
The US dollar has seen a strong rebound following positive developments in the global trade talks. Several key agreements between major nations, including the US, have been signed, which seem to support the USD in the short term. This has put downward pressure on gold, as traders shift their focus towards a stronger dollar and risk appetite returning to the market.
🔹US inflation data has come in lower than expected, creating room for the Fed to hold off on rate hikes, which helps the dollar further.
🔹FOMC meeting minutes later this week could reveal insights into the Fed's stance on interest rates, which could be key for market direction.
🔹Geopolitical tensions are cooling off slightly, which has reduced demand for safe-haven assets like gold.
🔹Technical Analysis – Gold in a Range-Bound Market, Testing Key Levels
On the H1 chart, gold is forming a clear downward channel between 3360 and 3290, suggesting that the price could continue its correction within this range. If the price stays within this zone, we might see a deeper pullback toward the 3250 region.
However, as always, waiting for confirmation signals before entering any trades is crucial. The false breakout risk is high when the price moves quickly and without clear confirmation from higher timeframes.
🔹Buy Bias in the Short-TermGiven the current technical structure, a buy bias seems more likely than further selling. The market may test 3320-3325 in the near term, with the potential to bounce back if the buying momentum continues to build. Additionally, the rejection wick on the D1 candle from yesterday suggests that sellers are losing control, and we may see more buying pressure in the coming sessions.
🔹Resistance and Support Levels to Watch:
🔺Key Resistance Levels: 3302 – 3310 – 3324 – 3335 – 3361
🔻Key Support Levels: 3275 – 3259 – 3248
⬜️Trading Strategy – Buy and Sell Zones
🔺BUY ZONE:3250 – 3248
🔹Stop Loss: 3244
✔️Take Profit: 3254 → 3258 → 3262 → 3266 → 3270 → 3280 → ????
🔺SELL SCALP: 3303 – 3305
🔹Stop Loss: 3310
✔️Take Profit: 3298 → 3294 → 3290 → 3286 → 3280 → 3270 → 3260
🔺SELL ZONE:3334 – 3336
🔹Stop Loss: 3340
✔️Take Profit: 3330 → 3326 → 3320 → 3315 → 3310 → 3305 → 3300 → ????
🕖Important Notes for Today: FOMC and Trade Policy Updates
With FOMC minutes and other important trade policy updates expected today, it’s crucial to stay alert for any sudden changes in market sentiment. Always ensure that you are adhering to your TP/SL levels to safeguard your account.
Trading-forex

#AN018: Summer shock, tariffs, Fed delays, and the dollar's shif
In recent days, the forex world has experienced a sequence of key events that could redefine the global currency landscape in the coming months. Risk to the dollar has become structural, the threat of tariffs is multiplying again, and the combination of geopolitical uncertainty and monetary policy creates an extremely risky mix for exchange rates.
Let's start with the Fed minutes: Jerome Powell attributed tariff risk to the main reason for postponing possible rate cuts. Market expectations are realigning toward a longer rate cycle, fueling a climate of global uncertainty. At the same time, Goldman Sachs warns that the dollar is increasingly moving as a "risky" currency, correlated with equity markets—an emerging market rather than a safe haven.
On the geopolitical front, President Trump has relaunched the trade war: announcements of tariffs of up to 35% on Canada, up to 20% on Europe, and 50% on copper from Brazil have caused futures volatility to soar and sent the dollar into a short-term rally. But Deutsche Bank is sounding the alarm: the summer period of low liquidity and rising trade tensions represents a potential trigger for prolonged currency turbulence.
The Financial Times envisions a scenario in which the dollar loses ground as the dominant currency, ushering in a multipolar currency world in which the euro, renminbi, gold, and even cryptocurrencies could gain ground.
The impact on Forex:
USD: The narrative is changing: no longer a net safe haven, but an asset correlated with political and risk cycles. The weakness of the DXY index in the first half of 2025 (-10%) reflects this transition.
EUR/USD: Potentially favored if the dollar continues its consolidation. However, new tariffs and US-EU uncertainty could provide temporary support for the greenback.
USD/JPY and USD/CHF: These crosses will be subject to greater volatility, with the next catalyst being the Fed minutes and the timing of tariffs. Safe-haven currencies strengthen during periods of uncertainty.
CAD, AUD, NZD: penalized by tariffs on Canada and Brazil and a weak dollar. OPEC+ and geopolitical tensions could boost commodities, but data confirmation is needed.
Commodity cross-correlation: USD/CAD could rebound if oil loses momentum, while AUD/JPY is sensitive to both the RBA and increased global risk.
Conclusion:
The current currency environment appears unstable and sensitive to political and trade developments. Summer volatility could persist, and those who can read the macro and institutional signals (Fed, tariffs, geopolitics) will have the opportunity to enter accurately. Until a stable direction emerges, EUR/USD looks like the most interesting cross to capture a potential structural correction in the dollar.

GBPNZD | Potential Buy opportunityHey Traders!
We’re taking a shot on GBPNZD — it looks like a solid setup for a move to the upside. Price is currently sitting right on the 4H 50MA, and the 1H 200MA is also aligned at the exact same level, giving this zone even more weight. Our stop loss is tight, risking just a 1:1 minimum, so the downside is limited. On top of that, the Fib is drawn from top to bottom and the 0.5 level lines up perfectly with this area, which adds another layer of confidence. If this zone holds, there’s a good chance we’ll see price continue pushing up.

#AN017: Dirty Levels in Forex: How Banks Think
In the world of Forex, many retail traders are accustomed to seeking surgical precision in technical levels. Clear lines, pinpoint support, geometric resistance. But the truth is that the market doesn't move in such an orderly fashion.
I'm Forex Trader Andrea Russo, and I thank my Official Broker Partner in advance for supporting us in writing this article.
Institutions—banks, macro funds, hedge funds—don't operate to confirm textbook patterns. Instead, they work to manipulate, accumulate, and distribute positions as efficiently as possible. And often, they do so precisely at the so-called "dirty levels."
But what are these dirty levels?
They are price zones, not individual lines. They are areas where many traders place stop losses, pending orders, or breakout entries, making them an ideal target for institutional players. The concept of a dirty level arises from the fact that the price fails to respect the "perfect" level, but breaks it slightly and then retraces its steps: a false breakout, a trap, a hunt for stops.
Banks are very familiar with the behavior of retail traders. They have access to much more extensive information: aggregated positioning data, open interest in options, key levels monitored by algorithms. When they see concentrations of orders around a zone, they design actual liquidity triggers. They push the price just beyond the key level to "clean" the market, generate panic or euphoria, and then initiate their actual trade.
How are these levels identified?
A trader who wants to operate like an institution must stop drawing sharp lines and start thinking in trading bands. A dirty level is, on average, a zone 10 to 15 pips wide, around a psychological level, a previous high/low, or a breakout area. But technical structure alone is not enough. It's important to observe:
Volume density (volume profile or book visibility)
Aggregate retail sentiment (to understand where stops are placed)
Key option levels (especially gamma and maximum pain)
Rising open interest (as confirmation of institutional interest)
When a price approaches a dirty level, you shouldn't enter. You should wait for manipulation. The price often briefly breaks above that range, with a spike, and only then does it retrace its steps in the opposite direction. That's when banks enter: when retail has unloaded its positions or been forced into trading too late. The truly expert trader enters after the level has been "cleaned," not before.
This type of reading leads you to trade in the opposite way to the crowd. It forces you to think ahead: where they want you to enter... and where they actually enter. And only when you begin to recognize these invisible patterns, when you understand that the market is not linear but designed to deceive you, do you truly begin to become a professional trader.
Conclusion?
Trading isn't about predicting the price, but predicting the intentions of those who actually move the market. Dirty levels are key. Those who know how to read manipulation can enter profitably, before the real acceleration. And from that moment, they'll never look back.

#008: GBP/NOK SHORT OPPORTUNITY
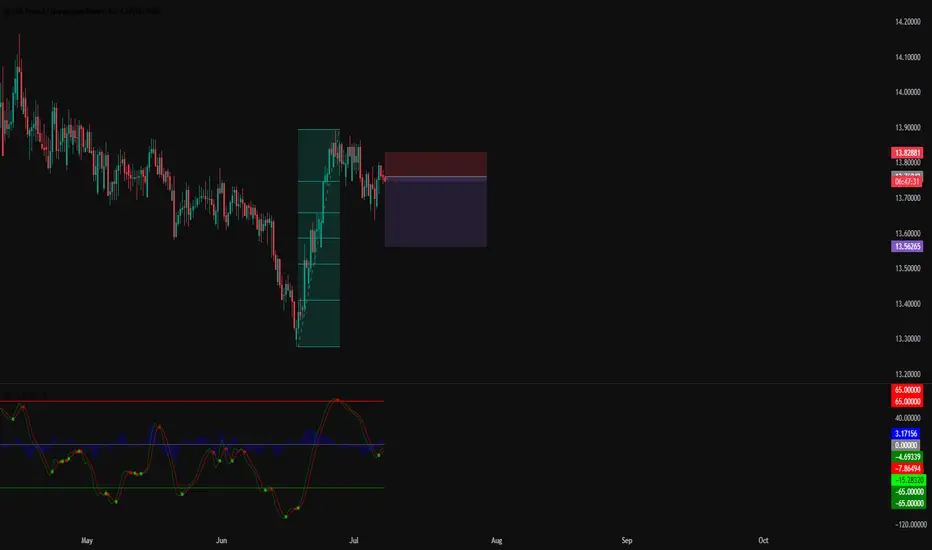
Hi, I'm Forex Trader Andrea Russo and today I want to show you this GBP/NOK SHORT opportunity. After a strong upside extension, GBP/NOK is showing signs of exhaustion just below the key resistance zone of 13.83. I thank in advance my Official Broker Partner PEPPERSTONE for the support in writing this article.
📍 Technical Context
The pair has recently formed a local double top with declining bullish momentum. Price action around the highs is becoming increasingly choppy, suggesting the presence of smart investors preparing a possible reversal.
A clear rejection from the 13.82-13.83 zone triggered the short setup, with confirmation coming from broader market dynamics and a favorable risk/reward structure.
🔍 Macro Overview
The British pound remains under pressure as uncertainty over the Bank of England's next rate decision weighs on the currency.
The Norwegian krone finds support in stable oil prices and expectations of relatively tight monetary policy.
This macro imbalance creates a favorable backdrop for a potential downside continuation.
This setup aligns both technical exhaustion and cross-market forces, while sentiment data reveals a bearish bias among retail on GBP/NOK, often a good time to ease pressure.
🔄 Next Steps
As always, I will be monitoring the price action on a candle-by-candle basis. If the downside momentum confirms, the pair could retest the 13.56 support in the coming sessions.
📌 Stay tuned for live updates and trade management.
XAUUSD Below 3300 – Buying Opportunity or Trap? Gold Breaks Below 3300 – A Buying Opportunity or Sign of Deeper Correction?
🧭 Weekly Kickoff: Is the Sell-off Really That Dangerous?
At the start of the week, gold experienced a sharp drop to 3306 USD, breaking through the psychological 3300 support level and testing the 329x region. However, this isn't necessarily a sign of a sustainable downtrend — it's more likely a liquidity sweep before the market consolidates again for a bigger move.
🌐 Macro Updates Impacting Gold:
US inflation continues to ease, providing space for the Fed to loosen policy if needed.
FOMC minutes due soon — markets will be closely watching for clues about possible rate cuts.
Tensions in Gaza de-escalate temporarily, leading to a slight reduction in demand for safe-haven assets.
Trump's new tax bill has been passed, adding pressure to US public debt.
US–China trade war may be delayed — reducing short-term geopolitical pressure.
In summary, we are in a consolidation phase, with a high probability of a breakout in the coming days.
📉 Technical Analysis – CP Pattern in Focus
We are seeing a Continuation Pattern (CP), which generally signals that the current correction is a pause before the trend continues.
After rejecting resistance at 3336, gold fell, breaking through the 3323 support and quickly testing the 3303 zone, a key short-term support.
If gold breaks below 3293, the next target will be the 3278 USD liquidity zone, where strong buying could emerge.
📌 Key Trading Plan – 04 July
🔵 BUY ZONE
3294 – 3292
Stop Loss: 3288
Take Profit: 3298 → 3302 → 3306 → 3310 → 3315 → 3320 → 3330
🔴 SELL SCALP
3324 – 3326
Stop Loss: 3330
Take Profit: 3320 → 3316 → 3312 → 3308 → 3304 → 3300
🔴 SELL ZONE
3350 – 3352
Stop Loss: 3356
Take Profit: 3346 → 3340 → 3335 → 3330 → 3320
🧠 Market Sentiment Today
The market is currently in a consolidation phase, likely trading sideways between 3320 and 3340. A breakout seems likely once the liquidity from the US holiday subsides.
✅ Primary Bias: Look to buy dips into support zones.
⚠️ Alternative View: Only consider selling if price clearly rejects key resistance levels.
💬 What’s Your View on Gold Today?
Do you think gold will break through 3390 soon, or is there more room for a deeper correction towards 3270?
👇 Share your thoughts and analysis in the comments below!
Gold Consolidating Ahead of Next Move Gold Consolidating Ahead of Next Move – Is 3390 the Bull Target or a False Breakout Trap?
🧭 Fundamental Outlook
Gold has entered a tight consolidation phase following a wave of high-impact macroeconomic events:
The US House of Representatives has passed Trump's “Super Bill”, raising expectations of increased fiscal spending and long-term inflationary pressures. In theory, this is supportive of gold prices.
However, strong NFP and Unemployment Rate figures released recently have reinforced dollar strength in the short term, suggesting the Fed may delay rate cuts → a temporary headwind for gold.
With Independence Day in the US, liquidity across global markets is expected to drop, increasing the risk of false moves or stop-hunt volatility.
🟡 The lack of immediate upside doesn’t mean bullish momentum has disappeared. Price may simply be building energy before its next leg.
📉 Technical Overview – XAU/USD
Gold has broken out of a minor descending trendline and is now testing a key supply zone around 3344–3345, which could determine the intraday trajectory.
🔍 Key Levels
Resistance Zones: 3345 – 3362 – 3374 – 3388 – 3390
Support Zones: 3330 – 3312 – 3304 – 3302 – 3298
🟢 Bullish Scenarios (Buy Setups)
📍 Intraday Buy Zone:
3313 – 3311
Stop Loss: 3307
Take Profit: 3316 – 3320 – 3325 – 3330 – 3335 – 3340 – 3345 – 3350
📍 Deep Pullback Buy Zone:
3304 – 3302
Stop Loss: 3298
Take Profit: 3308 – 3312 – 3316 – 3320 – 3330 – 3340
These zones are ideal for trend-continuation entries, especially if supported by bullish candles or price action on lower timeframes.
🔴 Bearish Scenarios (Short-Term Only)
📍 Intraday Sell Zone:
3362 – 3364
Stop Loss: 3368
Take Profit: 3358 – 3354 – 3350 – 3346 – 3340 – 3335 – 3330
📍 High-Risk Sell Zone:
3388 – 3390
Stop Loss: 3394
Take Profit: 3384 – 3380 – 3376 – 3370 – 3365 – 3360
Bearish positions should be reserved for signs of exhaustion or rejection patterns at resistance levels.
🧠 Trading Bias for Today
With limited liquidity due to the US holiday, price may remain trapped in a sideways range between 3320 and 3340. Traders should stay nimble and avoid overexposure.
✅ Primary bias: Buy dips near major support
⚠️ Alternative view: Only short if price confirms reversal at resistance
💬 What’s Your Take on Gold Today?
Will gold break through the 3390 barrier this week?
Or are we looking at one more dip before a true bullish continuation?
👇 Share your thoughts and trading ideas in the comments!

Gold Ready to Explode Ahead of NFP and Trump’s “Super Bill”?Gold Ready to Explode Ahead of NFP and Trump’s “Super Bill”? | Global Macro Focus
🌍 MACRO UPDATE – What the World is Watching:
Gold continues its bullish trajectory as the USD weakens sharply following last night’s disappointing ADP jobs report (-33K vs expected +99K). This soft labour data has fueled further speculation that the Fed could begin rate cuts as early as September, with a 90% probability now being priced in.
In the political arena, Donald Trump’s recent statement that House Republicans are aligned to push forward a so-called “Super Bill” has triggered fresh uncertainty around US fiscal policy. This could elevate safe-haven demand for gold, especially if it leads to increased tensions over debt ceilings or government spending.
With the US Non-Farm Payrolls (NFP) due later today and the UK and US markets heading into a long weekend, traders should brace for heightened volatility and liquidity gaps.
📈 TECHNICAL OUTLOOK – What the Charts Are Saying:
Overall Trend: Bullish structure remains intact as gold breaks and holds above 3365.
EMA Setup: Price trades above EMA 13/34/89/200 – signaling strong upside momentum.
Fair Value Gap (FVG): 3374 – 3388 area remains an unfilled FVG zone; possible magnet for short-term price action.
Key Resistance Levels: 3365, 3374, 3380, 3388, 3393
Key Support Levels: 3343, 3335, 3325, 3316, 3304
Trendline & Structure: The ascending trendline from 3316 remains unbroken, providing a potential bounce point if price corrects.
🎯 TRADE SETUPS – Strategic Zones to Watch:
🔵 Buy (Short-Term Scalp):
Entry: 3335 – 3333
SL: 3329
TP: 3340 → 3350 → 3360 → 3370
🟢 Buy Zone (Swing Perspective):
Entry: 3316 – 3314
SL: 3310
TP: 3320 → 3336 → 3350 → 3360
🔴 Sell Scalp (Reversal Zone)
Entry: 3374 – 3376
SL: 3380
TP: 3370 → 3360 → 3350
⚠️ Sell Zone (High-Risk Rejection):
Entry: 3388 – 3390
SL: 3394
TP: 3380 → 3370 → 3360
🔎 NOTE FOR GLOBAL TRADERS:
With UK markets partially closed and US session shortened ahead of the Independence Day holiday, liquidity may be thin and volatility could spike unexpectedly. Always place stop-loss and avoid emotional entries near key resistance.
💬 Do you believe gold can break and close above the FVG zone (3388) before the weekend volatility hits full throttle? Let’s discuss.

#007: LONG EUR/MXN Investment OpportunityHi, I'm Andrea Russo and today I want to talk to you about this long investment opportunity on EUR/MXN.
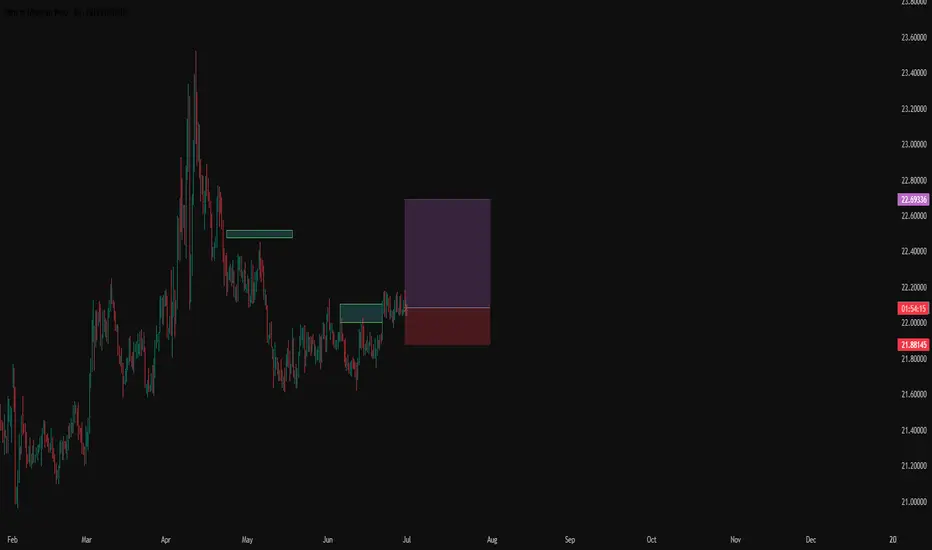
After a careful analysis of institutional flows, market sentiment and macroeconomic dynamics between Europe and Mexico, I have identified a potential medium-term long opportunity on this currency pair, often overlooked by retail traders but closely followed by professional operators for its hybrid technical-fundamental structure. I would like to thank in advance the Official Partner Broker PEPPERSTONE who supported us in creating this technical analysis.
🔍 Technical and strategic context
In recent days, EUR/MXN has shown typical institutional accumulation behavior: prolonged congestion on key levels, progressive decrease in volatility, increase in volume anomalies on bearish spikes and presence of clear defenses on strategic support areas.
All this while retail positioning remains strongly unbalanced short, with over 75% of retail operators selling this pair in the current area. Historically, when such extreme levels of imbalance are reached, the likelihood of an institutional-driven reversal increases significantly.
🧠 Expected Behavior and Institutional Dynamics
Large financial institutions – including global banks and hedge funds – never enter “on cue”: they enter when the market is ready for them to win. This often happens after retail has positioned itself heavily against the upcoming move, and that is exactly what we are seeing these hours.
EUR/MXN is a high-yielding pair: the Mexican peso often benefits from favorable carry trades, but is also highly exposed to geopolitical tensions (such as the current US-Iran turmoil) and the overall direction of the US dollar and the euro. In this environment, with a stable euro and rising systemic risk, the natural flow tends to move away from the Mexican peso, making long EUR/MXN particularly attractive.
🎯 Operational positioning and objectives
My entry occurred on a well-defined compression zone, with a protected technical stop loss and a target calculated on structure, volumes and previous similar breakouts. The target is an area around 22.73, where institutional profit taking is likely to arrive.
It should be noted that the entire current structure is built on protection zones generated by passive orders: we know that in EUR/MXN these levels have historically caused strong rebounds when reached.
📊 Conclusion
This trade is not simply a directional bet. It is the thoughtful execution of a model based on the behavior of large operators, market psychology and advanced analysis of capital flows. It is not about "predicting the future", but positioning yourself at the same time as the strong hands do, exploiting their own rules.
My goal is to operate like a hedge fund does, and in this trade on EUR/MXN I see all the conditions for this to happen.
#AN013: USD and AUD under pressure, Euro advances
1. India: New strategy on FX volatility
The Indian Respondents' Bank (RBI) is allowing more volatility on the USD/INR exchange rate, prompting many companies to hedge with forward contracts. This is the highest level of coverage since 2020.
We thank in advance our Official Broker Partner PEPPERSTONE who supported us in writing this article.
FX Impact:
Potential weakening of the rupee in the short term, but increased stability in the medium-long term.
Volatility on USD/INR, EUR/INR, JPY/INR ? opportunities for carry trades and short-term shorts if the dollar strengthens.
2. Australia hit by extreme storms
Severe storms hit New South Wales, Queensland and Victoria: 100 km/h winds, torrential rains and blackouts on over 30,000 homes.
Australian economic sentiment pressured ? AUD weak.
Opportunities on AUD/USD, AUD/JPY and AUD/NZD from a short perspective.
Monitor agricultural and insurance developments ? risk of extended downside.
3. Iran: Fordow nuclear site severely damaged
US strike hits Iranian nuclear site. In response, Iran has threatened to mine the Strait of Hormuz, a critical point for global oil transport.
Geopolitical volatility expected to rise.
Increased flows to safe haven currencies: JPY, CHF and USD.
Also impacting CAD and AUD due to oil ? risk of short-term upside but corrections if stalemate persists.
4. US $3.3 trillion fiscal package under discussion
Senate considering mega stimulus plan. This fuels fears of new debt ? dollar falls to 4-year low against euro.
EUR/USD long strengthened (break above 1.17 already underway).
GBP/USD and NZD/USD potentially in push.
Risk of FED rate cut? increased volatility on dollar and bonds.
Strategic Conclusion
Recommended operations: long on EUR/USD, short on AUD/USD, long on USD/INR (only with confirmation).
Watch out for the next 48 hours: possible spike on CHF, JPY and CAD.
Institutional timing: probable fund inflows on EUR and USD in case of confirmed breakouts; stay ready but avoid front-running.
Stay updated for other news.

Will Gold Continue Its Strong Rally or Face a Pullback?XAUUSD 02/07: Will Gold Continue Its Strong Rally or Face a Pullback?
📉 Technical Analysis – Gold Faces Short-Term Pullback After Strong Rally
Gold has been experiencing a clear rally in recent days, but it’s currently undergoing a brief correction. The price has recently dropped slightly, prompting traders to keep a close eye on key levels for potential reversal or continuation of the bullish move.
🌍 Macroeconomic Context – Factors Impacting Gold's Price
USD Fluctuation: The weakness in the US Dollar continues to affect gold prices, creating opportunities for the precious metal to maintain its upward movement.
Geopolitical Tensions: Ongoing global tensions, including the US-Iran conflict, act as a safe-haven factor, supporting gold demand.
Interest Rate Expectations: The market is closely watching for any changes in interest rate policies. Any future rate cuts by the Fed could further bolster gold's price.
📊 Technical Outlook (H1 – H4 – D1)
Short-Term Trend: On the H1 timeframe, the price of gold touched a key level near 3340. From there, the price began to experience a pullback. However, the upward momentum remains strong on higher timeframes.
Key Support Levels: The 3300 level remains a crucial support. If the price stays above this, there’s a chance for gold to continue rising towards higher levels.
Key Resistance Levels: 3360 and 3380 are critical resistance levels. If breached, gold could move towards new highs.
📍 Important Support and Resistance Levels:
🔺 Resistance: 3345 – 3360 – 3380 – 3400
🔻 Support: 3300 – 3290 – 3270 – 3250
💡 Trading Plan for Today, 02/07:
🔵 BUY ZONE:
📈 Entry: 3305 – 3303
📉 SL: 3297
💰 TP: 3315 → 3325 → 3340 → 3360
🔴 SELL ZONE:
📉 Entry: 3360 – 3362
📈 SL: 3368
💰 TP: 3350 → 3340 → 3320
📣 Conclusion:
Gold is showing signs of short-term correction but remains a strong asset due to geopolitical factors and monetary policies. Buying opportunities continue to be attractive at support levels, while key resistances will play a crucial role for any breakout. Keep an eye on the mentioned levels to capitalize on market movements.
Happy trading and best of luck to all traders!

USDCHF Will Go Lower! Sell!
Here is our detailed technical review for USDCHF.
Time Frame: 2h
Current Trend: Bearish
Sentiment: Overbought (based on 7-period RSI)
Forecast: Bearish
The market is approaching a significant resistance area 0.792.
Due to the fact that we see a positive bearish reaction from the underlined area, I strongly believe that sellers will manage to push the price all the way down to 0.785 level.
P.S
Overbought describes a period of time where there has been a significant and consistent upward move in price over a period of time without much pullback.
Disclosure: I am part of Trade Nation's Influencer program and receive a monthly fee for using their TradingView charts in my analysis.
Like and subscribe and comment my ideas if you enjoy them!

XAUUSD Analysis – 01/07: Gold Sees a Rebound Amid USD WeaknessXAUUSD Analysis – 01/07: Gold Sees a Rebound Amid USD Weakness – Is a Recovery on the Cards?
As we enter the new month, gold prices are showing signs of recovery after a significant drop, primarily driven by the weakening of the US Dollar. However, despite some positive momentum, the path to sustained growth remains uncertain.
💵 USD Weakness Fuels Gold's Potential Rebound
Recent US economic data shows a slight decrease in consumer spending, which has led to speculation that the Federal Reserve may ease interest rate hikes in the near future.
This, in turn, has contributed to a weaker USD, providing an opportunity for gold to recover slightly.
⚖️ The Federal Reserve's Role Remains Critical
The markets are awaiting further clues on the Federal Reserve's next moves, especially with the ongoing debate about the potential direction of interest rates.
While the recent economic data isn't weak enough to force a policy reversal, it hasn't been strong enough to give the Fed the confidence to continue its hawkish stance either.
🧠 What Does This Mean for Traders?
Gold is responding to macroeconomic factors but still lacks a clear, strong trend.
Volatility remains high, with sharp price fluctuations occurring after key economic and political announcements. This uncertainty suggests gold might not yet have the momentum for a definitive break-out or trend reversal.
🔶 Summary:
Gold is starting to recover after a tough month but the outlook remains cautious.
Buyers are hoping for a Fed rate cut, while sellers are banking on the USD's strength.
Traders should stay vigilant, waiting for clear confirmation before making major moves.
📊 Key Levels to Watch:
Resistance Levels: 3358 – 3360 – 3364 – 3375 – 3380
Support Levels: 3300 – 3290 – 3280 – 3275
🎯 Trading Strategy:
🔵 Buy Zone:
Entry: 3310 – 3315
SL: 3300
TP: 3320 – 3330 – 3340 – 3350 – 3360
🔴 Sell Zone:
Entry: 3370 – 3375
SL: 3380
TP: 3360 – 3350 – 3340 – 3325
⚠️ Final Thoughts:
With USD weakness persisting, gold may continue its rebound, but the market remains uncertain.
Keep an eye on macroeconomic data and geopolitical events, as they will likely shape gold's next move.

GBP/CAD (Two Trade Recaps) EUR/NZD Long and GBP/JPY LongEUR/NZD Long
Minimum entry requirements:
- If tight non-structured 15 min continuation forms, 5 min risk entry within it if the continuation is structured on the 5 min chart or reduced risk entry on the break of it.
- If tight structured 15 min continuation forms, reduced risk entry on the break of it or 15 min risk entry within it.
- If tight non-structured 1H continuation forms, 15 min risk entry within it if the continuation is structured on the 15 min chart or reduced risk entry on the break of it.
- If tight structured 1H continuation forms, 1H risk entry within it or reduced risk entry on the break of it.
GBP/JPY Long
Minimum entry requirements:
- Tap into area of value.
- 1H impulse up above area of value.
- If tight non-structured 15 min continuation follows, 5 min risk entry within it if the continuation is structured on the 5 min chart or reduced risk entry on the break of it.
- If tight structured 15 min continuation follows, reduced risk entry on the break of it or 15 min risk entry within it.

30/06 WILL WE SEE A RECOVERY ON THE LAST DAY OF THE MONTH? ↗️GOLD PLAN – 30/06: WILL WE SEE A RECOVERY ON THE LAST DAY OF THE MONTH? ☄️
✅ Macro Context – Focus on USD Debt and Political Pressure
Today marks the final trading day of June, and the U.S. faces a $6 trillion debt maturity from Covid-era borrowings, which may impact USD liquidity and market sentiment.
During the Asian session, gold experienced a sharp drop to the 32xx area before bouncing back and is now hovering near last week's close.
While the medium-term structure remains bearish, short-term signals suggest a potential reversal and recovery.
✅Political Catalyst:
→ Trump is pressuring the Federal Reserve to cut interest rates to 1%-2%, stating he won’t appoint anyone unwilling to ease policy.
→ This raises expectations of future rate cuts, which could support gold prices in the near term.
✅ Technical Outlook – Multi-timeframe Structure
On the higher timeframes, gold continues to correct lower.
However, short-term candles are showing recovery momentum, with buyers absorbing around the 327x zone.
Today’s strategy: prioritize short-term BUY setups aligned with the recovery wave.
✔️Key Resistance & Support Levels
🔺Resistance: 3283 – 3291 – 3301 – 3322
🔻Support: 3277 – 3271 – 3259 – 3247
🔖Trade Scenarios
✅Buy Scalping
🔺Entry: 3272 – 3274
🔹SL: 3268
✔️TP: 3282 – 3288 – 3298
✅Buy Zone
🔺Entry: 3249 – 3251
🔹SL: 3244
✔️TP: 3265 – 3282 – 3295 – 3310
💠Sell Scalping
🔺Entry: 3298 – 3300
🔹SL: 3304
✔️TP: 3292 – 3282 – 3270
💠Sell Zone
🔺Entry: 3327 – 3329
🔹SL: 3333
✔️TP: 3322 – 3310 – 3298 – 3282
⚡️ Final Note
As this is the month-end session, expect possible volatility driven by USD flows and institutional rebalancing.

GBPUSD Will Move Lower! Short!
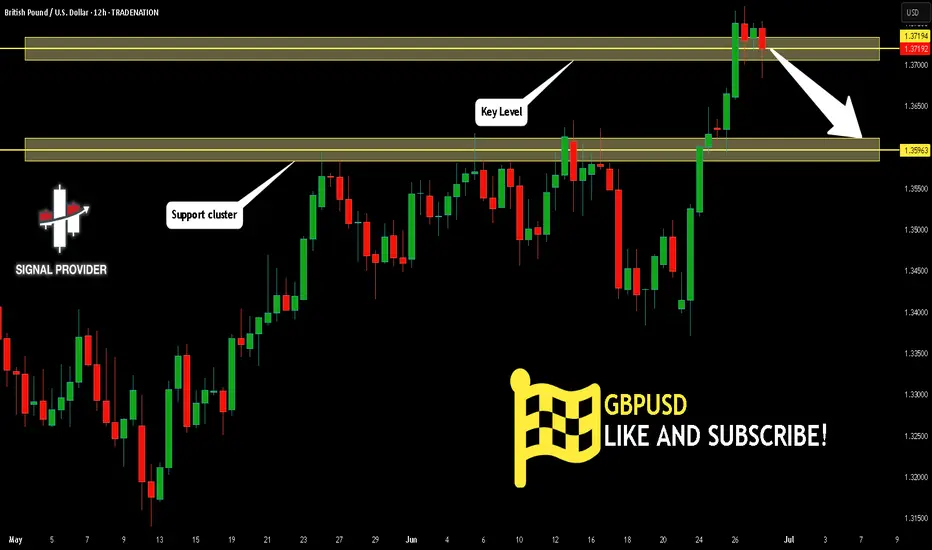
Please, check our technical outlook for GBPUSD.
Time Frame: 12h
Current Trend: Bearish
Sentiment: Overbought (based on 7-period RSI)
Forecast: Bearish
The market is approaching a key horizontal level 1.371.
Considering the today's price action, probabilities will be high to see a movement to 1.359.
P.S
We determine oversold/overbought condition with RSI indicator.
When it drops below 30 - the market is considered to be oversold.
When it bounces above 70 - the market is considered to be overbought.
Disclosure: I am part of Trade Nation's Influencer program and receive a monthly fee for using their TradingView charts in my analysis.
Like and subscribe and comment my ideas if you enjoy them!
EURUSD: Support & Resistance Analysis for Next Week 🇪🇺🇺🇸
Here is my latest structure analysis
and important supports & resistances for EURUSD for next week.
Consider these structures for pullback/breakout trading.
❤️Please, support my work with like, thank you!❤️
I am part of Trade Nation's Influencer program and receive a monthly fee for using their TradingView charts in my analysis.

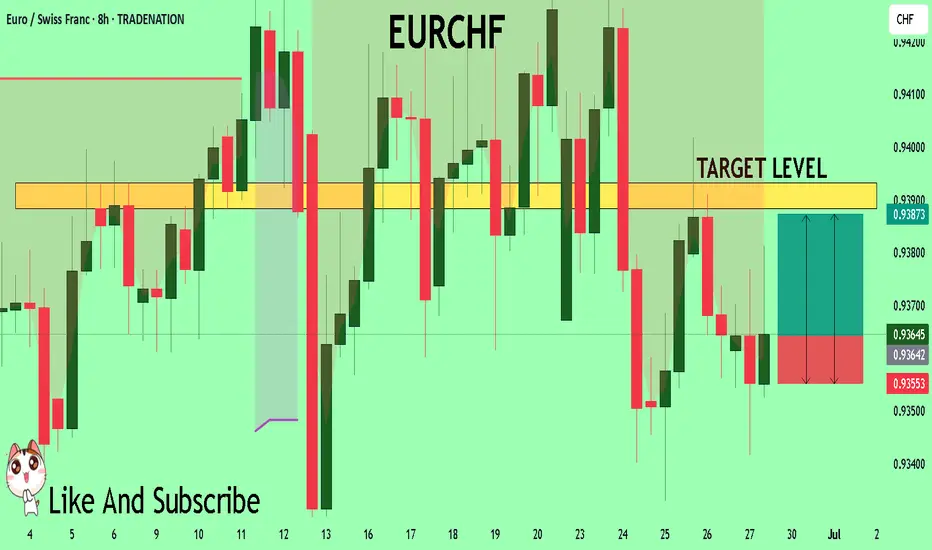
EURCHF Massive Long! BUY!
My dear friends,
Please, find my technical outlook for EURCHF below:
The price is coiling around a solid key level - 0.9364
Bias - Bullish
Technical Indicators: Pivot Points Low anticipates a potential price reversal.
Super trend shows a clear buy, giving a perfect indicators' convergence.
Goal - 0.9388
Safe Stop Loss - 0.9355
About Used Indicators:
The pivot point itself is simply the average of the high, low and closing prices from the previous trading day.
Disclosure: I am part of Trade Nation's Influencer program and receive a monthly fee for using their TradingView charts in my analysis.
———————————
WISH YOU ALL LUCK
XAUUSD D1 Forecast: Gold at Pivotal 325x Support What's Next for the Yellow Metal?
Today, we're zooming out to examine the broader picture for Gold (XAUUSD) on the Daily (D1) timeframe. Our latest analysis indicates that Gold has encountered a very strong, critical support level around the 325x region. This is a pivotal point that could significantly influence Gold's medium to long-term direction!
🌍 Macroeconomic Landscape: The Underlying Forces Influencing Gold
While we've observed a degree of USD weakness stemming from speculations around the Federal Reserve (such as the rumours regarding Jerome Powell's replacement) and expectations of interest rate cuts, these factors haven't fully countered Gold's recent decline on the daily chart. Furthermore, the sustained ceasefire between Israel and Iran continues to temper Gold's appeal as a safe-haven asset.
Nevertheless, the current price action at the robust 325x support level presents a significant technical signal. The impact of forthcoming US macroeconomic data (particularly the PCE Price Index on Friday) and speeches from FOMC members will be crucial in confirming or negating our projected movements for Gold. Should positive news for Gold align with this support holding, it could act as a potent catalyst.
📊 XAUUSD D1 Technical Analysis: Projecting Gold's Next Move
Given that Gold has reached strong support at 325x, we can anticipate the following scenarios:
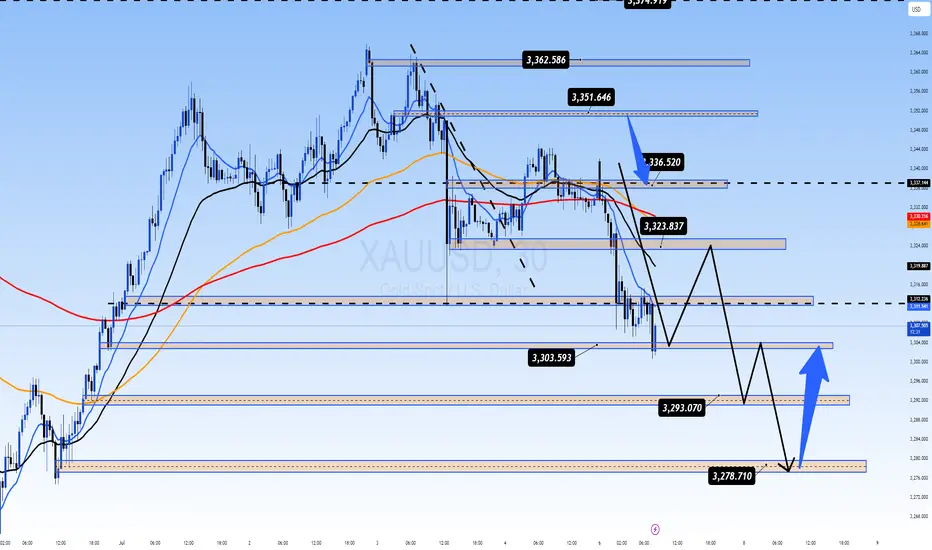
Bounce from 325x (Potential Upside Phase):
If the 325x area (which reinforces the 3264.400 support from image_e9d325.png) holds firm, we expect a strong reaction and an upward move for Gold.
The initial target for this bounce would be the 332x region, aligning with resistance levels 3313.737 - 3330.483 from our previous analysis. On a broader timeframe (as illustrated in image_83845c.png), this corresponds to the resistance zone around 3326.022. This 332x area might represent a continuation pattern, suggesting it could be a corrective rally before the resumption of the larger trend.
Resumption of Downtrend (After Reaching 332x):
Once Gold reaches and tests the 332x zone (3313.737 - 3330.483 / 3326.022) and exhibits bearish confirmation signals (e.g., a strong bearish engulfing candle, a pin bar, or a clear top formation), we anticipate a resumption of the downward movement.
The next major target for this decline would be the 317x area, which correlates well with the strong support at 3173.052 on the larger timeframe (as depicted in image_83845c.png).
🎯 XAUUSD D1 Trading Plan: Your Long-Term Strategy Ahead!
Considering the current D1 analysis, here's our actionable plan:
1. BUY PHASE (Bounce from Support):
Entry: Observe price reaction in the 325x - 326x zone (specifically 3264.400). Only consider buying if there are clear bullish confirmations (e.g., a confirmed bullish pattern on the daily or 4-hour candle, a strong bounce from the zone with significant volume).
SL (Stop Loss): Position just below the 325x support zone (e.g., 3245-3240, depending on confirmation).
TP (Take Profit): 3280 - 3284 - 3290 - 3295 - 3300 - 3305 - 3310 - 3313.737 - 3320 - 3326.022 (key 332x zone). This will be our primary target for the potential bounce.
2. SELL PHASE (Downtrend Resumption):
Entry: Once the price reaches and tests the 332x zone (3313.737 - 3330.483 / 3326.022) and shows bearish confirmation signals (e.g., a strong bearish engulfing, pin bar, or clear top formation).
SL (Stop Loss): Position slightly above the 332x zone (e.g., 3335-3340).
TP (Take Profit): 3326 - 3320 - 3316 - 3310 - 3305 - 3300 - 3295 - 3290 - 3280 - 3200 - 3173.052 (final 317x target).

XAUUSD Daily Update: Gold Enters "Strong Bearish MomentumXAUUSD Daily Update: Gold Enters "Strong Bearish Momentum" – Where Are the Opportunities?
Hello TradingView Community!
Hot news from the Gold (XAUUSD) market today! We've just closely analyzed the Daily Chart and spotted a crucial signal: Gold's downward momentum is extremely strong and clear! This indicates that the short-term trend may have shifted, or selling pressure is currently overwhelming other supporting factors.
🌍 Current Macroeconomic Context (A Multi-faceted View):
Previously, we discussed how a weaker USD might support Gold. Indeed, concerns about the Fed's independence (due to rumors of Powell's replacement) and expectations of Fed rate cuts have pushed the USD lower, typically a positive for Gold.
However, the market isn't driven by just one factor. The sustained ceasefire between Israel and Iran is reducing Gold's safe-haven demand. It appears that, at present, factors like decreased safe-haven demand and potentially strong technical breakdowns are prevailing, creating significant selling pressure on the daily timeframe. We also need to emphasize that the market remains very cautious about confirming a bottom for Gold, and we are still awaiting crucial US economic data (especially PCE on Friday) and FOMC speeches.
➡️ In summary: While a weaker USD theoretically supports Gold, the price action on the daily chart clearly shows bears are dominating. We must respect this signal and adjust our strategy accordingly.
📊 XAUUSD Technical Analysis (Focus on Daily Chart - Strong Bearish Momentum!):
Based on the strong bearish signal from the Daily timeframe and key price levels from the chart (image_e9d325.png):
Primary Trend on Daily: Clearly strong bearish momentum. Large, consecutive bearish candles breaking previous support zones indicate overwhelming selling pressure.
Resistance Zones (Potential SELL Opportunities - where price might retrace before falling further):
3313.737 - 3315: This is the nearest and most important resistance area. If the price retraces here, it could present an opportunity to sell.
3321.466 - 3330.483: A stronger resistance zone, if price retraces deeper.
3341.947: Extremely strong resistance, unlikely to be reached in this context unless there's a major trend-reversing news event.
Support Zones (BUY Opportunities - extremely cautious, only for Scalp or clear reversal signals):
3294.414: Immediate support, but could be easily broken if bearish momentum persists.
3276.122: The next support area if the price continues to fall.
3264.400: This is a very strong support and a potential downside target if bearish momentum holds. Consider BUYs here only if price hits this level and shows clear reversal patterns on smaller timeframes.
🎯 Updated XAUUSD Trading Plan (Prioritizing SELLs):
Given the strong bearish momentum on the Daily chart, we will prioritize active SELL entries and approach BUY scalps with extreme caution, only at very strong support levels or with clear reversal confirmations.
1. ACTIVE SELL TRADES (Priority):
SELL ZONE 1 (Selling at near resistance):
Entry: 3313 - 3315 (If price retraces to this area and shows bearish rejection candle patterns on H1/H4)
SL: 3320 (Just above the nearest resistance)
TP: 3310 - 3305 - 3300 - 3295 - 3290 - 3280 - 3276.122 (Next target according to the chart) - 3264.400 (Final target if strong bearish momentum continues)
SELL ZONE 2 (Selling at stronger resistance - if deeper retracement):
Entry: 3331 - 3333 (If price retraces deeper and shows reversal signals)
SL: 3337
TP: 3326 - 3320 - 3316 - 3310 - 3305 - 3300 - 3294.414
2. CAUTIOUS BUY TRADES (Only for Scalp/Clear Reversal Signals):
BUY ZONE (BUY SCALP AT STRONG SUPPORT):
Entry: 3266 - 3264 (Only buy if price hits this zone and shows clear reversal signals on M15/M30, such as reversal candle patterns, RSI divergence, etc.)
SL: 3260 (Very tight, acknowledging higher risk)
TP: 3270 - 3276.122 - 3280 - 3284 - 3290 (Aim for short TPs, no expectation of prolonged uptrend in strong bearish conditions)
INTERMEDIATE BUY SCALP:
Entry: 3284 - 3282 (If price has broken down through here and retraces, wait for confirmation)
SL: 3278
TP: 3288 - 3292 - 3296 - 3300 (Short-term targets only)
⚠️ Crucial Factors to Monitor Closely Today:
Price Action at Resistance/Support Levels: How price reacts at these key marks will dictate the next move.
US Macro Data (especially PCE on Friday): Any surprising news can rapidly reverse the current trend.
FOMC Speeches: Can induce significant volatility in USD and Gold.
Geopolitical Situation: Although currently optimistic, any unexpected developments could reignite safe-haven demand.

XAUUSD: Gold's Muted Ascent Below $3350 XAUUSD: Gold's Muted Ascent Below $3350 – Navigating Key Levels Amidst USD Weakness!
Hello TradingView Community!
Let's delve into the intricate world of Gold (XAUUSD) today. The yellow metal is showing a subtle positive bias, largely influenced by a weaker US Dollar, yet a decisive bullish breakout above the $3350 mark remains elusive.
🌍 Macroeconomic Landscape: Forces Shaping Gold's Path
Gold has maintained a slight positive stance for the second consecutive day, but it's struggling to find significant follow-through, staying below the $3350 level in early European trading.
USD Under Pressure – A Tailwind for Gold: The primary driver for Gold's recent strength is the weakening US Dollar. Reports suggesting President Trump is considering replacing Fed Governor Jerome Powell have sparked concerns about the US central bank's future independence. This speculation has fueled market expectations for further Fed rate cuts this year, pushing the USD to its lowest point since March 2022, thereby providing support for non-yielding assets like Gold.
Cautious Outlook Prevails: Despite USD weakness, a definitive bullish trend for Gold is not yet confirmed. The ongoing ceasefire between Israel and Iran holds firm, with prevailing optimism limiting significant safe-haven rallies. This complex environment necessitates caution before confirming a definitive bottom for Gold or positioning for a substantial recovery from levels below $3300.
Key Data Ahead: Traders are keenly awaiting upcoming US macroeconomic data and speeches from FOMC members. These insights will be crucial in influencing XAU/USD, particularly ahead of Friday's pivotal US Personal Consumption Expenditures (PCE) Price Index release.
📊 XAUUSD Technical Outlook: Pinpointing Strategic Zones
Based on recent technical analysis (referencing image_e9d325.png for key levels), Gold is in a consolidation phase after a recent sharp decline, trading around the $329X mark. Price action below shorter-term moving averages suggests either lingering bearish pressure or an accumulation phase.
Strong Support Zones (Potential Buy Areas): Critical demand areas are identified around 3294.414, 3276.122, and notably 3264.400. These levels are crucial for potential price bounces.
Key Resistance Zones (Potential Sell Areas): Significant supply zones are found at 3313.737, 3321.466, 3330.483, and 3341.947. These are points where selling pressure may emerge.
🎯 XAUUSD Trading Plan: Your Actionable Strategy
Here's a breakdown of the strategic entry and exit points for your XAUUSD trades:
BUY ZONE (Strong Support - Long-Term Bias):
Entry: 3266 - 3264
SL: 3270
TP: 3280 - 3284 - 3290 - 3295 - 3300 - 3305 - 3310 - 3320
BUY SCALP (Quick Buy at Intermediate Support):
Entry: 3284 - 3282
SL: 3278
TP: 3288 - 3292 - 3296 - 3300 - 3305 - 3310 - 3320 - 3330
SELL ZONE (Key Resistance):
Entry: 3331 - 3333
SL: 3337
TP: 3326 - 3320 - 3316 - 3310 - 3305 - 3300
SELL SCALP (Quick Sell at Near Resistance):
Entry: 3313 - 3315
SL: 3320
TP: 3310 - 3305 - 3300 - 3295 - 3290 - 3280
⚠️ Key Factors to Monitor Closely:
US Macro Data: Friday's US Personal Consumption Expenditures (PCE) Price Index is paramount for market direction.
FOMC Member Speeches: Any official comments on monetary policy or inflation outlook will significantly impact USD and Gold.
Geopolitical Stability: Developments related to the Israel-Iran ceasefire can influence safe-haven demand.

Is USDJPY in a Downtrend?USDJPY is supported by the trendline and the price is facing the resistance zone of 144.500. If the candle cannot close above this resistance zone, the sellers can push the price to break the trendline and head towards the support zone of 142.700. This support zone plays an important role in shaping the trend if broken the downtrend can be extended and no support zone can be strong enough to push the price of the pair until 140.300.
There is still a high possibility of a reaction so the BUY strategy at the support zone of 142.700 is still ready
On the other hand, if the candle closes above the resistance zone of 144.500, the uptrend is still maintained and heading towards this week's peak around 147.500. Pay attention to the price reaction at 146.000.

Euro's Surge on USD Weakness – Is 1.20 the Next Stop?EURUSD: Euro's Surge on USD Weakness – Is 1.20 the Next Stop?
Hello TradingView Community!
The EURUSD pair is currently commanding significant attention with its strong upward momentum.
🌍 Fundamental Highlights: Euro's Tailwinds & USD's Headwinds
The Euro has demonstrated notable strength, recently breaching the 1.17 mark to hit its highest level in over 3.5 years. According to ING, if this momentum holds, the next target could be 1.20, contingent on continued USD weakness.
The US Dollar faces considerable pressure following news that President Trump intends to name a successor to Fed Chair Powell soon, sparking concerns about the Fed's independence. Such speculation often leads to expectations of a more 'dovish' monetary policy, weakening the USD.
Adding to the Euro's support are the NATO agreement to increase defense spending targets to 5% and President Trump's seemingly "less aggressive" stance towards the EU.
In summary: Should USD depreciation persist, not only the Euro but other asset classes might also attract capital inflows, particularly given the ongoing uncertainties surrounding inflation risks and monetary policy.
📊 EURUSD Technical Outlook (H4/M30 Chart):
Our technical analysis of the EURUSD chart (image_b73298.png) confirms a clear and robust uptrend, characterized by successive higher highs and higher lows. The EMAs are in a bullish alignment, reinforcing this upward trajectory.
Upside Targets (Potential BUY Zones):
1.17807: The initial potential target if the bullish momentum continues.
1.18458: A higher target representing the next potential resistance zone.
Key Support Levels (Potential BUY Zones for pullbacks):
1.16070: A strong support level where demand could emerge after a correction.
An implied intermediate support around 1.166xx (visually suggested by price action between current levels and 1.16070) could also offer buying opportunities after minor pullbacks.
🎯 EURUSD Trading Plan:
BUY Zone 1 (Intermediate Pullback):
Entry: 1.16600 - 1.16700
SL: 1.16450
TP: 1.16800 - 1.17000 - 1.17200 - 1.17500 - 1.17807 - 1.18000 - 1.18300 - 1.18458
BUY Zone 2 (Strong Support):
Entry: 1.16070
SL: 1.15900
TP: 1.16200 - 1.16400 - 1.16600 - 1.16800 - 1.17000 - 1.17300 - 1.17600 - 1.17807 - 1.18458
SELL Zone (Consider only at upside targets with clear reversal signals):
Entry: 1.18458 (This is an upside target, but also a potential resistance for selling if strong reversal signals appear).
SL: 1.18600
TP: 1.18300 - 1.18000 - 1.17807 - 1.17500 - 1.17200 - 1.17000 - 1.16800
⚠️ Key Factors to Monitor:
Fed Leadership News: Any official announcements regarding the Fed Chair succession will trigger significant USD volatility.
Eurozone Economic Data: Upcoming inflation, GDP, and employment reports.
ECB Statements: The European Central Bank's stance on monetary policy.
Geopolitical Developments: Major tensions or agreements can influence market sentiment.
Trade smart and always manage your risk effectively! Wishing everyone a profitable trading day!
