XAUUSD: Gold's Inflationary Tug-of-WarXAUUSD: Gold's Inflationary Tug-of-War – Navigating Powell's Remarks & Key Levels
Hello TradingView community!
Let's dive into Gold (XAUUSD) today, as its price action continues to be shaped by the Federal Reserve's (Fed) cautious stance on inflation and interest rates. Recent comments from Fed Chair Jerome Powell are particularly noteworthy.
🌍 Macroeconomic Drivers: Tariffs, Inflation, and Fed's Deliberation
The market finds itself in a complex situation following key statements from Fed Chair Jerome Powell:
Powell indicated that substantial tariffs could trigger a prolonged wave of inflation, potentially moving beyond conventional economic models. This introduces a new and significant factor into the inflation outlook.
Despite recent inflation moderation, Powell stressed the necessity of more data from June and July before considering any rate cuts. This underscores the Fed's cautious approach and lack of immediate urgency.
He also cautioned about the risk of "price shocks turning into persistent inflation".
In this environment, where market sentiment is stretched between hopes for rate cuts and the emerging risk of tariff-driven inflation, Gold maintains its role as a crucial psychological anchor. Should the Fed be slow to react to this potential new inflationary pressure, Gold's appeal could intensify.
📊 XAUUSD Technical Analysis & Trading Plan:
Based on the XAUUSD charts (H4/M30 timeframe) you provided (e.g., image_008403.png): Gold is currently undergoing a corrective or consolidating phase after a notable pullback. The price is trading below shorter-term moving averages, suggesting either bearish momentum or an accumulation phase.
Key Resistance Zones (Potential SELL Areas):
3,352.383 - 3,353.860: An immediate resistance point, coinciding with the 0.5 Fibonacci level.
Higher up: 3,391.750 - 3,395.000: This represents a very strong previous peak and a major resistance barrier.
Key Support Zones (Potential BUY Areas):
3,317.738 - 3,311.214: An intermediate support area, close to the 0.236 Fibonacci level.
3,302.939 - 3,302.857: A strong demand zone, aligning with the recent low.
Further down: 3,286.257: This is the next significant support level if preceding zones are breached.
🎯 XAUUSD Intraday Trading Plan:
Here are our refined zones and targets for today's trading:
BUY SCALP:
Entry: 3316 - 3314
SL: 3310
TP: 3320 - 3324 - 3328 - 3332 - 3336 - 3340
BUY ZONE:
Entry: 3304 - 3302
SL: 3298
TP: 3308 - 3312 - 3316 - 3320 - 3330 - 3340 - 3350
SELL SCALP:
Entry: 3353 - 3355
SL: 3360
TP: 3350 - 3345 - 3340 - 3335 - 3330
SELL ZONE:
Entry: 3390 - 3392
SL: 3396
TP: 3386 - 3382 - 3378 - 3374 - 3370 - 3360
⚠️ Key Factors to Monitor:
Fed Official Speeches: Any new comments from Fed officials regarding inflation or monetary policy outlook.
US Economic Data: Upcoming inflation (CPI, PCE) and employment reports (NFP) will be crucial for policy expectations.
Geopolitical Developments: Ongoing global tensions consistently bolster Gold's safe-haven appeal.
Trade wisely and always manage your risk effectively! Wishing everyone a profitable trading day!
Trading-forex

USDCAD: Oil Price Weakness Weighs on CAD – Can USD Capitalize?USDCAD: Oil Price Weakness Weighs on CAD – Can USD Capitalize?
Hello TradingView community!
Today, let's analyze the USDCAD pair, which is showing interesting dynamics as the CAD faces pressure from falling oil prices.
🌍 Macro Drivers: CAD Struggles Amidst Lower Oil, USD Upside Limited
The USDCAD pair is caught in a tug-of-war between the Canadian Dollar (CAD) and the US Dollar (USD):
CAD pressured by oil: The Canadian Dollar has seen its gains trimmed, primarily weighed down by lower crude oil prices. Canada, being a major oil exporter, sees its currency directly impacted by these fluctuations.
Oil prices lower: A recent truce between Israel and Iran is keeping crude oil prices significantly lower (16% below Monday's highs), directly affecting CAD's strength.
USD's limited upside: Despite CAD's weakness, the US Dollar's upside attempts are being constrained by recent soft US economic data and persistent hopes for Federal Reserve (Fed) monetary policy easing.
In summary, USDCAD is seeing a slight upward tick due to a weaker CAD from oil price drops, but the USD's rally is somewhat capped by Fed easing expectations.
📊 Technical Analysis & USDCAD Trading Plan
Based on the USDCAD chart (H4/M30) provided:
Overall Trend: USDCAD is trading within an ascending channel, but shows signs of weakness near the channel's upper boundary. Price appears to be forming a lower high after a previous upward move.
Key Price Levels:
Potential SELL Zone (Resistance): Clearly identified around 1.36989. This is a strong resistance level, coinciding with recent local highs. Selling pressure is likely to emerge here.
Key Support (Potential BUY Zone): Around 1.36734 and further down at 1.36431. The 1.36431 level is particularly significant, aligning with a major Fibonacci level (1.382) and acting as a robust demand area from prior price action.
Moving Averages (EMAs): Price is trading near the EMAs (black, orange, red), indicating a consolidation phase and potential for a significant move.
Projected Price Action: The chart suggests that USDCAD could pull back from the current resistance zone (1.36989) towards the support levels below, particularly 1.36431, before potentially finding buying interest to resume an upward trend.
🎯 USDCAD Trading Plan:
SELL ZONE: 1.36989
SL: 1.37050
TP: 1.36900 - 1.36850 - 1.36800 - 1.36750 - 1.36700 - 1.36600 - 1.36500 - 1.36431
BUY ZONE: 1.36431
SL: 1.36300
TP: 1.36500 - 1.36550 - 1.36600 - 1.36650 - 1.36700 - 1.36750 - 1.36800 - 1.36900
⚠️ Key Factors to Monitor:
Crude Oil Prices: Any significant movements in crude oil will directly impact the CAD.
US Economic Data: Upcoming reports on inflation and employment from the US could heavily influence Fed policy expectations and USD strength.
Bank of Canada (BoC) Policy: Statements or decisions from the BoC will also be a critical factor affecting the CAD.
Trade smart and stay vigilant! Wishing everyone a successful USDCAD trading day!

Downtrend Slowing – Recovery Opportunity After Correction?USD/JPY: Downtrend Slowing – Recovery Opportunity After Correction?
Hello TradingView community!
Today, let's focus on analyzing the USD/JPY pair, which is showing interesting developments after its recent correction.
🌍 Macro Overview: USD/JPY Under Current Pressures
The market is observing shifts in the dynamics of the USD/JPY pair:
UOB Group's 24-Hour View: The USD experienced a sharp decline from 148.02 on Monday to 144.49, despite being "oversold". This indicates a slowing in the downtrend, though caution remains.
Retest Expected: According to UOB Group, there's a likelihood of USD/JPY retesting the 144.50 level before a more sustained recovery can be expected.
Downside Limited: A drop below 144.50 cannot be ruled out, but based on current momentum, any further weakness is unlikely to reach 144.00.
Resistance Levels: On the upside, resistance levels are noted at 145.20 and 145.55.
Overall, USD/JPY is in a phase of seeking equilibrium after a significant decline.
📊 Technical Analysis & USD/JPY Trading Plan
Based on the USD/JPY chart (H4/M30) you provided:
Overall Trend: The pair has undergone a relatively deep corrective decline after reaching a local peak, but appears to be seeking a strong support zone.
Key Price Levels:
Crucial Resistance (SELL Zone): Clearly at 144.894 - 145.178. This is an confluence area of Fibonacci levels and local highs where selling pressure could emerge strongly.
Important Support (Potential BUY Zone): Around 143.800 - 143.500. This represents a potential bottoming area where demand might be strong enough to push the price higher.
Projected Price Action: After the sharp decline, USD/JPY might retest the 144.50 area. If it holds above key support levels, an upward move towards resistance zones is plausible, as indicated by the arrows on the chart.
🎯 USD/JPY Trading Plan:
BUY ZONE: 143.800 - 143.500
SL: 143.400
TP: 144.000 - 144.200 - 144.500 - 144.800 - 145.000 - 145.200 - 145.500
SELL ZONE: 144.894 - 145.178
SL: 145.300
TP: 144.700 - 144.500 - 144.200 - 144.000 - 143.800 - 143.500
⚠️ Key Factors to Monitor:
US and Japanese Economic Data: Upcoming reports on inflation and employment from both nations could significantly impact Fed and BoJ policy expectations.
BoJ Policy Decisions: Any shifts in the Bank of Japan's stance will create strong volatility for the JPY.
Global Risk Sentiment: Changes in overall market sentiment can also affect JPY crosses.
Trade smart and stay informed! Wishing everyone a successful USD/JPY trading day!

Powell's Softer Tone Hints at Gold's LiftoffXAUUSD: Powell's Softer Tone Hints at Gold's Liftoff – Ready for a July Rally?
Hey everyone!
Let's dive into XAUUSD today! We've got some sweet news from Fed Chair Jerome Powell that could be a game-changer for Gold.
🌍 Macro Edge: Gold Breathes Easier as Rate Pressures May Ease!
Gold's recent climb is largely thanks to Powell's "soft-spoken" remarks. He's openly admitted that tariff-driven inflation is lower than expected, even subtly hinting at earlier rate cuts – perhaps as soon as July!
Despite his "no need to rush" stance, the market's getting a clear message: if inflation keeps cooling down, the Fed will have room to loosen policy sooner. This is music to Gold's ears! Lower rates mean a reduced opportunity cost for holding Gold (which doesn't yield), making it far more attractive to investors.
🌐 Capital Flows: Gold vs. USD – Who's the Next Safe-Haven King?
Market liquidity always dances to the tune of interest rates and risks. Gold and the USD typically share the safe-haven crown during volatile times.
However, if Powell's "dovish tilt" holds, and the Fed cuts rates soon, prepare for a significant capital shift:
USD might cool off: Lower US yields reduce the USD's appeal.
Gold takes the spotlight: With lower holding costs and persistent global geopolitical uncertainties, Gold could see a surge in demand.
The market's re-pricing of Fed policy is already bolstering Gold, signaling a potential upside move on the horizon!
📊 Technical Insight (H4/M30 Chart): Gold Breaking Free, Targeting Higher Peaks!
Looking at our XAUUSD chart (H4/M30, based on your image):
Channel Breakout: Gold has clearly broken out of its prior descending channel! This is a positive sign, indicating weakening selling pressure and a potential trend reversal. Price is consolidating, possibly forming a new accumulation pattern or a minor ascending channel.
Key Levels to Watch:
Potential SELL Zone (Resistance): Around 3352.383 - 3371.205. This is a major historical resistance cluster where Gold has previously met strong selling pressure. Watch for rejection here.
Higher Resistance: 3391.750 - 3395.000. A decisive break above this level would signal a more robust long-term bullish trend.
Current BUY Zone (Support): Around 3302.939 - 3311.214. This is a critical demand zone where strong buying interest is likely to emerge, aligning with recent lows.
Next Key Support: 3286.257. This is the next line of defense if the current BUY zone breaks.
🎯 Trade Plan & Key Zones:
BUY ZONE: 3286 - 3284
SL: 3280
TP: 3290 - 3294 - 3298 - 3302 - 3306 - 3310 - 3315 - 3320
BUY SCALP: 3302 - 3300
SL: 3295
TP: 3306 - 3310 - 3314 - 3318 - 3322 - 3326 - 3330
SELL ZONE: 3353 - 3355
SL: 3360
TP: 3350 - 3346 - 3340 - 3335 - 3330 - 3320
SELL ZONE: 3372 - 3374
SL: 3378
TP: 3370 - 3366 - 3362 - 3358 - 3354 - 3350
⚠️ What Else to Watch For:
More Fed Official Speeches: Any new comments on inflation or policy will keep the market buzzing.
Geopolitical Developments: Ongoing global tensions can always boost Gold's safe-haven appeal.
Let's trade smart and stay sharp! Wishing everyone a successful trading day!

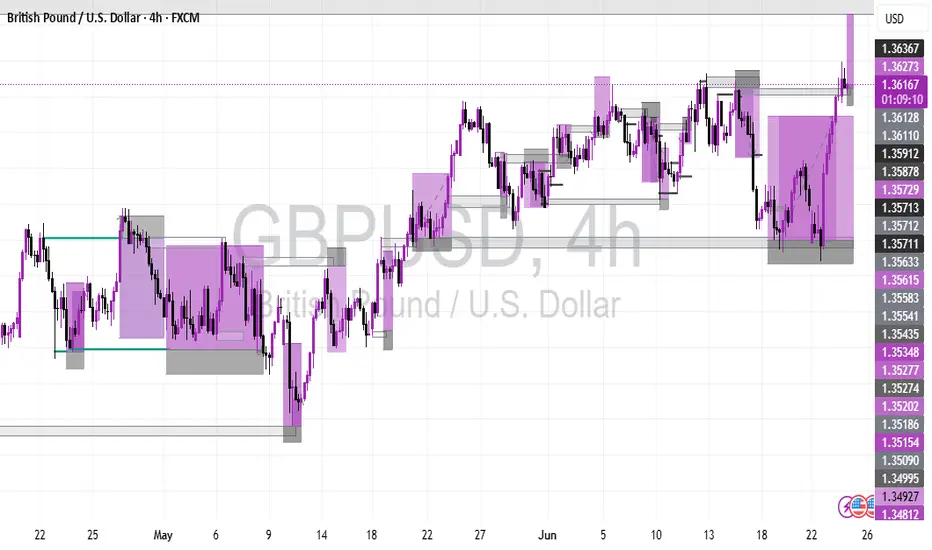
Nothing more beautiful than thisgbpusd has shown an uptrend for the past few months, did you get the picture?
XAUUSD: Key Reversal Zone or Deeper Correction Ahead?XAUUSD: Key Reversal Zone or Deeper Correction Ahead?
Gold enters the new trading week balancing on a technical and macroeconomic knife’s edge. After a steep decline, prices are testing critical liquidity zones — just as geopolitical tensions and US economic uncertainty intensify.
🌍 Macro & Fundamental Outlook
📰 Middle East Tensions Rising Again: Israel has signaled potential strikes on Tehran after Iran allegedly violated a ceasefire agreement. Such developments usually support gold as a safe-haven asset.
📊 US Economic Signals Are Mixed: Last week’s PMI and housing data point toward an economic slowdown. If this week’s Core PCE data softens, expectations for a Fed rate cut in September will grow — likely weakening the USD and lifting gold.
🏦 Global Demand for Gold Still Strong: Central banks, particularly from China and India, are continuing their gold accumulation, reinforcing long-term bullish fundamentals.
📉 Technical Analysis (H1–H4)
Gold is still trading within a downward channel but is now approaching a strong demand zone around 3276, a level that has triggered rebounds in the past.
EMA 34 – 89 – 200 indicate bearish momentum, but RSI is showing bullish divergence — hinting at a possible reversal or short-term bounce.
Price action around key support and resistance levels will be crucial this week.
✅ XAUUSD Trade Setup
BUY ZONE: 3278 - 3276 | SL: 3270 | TP: 3282 - 3286 - 3290 - 3294 - 3298 - 3302 - 3305 - 3310
SELL ZONE: 3367 - 3369 | SL: 3375 | TP: 3364 - 3360 - 3356 - 3352 - 3348 - 3344 - 3340 - 3330 - 3320
📌 The Buy Zone lies within a historical liquidity pocket — ideal for a potential rebound if geopolitical risks rise or USD weakens.
📌 The Sell Zone is near a key Fair Value Gap (FVG) and local resistance — strong confluence for short opportunities on a bounce.
🧭 Final Thoughts
XAUUSD is facing a pivotal moment. With both geopolitical events and major US economic data on the horizon, traders should prepare for volatility. Patience, technical discipline, and proper SL/TP management will be key to navigating this environment successfully.

EUR/AUD Short, EUR/NZD Short, NZD/USD Long and AUD/NZD ShortEUR/AUD Short
Minimum entry requirements:
- If tight non-structured 1H continuation forms, 15 min risk entry within it if the continuation is structured on the 15 min chart or reduced risk entry on the break of it.
- If tight structured 1H continuation forms, 1H risk entry within it or reduced risk entry on the break of it.
EUR/NZD Short
Minimum entry requirements:
- If tight non-structured 1H continuation forms, 15 min risk entry within it if the continuation is structured on the 15 min chart or reduced risk entry on the break of it.
- If tight structured 1H continuation forms, 1H risk entry within it or reduced risk entry on the break of it.
NZD/USD Long
Minimum entry requirements:
- If tight non-structured 1H continuation forms, 15 min risk entry within it if the continuation is structured on the 15 min chart.
- If tight structured 1H continuation forms, 1H risk entry within it.
AUD/NZD Short
Minimum entry requirements:
- If tight non-structured 1H continuation forms, 15 min risk entry within it if the continuation is structured on the 15 min chart.
- If tight structured 1H continuation forms, 1H risk entry within it.

GBPUSD Will Fall! Sell!
Here is our detailed technical review for GBPUSD.
Time Frame: 6h
Current Trend: Bearish
Sentiment: Overbought (based on 7-period RSI)
Forecast: Bearish
The market is approaching a significant resistance area 1.349.
Due to the fact that we see a positive bearish reaction from the underlined area, I strongly believe that sellers will manage to push the price all the way down to 1.341 level.
P.S
The term oversold refers to a condition where an asset has traded lower in price and has the potential for a price bounce.
Overbought refers to market scenarios where the instrument is traded considerably higher than its fair value. Overvaluation is caused by market sentiments when there is positive news.
Disclosure: I am part of Trade Nation's Influencer program and receive a monthly fee for using their TradingView charts in my analysis.
Like and subscribe and comment my ideas if you enjoy them!

EUR/AUD ShortEUR/AUD Short
Minimum entry requirements:
- 1H impulse down below area of interest.
- If tight non-structured 5 min continuation follows, reduced risk entry on the break of it.
- If tight structured 5 min continuation follows, reduced risk entry on the break of it or 5 min risk entry within it.
- If tight non-structured 15 min continuation follows, 5 min risk entry within it if the continuation is structured on the 5 min chart or reduced risk entry on the break of it.
- If tight structured 15 min continuation follows, reduced risk entry on the break of it or 15 min risk entry within it.

XAUUSD – Are the Bulls Back? Key Reversal Zone in PlayXAUUSD – Are the Bulls Back? Key Reversal Zone in Play
Gold has been consolidating in a tight range for several sessions, but both macro and technical indicators are pointing to a potential breakout. With volatility expected to rise, traders should keep a close eye on these high-probability zones.
🌍 Macro Overview – Is the Tide Turning for Gold?
📉 The Fed remains hawkish, but market sentiment has shifted, with over 65% probability priced in for a rate cut in September. This adds pressure on the dollar and offers upside potential for gold.
💸 10-year US Treasury yields are stabilizing, reducing the opportunity cost of holding gold and reigniting interest from risk-averse investors.
⚠️ Ongoing geopolitical risks in the Middle East and Eastern Europe continue to fuel demand for safe-haven assets.
🏦 Central banks, especially in China and India, are steadily increasing their gold reserves — a bullish long-term signal for the market.
📊 Technical Outlook – Watch the Fair Value Gap (FVG)
The 3325–3327 support zone aligns with an unfilled FVG on H1-H4 charts, providing a key area for bullish momentum to resume.
Sustained price action above this level may open a path toward 3360 and beyond.
Conversely, if price reaches the 3398–3400 resistance area and shows signs of exhaustion, it could trigger a short-term pullback.
✅ Trade Setup
🟢 BUY ZONE: 3327 – 3325
SL: 3320
TP Targets: 3330 → 3335 → 3340 → 3345 → 3350 → 3355 → 3360 →
🔴 SELL ZONE: 3398 – 3400
SL: 3405
TP Targets: 3395 → 3390 → 3386 → 3380 → 3375 → 3370 → 3360
⚠️ Final Thoughts
The gold market is approaching a decision point... With the PCE and US GDP data due this week, traders should expect a potential volatility spike.
Risk management remains key — wait for confirmation at key levels, stick to your plan, and don’t let emotions override discipline. This week could offer strong directional moves for gold, but only for those prepared.

GBPJPY Will Go Lower! Short!
Here is our detailed technical review for GBPJPY.
Time Frame: 6h
Current Trend: Bearish
Sentiment: Overbought (based on 7-period RSI)
Forecast: Bearish
The market is approaching a significant resistance area 196.531.
Due to the fact that we see a positive bearish reaction from the underlined area, I strongly believe that sellers will manage to push the price all the way down to 195.203 level.
P.S
Overbought describes a period of time where there has been a significant and consistent upward move in price over a period of time without much pullback.
Disclosure: I am part of Trade Nation's Influencer program and receive a monthly fee for using their TradingView charts in my analysis.
Like and subscribe and comment my ideas if you enjoy them!

Gold on the Edge: Will US Debt Fears Spark a Breakout?XAUUSD – Gold on the Edge: Will US Debt Fears Spark a Breakout?
After weeks of muted movement, gold is coiling within a bearish channel — but a fresh warning from Goldman Sachs may be the trigger that changes everything. With concerns mounting over America’s fiscal future, gold could be preparing for a decisive shift.
🌐 Macro View – Goldman Sachs Sounds the Alarm
🔺 Goldman Sachs recently issued a critical warning:
US national debt is expected to exceed WWII levels, with interest payments topping $1 trillion by 2025, outpacing spending on defense and healthcare.
If urgent fiscal reforms aren’t implemented, the US could face a tightening cycle that slows GDP growth without reducing the debt-to-GDP ratio.
The root causes? Excessive spending, rising interest rates, and deep political gridlock.
📌 For global investors, this type of uncertainty is often bullish for gold — especially as a hedge against both inflation and US dollar instability.
📉 Technical Outlook (Updated – M30 to H1)
Gold is still trading inside a well-defined descending channel, with sellers firmly in control.
Price is currently hovering around the pivot zone at 3,338.42, with a possible short-term bounce toward 3,368.04, the upper edge of the channel.
EMA ribbons (13–200) are sharply aligned to the downside, signaling strong bearish momentum.
If the price fails to break above 3,368, the next key support zones lie at 3,325.78, and potentially 3,309.25, where unfilled fair value gaps (FVG) await.
✅ Trade Plan
🟢 BUY ZONE: 3310 – 3308
Stop-Loss: 3303
Targets: 3314 → 3318 → 3322 → 3326 → 3330 → 3340 → 3350 → 3360 →
🟢 BUY SCALP: 3325 – 3323
Stop-Loss: 3318
Targets: 3330 → 3334 → 3338 → 3342 → 3346 → 3350 → 3360 → 3370 →
🔴 SELL ZONE: 3418 – 3420
Stop-Loss: 3424
Targets: 3414 → 3410 → 3405 → 3400 → 3396 → 3390 → 3385 → 3380
🔻 SELL SCALP: 3396 – 3398
Stop-Loss: 3403
Targets: 3392 → 3388 → 3384 → 3380 → 3375 → 3370
💬 Closing Thoughts – A Volatile End to the Week?
With US markets returning from a bank holiday and macro pressure rising, volatility could spike to close the week.
✅ Stick to disciplined SL/TP levels. Avoid premature entries and let price confirm direction.
Gold remains technically bearish — but the global debt narrative could turn this market on its head.
Prepare. Observe. Strike only when the structure aligns.

Gold Breaks the Range: Trend Reversal or Just a Fakeout?XAUUSD – Gold Breaks the Range: Trend Reversal or Just a Fakeout?
After several days of sideways action, gold has finally broken out of its consolidation channel — but not upward. The price action signals uncertainty, while underlying global risks suggest a larger move may be brewing. With US markets closed for a bank holiday, low liquidity could lead to sharp, unexpected spikes — traders, stay alert.
🌍 Macro & Fundamental Outlook
📌 As widely expected, the Federal Reserve held rates steady, but Fed Chair Powell maintained a hawkish tone, warning that inflation risks remain due to ongoing geopolitical instability and rising commodity costs.
🔥 The gold market now hinges on two major geopolitical scenarios in the Middle East:
If the US intervenes diplomatically to ease tensions between Iran and Israel, gold may continue to correct further — possibly into the 3,325 – 3,300 range or lower.
However, if reports are accurate that Trump is coordinating with Israel for potential strikes on Iran, gold could spike aggressively as safe-haven demand surges toward 3,417 – 3,440.
📊 Technical Breakdown (M30 – H1)
Price has broken below the range-bound structure, suggesting a potential momentum shift to the downside.
The EMA cluster (13–34–89–200) is sloping downward, confirming bearish short-term pressure.
The 3,345 level has acted as support, but if it gives way, 3,325 becomes a critical liquidity zone where buyers may step in.
✅ Trading Plan
🟢 BUY ZONE 1: 3,325 – 3,328
Entry: Only after a clear bullish reversal (pin bar / bullish engulfing candle)
SL: Below 3,320
TP: 3,345 → 3,360 → 3,373 → 3,384
🟢 BUY ZONE 2: 3,345 – 3,348
Entry: On price retest and bullish confirmation
SL: Below 3,340
TP: 3,360 → 3,373 → 3,384 → 3,403
🔴 SELL ZONE: 3,417 – 3,440
Entry: If price rallies into resistance with no supporting fundamentals
SL: Above 3,445
TP: 3,403 → 3,384 → 3,360 → 3,345
💬 Final Thoughts
Gold is at a pivotal point. While today’s break could indicate a new leg down, we’ve seen countless false breakouts during low liquidity sessions. Only trade on confirmation — not emotion. Watch for geopolitical headlines and let price action guide your risk-adjusted decisions.
Stay patient. Stay sharp. Let the market prove itself before you do.

Smart Money Zones Revealed (XAUUSD) Is Gold Just Breathing or Breaking? Smart Money Zones Revealed (XAUUSD)
🔍 Macro & Sentiment Overview
Gold faced a sharp correction after a strong Asian session rally, which caught many traders off guard...
While the US Dollar gained 0.7% due to safe-haven flows and Fed anticipation, gold's dip seems more like a liquidity sweep than a structural reversal...
🌍 Rising geopolitical tensions — especially Iran–Israel and Trump’s comments about Tehran — keep the fear premium alive…
🛢️ Meanwhile, oil prices are surging, and institutional funds might be rotating capital between commodities and equities...
📝 All eyes are now on the Fed’s rate decision and the US retail sales report — a potential "horror print" that could shock rate expectations and trigger high volatility across markets.
📉 Technical Breakdown (M30 Perspective)
Price pulled back sharply after an overextended bullish move from Asian FOMO…
EMAs (13, 34, 89, 200) show early signs of potential crossover — signaling caution for buyers…
Liquidity gaps (FVG zones) below current price indicate a magnet for institutional fills…
🎯 Trade Setup
🔵 BUY ZONE: 3345 – 3343
Stop-Loss: 3339
Take Profits:
3350 → 3354 → 3358 → 3362 → 3366 → 3370 → 3380 → 3400 → ???
🧠 Look for confirmation through price action and rejection candles during London/NY sessions before entering.
🔴 SELL ZONE: 3442 – 3444
Stop-Loss: 3448
Take Profits:
3438 → 3434 → 3430 → 3425 → 3420 → 3410 → 3400
⚠️ Only short upon clean rejection and strong bearish confirmation patterns — avoid blind entries in this volatile phase.
🧠 Final Thoughts
Gold is moving within a smart money playbook — triggering stop hunts and liquidity grabs. With macro uncertainty ahead, patience and precision matter more than ever.
Let price come to your zones. Don’t chase. Let volatility serve you — not shake you.
📌 Follow this idea for live updates during the Fed press conference and NY session.

Squeeze in Progress: Will BOJ Trigger the Next Breakout?USDJPY 17/06 – Squeeze in Progress: Will BOJ Trigger the Next Breakout?
The USDJPY pair is currently consolidating just below the key 144.650 resistance, stuck within a tightening triangle structure. As markets await more clarity from both the Bank of Japan (BOJ) and the Fed, price action is showing signs of indecision — but pressure is building.
🌐 Macro & Sentiment Overview
BOJ maintains a neutral stance: Despite growing speculation of a hawkish shift, the BOJ held rates steady, providing no strong forward guidance. Markets remain cautious.
US Dollar remains resilient amid stable bond yields and expectations that the Fed may delay rate cuts, adding short-term support to USDJPY.
Geopolitical risk is on the rise: Ongoing Middle East tensions are fueling safe-haven demand for JPY, capping bullish momentum.
🔍 Technical Setup (M30 Chart)
Price is trapped inside a symmetrical triangle, tightening between 144.652 resistance and 143.126 support.
EMA 13/34/89 are aligned bullishly, but EMA 200 (red) is acting as a dynamic ceiling near 144.300.
Key support zones:
144.071: Minor structural level and trendline test.
143.126: Major liquidity zone and untested demand.
🎯 Trade Scenarios
📉 Scenario 1 – Sell on Rejection at 144.652
Entry: 144.650–144.700
Stop Loss: 145.250
Take Profit: 144.071 → 143.600 → 143.126
Ideal if BOJ shifts tone or USD weakens post-Fed comments.
📈 Scenario 2 – Buy on Bullish Reaction at 143.126
Entry: 143.100–143.150
Stop Loss: 142.700
Take Profit: 143.600 → 144.071 → 144.650 → 145.200
Valid only with clear bullish confirmation on M15–M30 structure.
🧠 Final Thoughts
USDJPY is coiling tightly ahead of a potential breakout. Macro uncertainty from central banks, geopolitical instability, and upcoming CPI data make this week highly volatile. Instead of chasing, let price come to your zones and react accordingly.
🔔 Focus on structure, confirm with price action, and avoid emotional trades. Patience and discipline are key in this compression phase.

Gold’s Game of Traps: Is the Dip a Setup for a Bigger Move? Gold’s Game of Traps: Is the Dip a Setup for a Bigger Move?
After an aggressive rally fueled by geopolitical FOMO headlines, gold (XAUUSD) saw a sudden pullback — but what looked like weakness might actually be a setup for smart accumulation. The market narrative is shifting, and price action is sending important signals...
🌍 Global Drivers Behind the Volatility
Middle East conflict between Israel and Iran continues to escalate, prompting global safe haven flows. Evacuation warnings and nuclear deal pressure add more uncertainty to the mix.
Despite bullish news, gold failed to hold its highs — a potential bull trap as institutional players took advantage of retail FOMO to offload.
Big capital may now be rotating from gold into other sectors like energy (oil) and discounted equity assets.
📉 Price Action & Technical Outlook (M30–H1)
After topping around 3442–3440, price snapped back into the mid-range — a sign of liquidity hunting rather than a full reversal.
The EMAs (13/34/89/200) on the M15–M30 timeframes are showing early signs of bearish crossover, hinting at further short-term weakness.
Below current price sits a clean Fair Value Gap (FVG) that could act as a magnet — aligning with a high-probability buy zone.
🎯 Trading Playbook
✅ BUY Setup – "Smart Money Entry Zone"
Buy Zone: 3342 – 3344
Stop Loss: 3338
Take Profit Targets:
→ 3348 → 3352 → 3356 → 3360
→ 3364 → 3368 → 3372 → 3380+
💡 Look for price to tap into the FVG and form a base with bullish confirmation (engulfing candle, divergence, or rising volume) before entering.
❌ SELL Setup – "Fade the Overhead Resistance"
Sell Zone: 3440 – 3442
Stop Loss: 3446
Take Profit Targets:
→ 3436 → 3432 → 3428 → 3424
→ 3420 → 3415 → 3410
⚠️ Only short on a strong rejection or bearish engulfing candle near the resistance — do not short blindly.
🧠 Market Psychology Insight
The initial Asian-session rally was likely a news-driven liquidity event.
Institutions appear to be rotating capital, using emotional retail entries as exit liquidity.
Current market conditions suggest a shakeout before a longer-term bullish move.
📌 Final Note
Don’t chase price. Let it come to your zones. This market is being driven by geopolitical narrative and smart money behavior, not just technicals alone.
✅ Stay patient.
📊 Trade with logic.
🧘♂️ Let others FOMO — you focus on levels and confirmation.
👉 Follow for real-time London session updates and reaction-based entries.

XAUUSD 16 June – Liquidity Trap or Smart Money Rotation? XAUUSD 16 June – Liquidity Trap or Smart Money Rotation?
Gold surprised many traders with a sharp spike during the Asian session, only to reverse aggressively hours later. While headlines screamed “war” and panic, the price behavior told a different story—one of strategic distribution and smart money rotation...
🌍 Macro & Fundamental Context
Geopolitical triggers: Rising tensions in the Middle East (Israel-Iran) and political assassinations triggered emotional buying across safe-haven assets like gold and oil.
Institutional rotation: Major funds appear to be offloading gold positions to rebalance into equities (in correction) and oil (strong upside potential).
Market narrative: News-induced FOMO drives retail into overbought zones, allowing larger players to exit at premium prices.
📈 Technical Overview (M30 Structure)
Price Action: Gold tapped into major resistance at 3456–3458, showing an aggressive rejection shortly after.
EMA Behavior: EMAs (13/34/89/200) are flattening across M15 and M30—early signs of a possible bearish crossover.
Volume Drop: Declining volume after the spike suggests buyer exhaustion, reinforcing the idea of a bull trap.
Fair Value Gap (FVG): A visible liquidity void remains below the 3390 area. Price often returns to fill these zones.
🎯 Trading Plan for Today
✅ Scenario A: Buy from Demand Zone (Liquidity Fill)
Entry: 3383 – 3385
Stop Loss: 3377
Targets: 3386 → 3390 → 3394 → 3398 → 3402 → 3406 → 3410+
📌 Best executed during London or NY session if price shows absorption or reversal confirmation.
❌ Scenario B: Sell from Resistance Only on Clear Rejection
Entry: 3456 – 3458
Stop Loss: 3462
Targets: 3452 → 3448 → 3444 → 3440 → 3435 → 3430
⚠️ Only enter shorts if clear bearish engulfing or pin-bar setup forms near resistance zone.
🧠 Market Psychology
Retail FOMO is being exploited by larger players to exit risk positions.
Liquidity engineering is likely in play—smart money drives price up on headlines, then exits into buyer momentum.
Equity & Oil rotation signals a shift in institutional preference short-term.
📌 Final Thoughts
This isn’t a time to chase breakouts. Gold is entering a volatile re-accumulation phase where news is being weaponized to induce emotional trading. The real edge lies in waiting for price to come to your level and only executing with confirmation.
🎯 Zone to Watch: 3383 – 3385
📉 Avoid chasing moves
📊 Respect your SL & manage risk like a pro
—
🧭 Stay patient. The next big move will reward those with discipline and timing.

EURUSD 16 June – Technical Rebound or Liquidity Trap? EURUSD 16 June – Technical Rebound or Liquidity Trap?
The EURUSD pair has shown sharp movements after testing key resistance near 1.1607. While the price action may appear bullish at first glance, deeper analysis suggests we might be facing either a continuation of the uptrend or a strategic liquidity hunt.
🌍 Macro & Fundamental Overview
The ECB remains hawkish with rates still high, but recent commentary hints at a more dovish tone possibly leading to rate cuts in late Q3 2025.
Meanwhile, the Federal Reserve maintains its cautious stance, holding off on rate cuts due to sticky core inflation.
This divergence in policy expectations creates a neutral to slightly USD-favorable bias, depending on upcoming economic data.
⏳ Bottom line: EURUSD remains in a choppy environment with compression–expansion cycles, and no confirmed macro-driven trend yet.
📉 Technical Outlook (H1 Chart)
Price Structure: The pair is moving within a short-term ascending channel, but current price is testing the upper boundary.
EMA Analysis (13/34/89/200): Still supports an uptrend, but flattening out — potential bearish crossover if price fails to hold.
Key Resistance:
1.1607: Major resistance and local top (double rejection zone).
Critical Support Zones:
1.15540: Minor structural support — a decisive level for intraday direction.
1.15261 & 1.14807: Unfilled FVG zones and liquidity pools that may get targeted if the price breaks lower.
🎯 Trade Setup Ideas
📘 Scenario A – BUY from 1.15540 support (bullish continuation)
Entry: 1.15540 (upon bullish candle confirmation or strong bounce)
Stop Loss: 1.15200
Take Profits: 1.15850 → 1.16070 → 1.16300+
✅ Ideal if European sentiment remains positive or if USD weakens across the board.
📕 Scenario B – SELL if price breaks and retests 1.15540
Entry: 1.15540 (after a breakdown + rejection retest)
Stop Loss: 1.15720
Take Profits: 1.15261 → 1.14807 → possibly 1.1450
✅ Best used if USD gains strength or EUR shows weakness after economic releases.
🧠 Market Psychology
The market is currently reactive to any shift in tone from ECB and Fed, causing price whipsaws near key zones.
Smart traders will avoid chasing breakouts and instead focus on reaction zones like 1.15540 for confirmation-based trades.
Watch for fakeouts, as institutional players may be hunting liquidity before choosing direction.
📌 Final Thoughts
EURUSD is in a sensitive zone, and 1.15540 is the intraday pivot. Holding above could trigger a push toward 1.1607 and higher. But failure to hold would likely attract sellers toward the 1.1480–1.1450 liquidity range.
🎯 Discipline is key. Avoid emotional entries. Let the market come to your level — and execute only with confirmation.

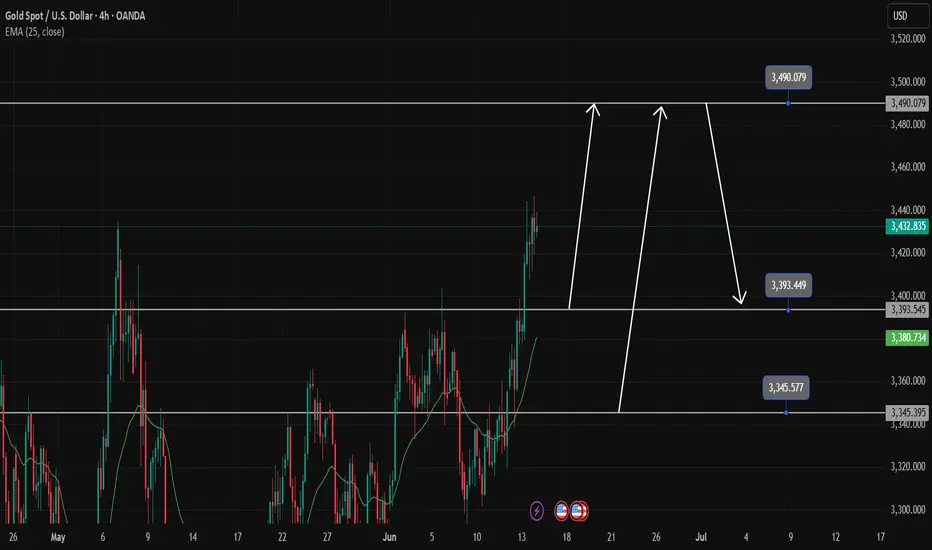
Gold price is sure to make ATH in the new weekGold confirms a long-term uptrend. The ATH 3500 zone is likely to have a reaction before 3490.
Any pullback in Gold next week is still considered a good opportunity to Buy Gold. And the bullish price gap is likely to continue on Monday.
3495 and 3345 are accumulated with many people waiting to Buy there, setting up a Buy signal with SL 10 price at the weekly support and resistance zones.
The possibility of breaking ATH next week is very high
Support 3393-3345
Resistance 3490
GBPUSD My Opinion! SELL!
My dear followers,
I analysed this chart on GBPUSD and concluded the following:
The market is trading on 1.3589 pivot level.
Bias - Bearish
Technical Indicators: Both Super Trend & Pivot HL indicate a highly probable Bearish continuation.
Target - 1.3538
About Used Indicators:
A super-trend indicator is plotted on either above or below the closing price to signal a buy or sell. The indicator changes color, based on whether or not you should be buying. If the super-trend indicator moves below the closing price, the indicator turns green, and it signals an entry point or points to buy.
Disclosure: I am part of Trade Nation's Influencer program and receive a monthly fee for using their TradingView charts in my analysis.
———————————
WISH YOU ALL LUCK

Bearish Bias Holds as Oil Rises & Rate Differentials NarrowUSDCAD – Bearish Bias Holds as Oil Rises & Rate Differentials Narrow
🌍 Macro & Fundamental Outlook
The Canadian Dollar (CAD) continues to gain ground this week, supported by two key drivers:
Crude oil prices surged due to Middle East tensions and renewed demand optimism — boosting CAD as a commodity-linked currency.
US-Canada yield spreads narrowed, following revised expectations that the Bank of Canada (BoC) may keep rates higher for longer, while the Fed is seen pausing.
Short-term event risks to watch:
🇨🇦 Canadian Manufacturing Sales data today at 13:30 GMT
🇨🇦 G7 Summit in Alberta from June 15–17, which may influence oil and energy policy sentiment
Our latest fair value estimate for USDCAD has shifted lower to 1.3613, reflecting tighter rate spreads and stronger oil. Technical structure remains tilted to the downside.
📉 Technical Outlook – M30 Chart
🔹 Structure:
Price remains in a short-term downtrend, with a well-defined descending trendline capping upside attempts.
The pair recently tested the EMA 89–200 zone and failed, suggesting continued bearish pressure.
🔹 Key Zones:
Dynamic Resistance: 1.3638 – 1.3660 (trendline + EMA cluster)
Support Area: 1.3592 → 1.3578
A break below 1.3578 could expose deeper downside toward 1.3420 (September lows)
🔹 Momentum Indicators:
RSI has bounced from oversold (30) but remains in bearish territory.
The current rebound looks corrective — potentially a dead cat bounce.
🧠 Market Sentiment
Flows favour commodity-backed currencies like CAD, especially with energy prices rising.
USD has weakened slightly as the Fed is expected to hold rates steady next week.
Sentiment is leaning toward "sell the rallies" on USDCAD for now.
🎯 Trade Setup Scenarios
🔻 SELL SCENARIO – If price retests and rejects 1.3638 – 1.3660
Entry: 1.3640 – 1.3655
Stop-Loss: 1.3685
Targets: 1.3592 → 1.3578 → 1.3510
🔺 BUY SCENARIO – If strong bullish reaction occurs at 1.3592 – 1.3578
Entry: 1.3580
Stop-Loss: 1.3545
Targets: 1.3620 → 1.3640
⚠️ Focus on trend continuation. Only consider buys if clear rejection or bullish confirmation appears at support.
✅ Conclusion
The current trend in USDCAD favours sellers, with fundamental momentum supporting CAD via higher oil and narrowing yield differentials. Key resistance at 1.3638–1.3660 remains the pivot zone to monitor. With Canadian data and the G7 Summit ahead, volatility could increase.

Dollar Momentum Fades | Can 143.07 Hold as Support?USDJPY – Dollar Momentum Fades | Can 143.07 Hold as Support?
🌍 Fundamental & Macro Outlook
USDJPY has faced strong downside pressure recently as risk-off sentiment boosts demand for the Japanese Yen, following escalating tensions between Israel and Iran.
The US Dollar Index (DXY) rallied on geopolitical concerns but is struggling to sustain momentum near the 98.30 resistance zone.
Despite the Bank of Japan's ultra-loose monetary policy, JPY is acting as a safe haven in current global risk conditions.
Traders are awaiting next week’s monetary policy decisions from both the Federal Reserve and the Bank of Japan. Both central banks are expected to keep rates unchanged, but forward guidance could spark major volatility.
According to UOB Group, the dollar's recovery potential is weakening, and further downside toward 142.20 is possible, unless price reclaims the 144.60–144.95 resistance zone.
📉 Technical Analysis – H1 Chart
🔸 Trend Structure
USDJPY remains in a mild downtrend, but price has bounced from the 143.074 key support zone.
A recovery towards 144.624 is in play, but that zone must be cleared for bullish continuation.
🔸 EMA Outlook
Price is currently testing the EMA 89 and 200 — a rejection from this area could trigger another move down.
EMA 13 & 34 are now acting as short-term dynamic support.
🔸 Key Price Zones
Resistance: 144.60 – 145.26
Support: 143.07 – 142.20
🧠 Market Sentiment
Risk aversion continues to dominate as geopolitical headlines drive sentiment.
The Yen is benefitting from capital protection flows despite Japan’s dovish stance.
Large funds may be starting to hedge by rotating into JPY from elevated USD levels.
🎯 Trading Scenarios for June 13
📌 Scenario 1 – Short Setup (Rejection at Resistance)
Entry: 144.60 – 144.90
Stop-Loss: 145.30
Take-Profit: 143.60 → 143.07 → 142.50
📌 Scenario 2 – Long Setup (Rebound from Support)
Entry: 143.10 – 143.20
Stop-Loss: 142.70
Take-Profit: 144.00 → 144.60
✅ Wait for confirmation at key levels — avoid trading in the middle of the range when volatility is headline-driven.
✅ Conclusion
USDJPY remains trapped between strong resistance at 145.26 and buying interest at 143.07. If risk sentiment persists, the Yen may continue to strengthen. However, central bank decisions next week (Fed & BoJ) will be the major catalysts for any medium-term breakout.

GBPUSD – Sterling Slips Amid Geopolitical Risk |GBPUSD – Sterling Slips Amid Geopolitical Risk | Will Support Hold for a Bounce?
🌍 Macro & Geopolitical Overview
The British Pound (GBP) is under pressure as risk sentiment deteriorates following a sharp escalation between Israel and Iran.
Israel launched a major military campaign, striking dozens of nuclear and military facilities in northeastern Tehran.
PM Netanyahu announced the start of "Operation Rising Lion", aimed at eliminating the Iranian nuclear threat.
US President Donald Trump voiced support, stating that Iran “must never have a nuclear bomb.”
Investors reacted by fleeing to safe-haven assets, pushing the US Dollar (DXY) from 97.60 to nearly 98.30.
Meanwhile, next week’s Bank of England (BoE) and Federal Reserve meetings are in focus. Both are expected to hold rates steady, but weak UK economic data may pressure the BoE to adopt a more cautious or dovish tone.
📉 Technical Analysis – H1 Chart
🔸 Trend Structure
GBPUSD broke down from its recent high at 1.36288 and is now approaching key support between 1.35350 and 1.34957.
As long as 1.3495 holds, the move appears to be a technical correction, not a reversal.
🔸 Fibonacci & Moving Averages
Current price sits near Fibonacci 0.236 retracement of the recent swing.
Price is trading below the EMA 13 & 34, but EMA 200 near 1.353x still acts as potential support.
🔸 Resistance to Watch
The next upside target sits at 1.3588, followed by the previous high at 1.3628.
🧠 Market Sentiment
Risk aversion is dominating due to geopolitical headlines.
GBP is vulnerable as a risk-sensitive currency.
However, if tensions ease and central bank decisions next week come in line with expectations, GBP could rebound from its currently discounted levels.
🎯 Trade Setup Suggestion
✅ BUY ZONE: 1.35350 – 1.34957
Stop-Loss: 1.3460
Take-Profit Targets: 1.3588 → 1.3628
Enter only on bullish price action confirmation around the support zone.
✅ Conclusion
GBPUSD is trading under geopolitical stress, but the technical setup around 1.3495 – 1.3535 offers a potential bounce zone. A short-term recovery could unfold if sentiment stabilizes and central banks maintain the expected policy stance.
