EUR/USD Short and GBP/USD ShortEUR/USD Short
Minimum entry requirements:
- If tight non-structured 15 min continuation forms, 5 min risk entry within it if the continuation is structured on the 5 min chart or reduced risk entry on the break of it.
- If tight structured 15 min continuation forms, reduced risk entry on the break of it or 15 min risk entry within it.
- If tight non-structured 1H continuation forms, 15 min risk entry within it if the continuation is structured on the 15 min chart or reduced risk entry on the break of it.
- If tight structured 1H continuation forms, 1H risk entry within it or reduced risk entry on the break of it.
GBP/USD Short
Minimum entry requirements:
- If tight non-structured 1H continuation forms, 15 min risk entry within it if the continuation is structured on the 15 min chart.
- If tight structured 1H continuation forms, 1H risk entry within it.
Trading-forex

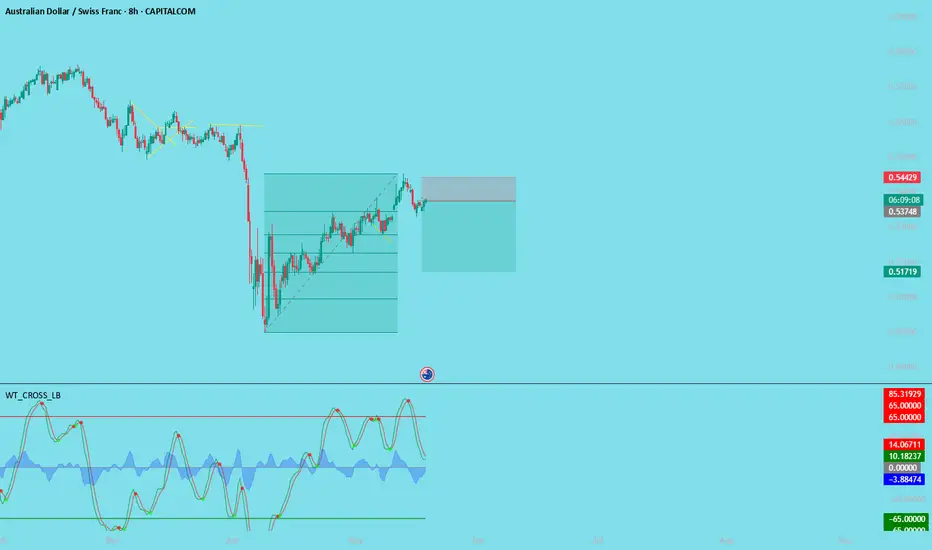
SHORT AUD CHF Investment OpportunityDear traders, I am Andrea Russo, a Forex expert and market analyst. Today I want to share with you a short opportunity on the AUDCHF pair, based on solid technical analysis and current market dynamics.
📌 Entry level: 0.5374 🎯 Take Profit (TP): 0.5173 🛑 Stop Loss (SL): 0.5440
The AUDCHF has shown signs of weakness after a consolidation phase. The bearish pressure, fueled by the strength of the Swiss franc and a climate of risk aversion, could favor a decline towards the indicated target levels.
Technical indicators confirm the strategy: 🔹 Key resistance near 0.5440, invalidation level of the position. 🔹 Bearish momentum with decreasing volumes on bullish pressures. 🔹 Short-term moving average suggesting a possible continuation of the decline.
📊 We will monitor the market to confirm the movement. Always remember to apply proper risk management!
Gold Extends Gains Post-CPI | All Eyes on PPI for the Next Move XAUUSD – Gold Extends Gains Post-CPI | All Eyes on PPI for the Next Move
🌍 Macro Pulse: CPI Sparks Momentum, But Will PPI Sustain It?
Gold surged following softer-than-expected US inflation data on Tuesday, with the CPI rising just 0.1% MoM and 2.4% YoY—both below forecasts. This triggered a broad sell-off in the USD, a pullback in Treasury yields, and a renewed appetite for non-yielding safe havens like gold.
Markets are now increasingly pricing in a rate cut by the Fed in September, adding further fuel to the rally. However, Wednesday’s US PPI data could either reinforce this bullish sentiment or reverse it sharply.
📉 Technical Landscape – H1 & H4 View
🔹 Trend Bias
The bullish structure remains intact, with price carving out higher highs and higher lows since the 3312 level. The recent breakout above 3370 confirms bullish momentum.
🔹 Price Channels
Gold continues to track within a defined ascending channel. A potential retest of the lower trendline near 3345–3350 could provide a dip-buying opportunity.
🔹 EMA Structure
The price trades comfortably above the 13, 34, 89, and 200 EMAs.
Short-term EMA crossovers are supportive of continued upside.
🔹 Critical Resistance Ahead: 3392 – 3395
A key technical zone combining Fibonacci extension levels and recent rejection wicks. A decisive break or rejection here will set the tone for the next 48 hours.
🧠 Market Psychology & PPI Scenarios
The market is currently optimistic, but still cautious. The PPI report due later today will likely serve as the next directional trigger:
If PPI prints below estimates → reinforces disinflation narrative → potential breakout above 3,400 with upside targets towards 3,420+.
If PPI comes in hot → raises concerns about sticky input costs → possible short-term reversal or consolidation.
Expect volatility to spike during the New York session.
🎯 Today’s Tactical Trade Setups – 12 June
🟢 Buy Zone: 3324 – 3322
Stop Loss: 3318
Take Profit Targets: 3330 – 3334 – 3338 – 3342 – 3346 – 3350
🟢 Buy Scalp Zone: 3337 – 3335
SL: 3330
TPs: 3341 – 3345 – 3350 – 3354 – 3360 – 3370 – 3380
🔴 Sell Zone: 3392 – 3394
Stop Loss: 3398
Take Profit Targets: 3388 – 3384 – 3380 – 3375 – 3370 – 3360 – 3350
✅ Final Take
Gold bulls are in control, but the PPI data will likely dictate whether momentum continues or stalls. With key resistance just ahead and macro risk on the table, this is not the time to trade blindly.
🧭 Strategy Tip: Let price confirm the reaction to PPI. Don’t pre-position into volatility. Play the breakout or the fade—but wait for clarity.

Gold Coiling in Rising Wedge Ahead of CPI: Breakout Imminent?XAUUSD – Gold Coiling in Rising Wedge Ahead of CPI: Breakout Imminent?
Gold (XAUUSD) is compressing within a well-defined rising wedge pattern on the 1H chart, signaling that a decisive move is near. With the U.S. CPI report due on June 12th, traders should prepare for volatility driven by macroeconomic catalysts. Whether gold breaks higher or reverses depends on how the market digests inflation data.
🌍 Macro Backdrop: All Eyes on Inflation
📌 U.S. CPI (June 12): A softer-than-expected reading could revive Fed rate cut expectations and send gold higher. A hotter-than-expected CPI could strengthen the U.S. dollar and Treasury yields, putting pressure on gold.
📌 U.S.–China Trade Sentiment: Diplomatic progress in trade talks reduces safe-haven demand in the short term, weakening gold's defensive appeal.
📌 DXY & Bond Yields: A breakout in DXY or a sharp rise in U.S. bond yields post-CPI may lead to a corrective leg lower in XAUUSD.
📈 Technical Overview – Multi-Layered Structure
Pattern: Gold is forming a rising wedge between higher lows and converging highs, typical of breakout scenarios.
Fibonacci Levels (retracement from 3,400 to 3,296):
0.382: 3,336 – intermediate support
0.618: 3,360 – significant resistance, near current swing highs
Moving Averages:
Price is currently above EMA34 and EMA89
Struggling below EMA200 (red), which acts as dynamic resistance
FVG Liquidity Zone: An open Fair Value Gap between 3,360 – 3,374 could act as a magnet before any reversal.
🎯 Trade Strategy Scenarios
🟢 Buy Scenario – Bounce from Support Zone
Entry: 3314 – 3312 | Stop-Loss: 3308 | Take-Profit: 3318, 3322, 3326, 3330, 3335, 3340
Ideal if CPI comes in lower than expected or aligns with a bullish technical rejection from wedge support.
🔴 Sell Scenario – Rejection from Resistance Zone
Entry: 3374 – 3376 | Stop-Loss: 3380 | Take-Profit: 3370, 3366, 3362, 3358, 3352, 3348, 3340
Valid if price taps into the upper liquidity zone (3,374–3,394) and fails to break, especially on CPI surprise to the upside.
🧠 Tactical Conclusion
A dovish CPI → favors BUY setup off lower wedge support
A hawkish CPI → favors SELL near upper resistance and liquidity zones
📌 The market is compressing and gearing up for a breakout. Patience is key — wait for confirmation at key zones and manage risk precisely.

Dollar Index Eyes FVG Breakout Ahead of CPIDXY 11/06 – Dollar Index Eyes FVG Breakout Ahead of CPI | Reversal Risk After 100.31?
The US Dollar Index (DXY) continues to consolidate within a rising channel on the H2 timeframe, with price tightening just ahead of a key macro event — the US CPI report. DXY is now approaching a critical Fair Value Gap (FVG) zone, where liquidity hunts and potential reversals become highly probable.
🌐 MACRO OUTLOOK & MARKET SENTIMENT
📌 US CPI (June 12):
The main macro driver for DXY this week.
A hotter-than-expected print → strengthens the Fed’s hawkish stance → DXY likely to spike.
A weaker-than-expected CPI → boosts rate cut expectations → downside pressure on DXY.
📌 Risk Sentiment:
Institutions are readjusting their exposure ahead of CPI and FOMC. This has caused DXY to hover near EMA89 — a sign of indecision.
📌 Cross-asset Flows (Bonds & Gold):
Treasury yields are stable, but surprises in CPI could lead to capital rotation between gold and USD, increasing volatility in XAUUSD and DXY simultaneously.
📈 TECHNICAL ANALYSIS
Trend Structure:
DXY is following a clean ascending channel on H2, with higher lows respecting the lower trendline.
EMA Confluence (13–34–89–200)
Price is consolidating near EMA89 and below EMA200 (99.40), forming a neutral short-term bias.
A clean breakout above EMA200 could trigger acceleration into the FVG zone.
Key FVG Zone (H2):
99.63 – 100.31 is an unfilled Fair Value Gap.
This zone may act as a magnet for price before any meaningful rejection or breakout.
Potential Reversal Area:
A rejection at 100.31 could trigger a sharp pullback toward the liquidity zone around 98.68.
🧠 STRATEGIC OUTLOOK
CPI will set the tone for DXY’s mid-term trend.
Watch the 99.63 – 100.31 FVG zone for liquidity sweeps and potential rejection.
Wait for confirmation, not prediction — especially in macro-sensitive environments.

USD/CHF ShortUSD/CHF Short
Minimum entry requirements:
- Corrective tap into area of value.
- 4H risk entry or 1H risk entry after 2 x 1H rejection candles.
Minimum entry requirements:
- Tap into area of value.
- 1H impulse down below area of value.
- If tight non-structured 5 min continuation follows, reduced risk entry on the break of it.
- If tight structured 5 min continuation follows, reduced risk entry on the break of it or 5 min risk entry within it.
- If tight non-structured 15 min continuation follows, 5 min risk entry within it if the continuation is structured on the 5 min chart or reduced risk entry on the break of it.
- If tight structured 15 min continuation follows, reduced risk entry on the break of it or 15 min risk entry within it.

Oil's Volatility Meets Fed's Patience: A Path to 1.3643?USDCAD – Oil's Volatility Meets Fed's Patience: A Path to 1.3643?
🌍 Macro Landscape: Diverging Monetary Paths & Oil's Influence
The USDCAD pair is currently navigating a complex environment shaped by diverging central bank policies and the significant influence of crude oil prices. While the Federal Reserve is signaling a "higher-for-longer" interest rate stance due to sticky inflation, the Bank of Canada (BoC) is in a more nuanced position, balancing inflation control with economic growth. This divergence creates a fundamental tailwind for the USD.
However, Canada's economy is heavily tied to commodity prices, especially crude oil. Recent volatility in oil markets can exert significant pressure on the Canadian dollar. If oil prices remain subdued or face downward pressure, it could exacerbate the CAD's weakness against the USD, amplifying the impact of policy divergence.
🏦 Central Bank Policy Divergence: Fed's Firmness vs. BoC's Caution
Federal Reserve: FOMC members continue to signal patience on rate cuts. Recent inflation data (PCE, CPI) shows persistent price pressure, particularly in the services sector, reinforcing the Fed's hawkish bias. This suggests the USD may retain its strength as higher rates attract capital.
Bank of Canada: The BoC, while having taken aggressive steps previously, might be more cautious in its future rate decisions. Any dovish undertones or hints at pausing rate hikes could weaken the CAD. Conversely, a resurgence in inflation or stronger economic data could prompt the BoC to maintain a firm stance.
This policy divergence, coupled with external factors like commodity prices, creates a fertile ground for significant moves in USDCAD.
🌐 Capital Flows: Safe-Haven Dynamics and Commodity Impact
Global capital flow models indicate a shift towards the US dollar as a preferred safe haven amidst geopolitical tensions and global economic uncertainties. While Gold remains a traditional hedge, the USD's yield advantage makes it an attractive destination for institutional capital.
For CAD, its sensitivity to commodity prices means that capital flows are heavily influenced by the outlook for global growth and energy demand. A softening global economic outlook could lead to reduced demand for commodities, weighing on the CAD, and potentially driving inflows into USD-based assets.
📊 Technical Structure: Channel Breakdown & Bearish Momentum Towards 1.3643
On the H1 chart (as observed from the provided image):
Price Channel: USDCAD has been trading within a clear ascending channel. However, the price recently broke below the lower boundary of this channel, suggesting a potential shift in momentum from bullish to bearish.
Moving Averages: The price has moved below the EMA 13 – 34 – 89. This bearish alignment (EMA "fan-out formation" in reverse) confirms a short-term bearish momentum is building. The 200 EMA (red line) is currently acting as a key resistance level, near the prior support turned resistance.
Key Resistance (Sell Zone): The region around 1.36989 (aligning with previous support and possibly a Fibonacci retracement level) is now acting as a crucial resistance. Any retest of this zone, especially with bearish candlestick patterns, could offer selling opportunities. The 200 EMA reinforces this zone as a strong overhead barrier.
Key Support (Target Zone): The price is projected towards 1.36431. This level aligns with a strong prior support and also coincides with the Fibonacci Extension 1.382 level from a previous swing, making it a high-probability target for bearish moves. A bounce from 1.36734 (a mid-channel support or Fibonacci level) could offer a temporary reprieve, but the overall technical structure points to the lower target.
🎯 Trade Strategy Recommendations
Scenario 1 – Sell the Pullback (Preferred):
Entry: 1.3685 – 1.3695 (retest of broken channel line/resistance near 1.36989, possibly confluence with 200 EMA).
Stop-Loss: 1.3720 (above recent swing high/channel top).
Take-Profit: 1.3673 (initial target) → 1.3643 (main target) → 1.3620.
Scenario 2 – Breakout Momentum Sell (if price consolidates below 1.3673):
Entry: 1.3670 (break below 1.36734 with strong bearish momentum).
Stop-Loss: 1.3690.
Take-Profit: 1.3643 → 1.3620.
⚠️ Key Events to Watch:
US PCE Price Index (upcoming data): If hotter-than-expected, this would reinforce the Fed’s hawkish tone and lift USD.
Canadian CPI (upcoming data): Cooler-than-expected inflation could prompt a more dovish stance from the BoC, weakening CAD.
Crude Oil Inventory/News: Any significant news or data regarding global oil supply/demand can directly impact CAD.

A Detailed Technical, Fundamental, and Macro AnalysisNZD/USD Trading Plan: A Detailed Technical, Fundamental, and Macro Analysis
1. Technical Analysis:
The 30-minute chart of NZD/USD highlights key price action within a well-defined channel between crucial support and resistance levels:
Resistance (0.60769): The price is testing significant resistance around 0.60769. If this level is broken, the price could continue higher, indicating further upward momentum.
Support (0.60271): A strong support level is found at 0.60271. If the price retraces and holds this level, a potential rebound could take place.
EMA (Exponential Moving Averages):
EMA 13 (Blue): Currently moving upwards, confirming a bullish short-term trend.
EMA 34 (Yellow) and EMA 89 (Red): These are trending sideways, suggesting that the market is in a consolidation phase, waiting for further signals.
2. Fundamental Analysis:
FED's Monetary Policy: The actions and statements of the Federal Reserve regarding interest rates have a significant impact on the USD. If the FED maintains or hikes rates, this could push the USD higher, putting downward pressure on NZD.
New Zealand Economic Indicators: The strength of New Zealand's economy, particularly export data, plays a vital role in supporting or weakening the NZD. Positive economic reports could support a bullish NZD.
3. Macroeconomic Analysis:
Global Risk Sentiment: Market sentiment is being influenced by global factors like trade tensions, economic growth projections, and political factors. A shift in risk sentiment, especially regarding the U.S. economy or geopolitical tensions, could lead to significant price movements in the NZD/USD pair.
4. Buy and Sell Zones:
BUY ZONE:
Entry: 0.60271 - 0.60300
SL (Stop Loss): 0.60200
TP (Take Profit): 0.60700 → 0.60769 → 0.60900
SELL ZONE:
Entry: 0.60750 - 0.60800
SL: 0.60900
TP: 0.60300 → 0.60200 → 0.60100
5. Strategy:
Buy Orders: If price consolidates at the support level of 0.60271 and shows confirmation with EMA indicators, consider a buy with a target at 0.60769.
Sell Orders: If price fails to break through the resistance at 0.60769, a sell order could be placed, targeting the 0.60271 support level.
6. Market Sentiment:
The market is highly sensitive to news and economic reports, and therefore, it is essential to remain alert to potential volatility. Any major economic release from New Zealand or U.S. Federal Reserve news could significantly influence the pair.

AUD/JPY Short, EUR/JPY Short, GBP/JPY Short and USD/CHF ShortAUD/JPY Short
Minimum entry requirements:
- 1H impulse down below area of value.
- If tight non-structured 5 min continuation follows, reduced risk entry on the break of it.
- If tight structured 5 min continuation follows, reduced risk entry on the break of it or 5 min risk entry within it.
- If tight non-structured 15 min continuation follows, 5 min risk entry within it if the continuation is structured on the 5 min chart or reduced risk entry on the break of it.
- If tight structured 15 min continuation follows, reduced risk entry on the break of it or 15 min risk entry within it.
EUR/JPY Short
Minimum entry requirements:
- If structured 1H continuation forms, 1H risk entry within it.
GBP/JPY Short
Minimum entry requirements:
- If tight non-structured 1H continuation forms, 15 min risk entry within it if the continuation is structured on the 15 min chart.
- If tight structured 1H continuation forms, 1H risk entry within it.
USD/CHF Short
Minimum entry requirements:
- Corrective tap into area of value.
- 4H risk entry or 1H risk entry after 2 x 1H rejection candles.
Minimum entry requirements:
- Tap into area of value.
- 1H impulse down below area of value.
- If tight non-structured 5 min continuation follows, reduced risk entry on the break of it.
- If tight structured 5 min continuation follows, reduced risk entry on the break of it or 5 min risk entry within it.
- If tight non-structured 15 min continuation follows, 5 min risk entry within it if the continuation is structured on the 5 min chart or reduced risk entry on the break of it.
- If tight structured 15 min continuation follows, reduced risk entry on the break of it or 15 min risk entry within it.

WILL GOLD CONTINUE ITS RALLY OR FACE A MAJOR CORRECTION? XAUUSD – WILL GOLD CONTINUE ITS RALLY OR FACE A MAJOR CORRECTION?
Gold is at a pivotal point after experiencing a significant correction following its recent rally. With the market showing mixed signals, the question now is whether gold will continue its upward trajectory or experience further corrections before breaking new highs. The current global economic climate, combined with macroeconomic factors, will be the driving forces behind gold's next move.
🌍 MACROECONOMIC OUTLOOK & MARKET SENTIMENT
US Dollar Strength: The USD has been strengthening, which has put some pressure on gold prices. However, this comes amid uncertainty in global trade relations, particularly between the US and China, which is creating mixed market sentiment. Gold remains a key asset for hedging against currency risks and geopolitical tensions.
Federal Reserve's Stance on Interest Rates: The Fed has signaled that while inflation remains a concern, it’s unlikely to cut interest rates in the near future. This could limit gold's upside potential in the short term, but the metal remains attractive due to its safe-haven status.
Geopolitical Tensions: With ongoing concerns over US-China trade talks and tensions surrounding Ukraine, investors continue to flock to gold as a hedge against political and economic instability. These external pressures continue to fuel demand for gold.
📈 TECHNICAL ANALYSIS (H1 – EMA 13/34/89/200)
Current Correction: Gold has been correcting after a strong surge, testing key support levels like 3300. On the H1 timeframe, the EMA indicators suggest consolidation and weakness, signaling that further pullbacks are possible before any potential breakout.
Technical Pattern – "Flag" Formation: Gold is forming a bearish flag pattern, indicating a temporary pause after a strong upward trend. This pattern suggests that gold might continue to trade sideways, with a breakout above key resistance levels leading to a continuation of the uptrend.
Key Resistance and Support Levels: Gold is facing significant resistance levels at 3320 and 3330, while key support levels at 3300 and 3270 will be crucial to watch in the coming sessions.
📍 KEY LEVELS TO WATCH
Resistance Levels: 3320 – 3330 – 3338 – 3350 – 3360
Support Levels: 3300 – 3270 – 3250
🧭 RECOMMENDED TRADE SETUPS
🔵 BUY ZONE: 3270 – 3272
SL: 3265
TP: 3280 → 3300 → 3320 → 3330 → 3350
🔻 SELL ZONE: 3320 – 3325
SL: 3330
TP: 3310 → 3295 → 3280 → 3265
✅ SUMMARY
Gold is currently experiencing a correction after a solid rally, but the long-term outlook remains bullish. Macro-economic factors, including the Fed’s policies and geopolitical risks, are likely to drive gold prices higher in the future. However, short-term fluctuations should be expected as the market tests key resistance and support levels.
Traders should focus on well-defined entry and exit points within these key levels and maintain a disciplined risk management strategy.

09/06/2025: WILL WE SEE A BREAKOUT ABOVE 1.3550?GBP/USD PLAN – 09/06/2025: WILL WE SEE A BREAKOUT ABOVE 1.3550?
🌍 Macroeconomic & Fundamental Context:
UK Economic Outlook (BoE): The Bank of England (BoE) is under pressure due to inflation and has to make decisions regarding interest rate policy. Diverging opinions on whether to raise or lower rates are creating uncertainty in the market.
US Economic Outlook (Fed): The Federal Reserve's monetary policy continues to be a major influence on the USD, especially as the Fed maintains its rate hikes to control inflation.
US-UK Trade Relations: Trade negotiations between the US and the UK will remain an important factor this week, and any new developments could impact GBP/USD.
📉 Technical Analysis – GBP/USD:
On the H4 and H1 timeframes, GBP/USD is consolidating within a corrective structure, and price has broken several key Fibonacci levels. The EMA indicators (13, 34, 89) are showing strong momentum.
Key Resistance Levels:
1.3550 – This is a major resistance level. If broken, GBP/USD could continue its rally towards 1.3612.
Key Support Levels:
1.3520 – A short-term support level. If this breaks, price may retrace back to 1.3470.
🎯 Trading Scenarios for Today:
🟢 BUY ZONE:
Buy Zone: 1.3520 – 1.3500
SL: 1.3480
TP: 1.3550 → 1.3570 → 1.3600 → 1.3620 → 1.3650
If price retraces to 1.3520 – 1.3500, this would be an ideal buying opportunity with a target at 1.3550. Look for confirmation from technical indicators and the current trend.
🔴 SELL ZONE:
Sell Zone: 1.3550 – 1.3570
SL: 1.3590
TP: 1.3520 → 1.3500 → 1.3470 → 1.3450 → 1.3420
If price reaches the resistance zone of 1.3550 – 1.3570, consider selling with targets at the support levels below.
🟡 Scalping:
Buy Scalping: 1.3520 → 1.3500
Sell Scalping: 1.3570 → 1.3600
Look for short-term opportunities when price moves within the range.
⚠️ Important Notes:
Pay close attention to short-term fluctuations and any major economic data releases from the BoE and Fed.
Risk management is key during volatile periods.
📌 Conclusion:
GBP/USD is in a short-term corrective phase, but a breakout above 1.3550 could trigger a strong rally. Traders should monitor support and resistance levels carefully and ensure risk management is in place.

WILL EUR CONTINUE TO RALLY AHEAD OF THE IMPORTANT NFP DATA?EUR/USD – WILL EUR CONTINUE TO RALLY AHEAD OF THE IMPORTANT NFP DATA?
📈 EUR/USD IS AT A CRITICAL POINT AHEAD OF KEY ECONOMIC DATA
Amid the ongoing pressure on the US Dollar and macroeconomic factors supporting the Euro, EUR/USD might continue its short-term bullish trend. However, key data such as US CPI and central bank meetings could determine the direction for this currency pair moving forward.
🌍 Macroeconomic Overview & Market Sentiment
USD & DXY: The US Dollar continues to weaken due to signals from the Federal Reserve (Fed) that they are not in a hurry to cut interest rates. DXY has fallen below the 99 level, with macroeconomic factors showing a continued bearish trend for the USD.
Eurozone: The ECB (European Central Bank) is maintaining a slightly tight monetary policy. However, the Eurozone economy is showing signs of recovery, with positive data from the region.
US Economy: Forecasts for the US labor market data could impact the USD and lead to volatility in the EUR/USD pair. All attention is on the reports from the US this week.
📊 Technical Analysis (H1 – H4 – D1)
EMA 13/34/89/200: The EMA indicators on the H1 and H4 timeframes support the current bullish trend for EUR/USD in the short term. In particular, the EMA 13 and EMA 34 are crossing above the EMA 200, signaling a strong upward trend.
Wave Structure: EUR/USD is currently in a corrective wave after testing the strong resistance level at 1.1450. A recovery signal is emerging around the support level at 1.1380, which could present a buying opportunity in the short term.
Fibonacci Expansion: The Fibonacci extension levels at 1.1470 and 1.1490 could be the next targets if EUR/USD breaks through the 1.1400 resistance zone.
⚡ Key Levels to Watch
Resistance: 1.1450, 1.1470, 1.1490, 1.1500
Support: 1.1380, 1.1350, 1.1320, 1.1300
🧭 Trading Scenario
🔵 BUY ZONE: 1.1380 – 1.1365
SL: 1.1340
TP: 1.1420 → 1.1450 → 1.1470 → 1.1490
🔻 SELL ZONE: 1.1450 – 1.1460
SL: 1.1475
TP: 1.1420 → 1.1400 → 1.1370 → 1.1350
✅ Summary
EUR/USD is currently in a short-term bullish trend and could continue to rise if the support at 1.1365 holds. However, key economic data from the US, especially CPI and central bank meetings from the Fed and ECB, could impact the next direction for this pair. Traders should keep an eye on important support and resistance levels to identify safe trading opportunities.

Will the Trend Explode or Continue to Retrace? XAUUSD Trading Plan - Will the Trend Explode or Continue to Retrace? 🔥
📉 Current Situation:
Gold is currently undergoing a retracement after a strong increase at the beginning of the week. The market is being influenced by macroeconomic factors like the US-China trade negotiations and fluctuations in the US dollar. Gold may either continue its retracement or break out of the current price range.
🔧 Technical Analysis:
🔶 Key Levels:
🔶 Support Zone: 3,276.121 - 3,289.874. These zones are crucial in confirming the strength of the bullish trend.
🔶 Resistance Zone: 3,345.715, 3,363.845. If these levels are broken, gold could continue to rise sharply.
📊 Technical Indicators:
The Exponential Moving Averages (EMA) 13, 34, and 89 support the short-term bullish trend.
The trendline shows that the bullish trend is intact, but a slight correction may happen in the short term.
💼 Fundamental and Macro Analysis:
The US-China trade negotiations are the key drivers of market sentiment. If the negotiations yield positive news, gold could continue to rise. However, if concerns arise about tariffs or failed talks, gold could face pressure.
Key US economic indicators, such as PMI, GDP, and NFP, will play a crucial role in shaping the direction of the US dollar, and thus, the price of gold.
🎯 Trading Plan:
🔶 Buy Zone:
Entry Zone: 3,289.874 - 3,276.121
Stop Loss (SL): 3,269.000
Take Profit (TP):
TP 1: 3,302.000
TP 2: 3,317.000
TP 3: 3,327.000
TP 4: 3,340.000
🔶 Sell Zone:
Entry Zone: 3,345.715 - 3,363.845
Stop Loss (SL): 3,370.000
Take Profit (TP):
TP 1: 3,327.000
TP 2: 3,310.000
TP 3: 3,300.000
TP 4: 3,289.000
⚠️ Key Points to Watch:
🔒 Strong Support Zone: 3,289.874 represents a key support zone. If the price breaks below this level, we could see gold approach 3,276.121.
🔓 Strong Resistance Zone: 3,345.715 - 3,363.845 is the key resistance zone. If broken, gold could continue to rise to 3,380.000 or higher.
📈 Market Psychology:
Gold is in a retracement phase after a significant rise, but both technical and fundamental factors suggest that the bullish trend may continue. It is essential to closely monitor signals from the US-China trade negotiations and economic news affecting the US dollar.
💥 Conclusion:
Gold is in a retracement phase after a strong increase, but technical and fundamental factors indicate that a bullish recovery could be on the horizon. Prepare your trading plans based on key support and resistance levels.
📌 Good luck and happy trading to all!

USD/JPY Short, AUD/NZD Short, AUD/JPY Neutral and EUR/USD ShortUSD/JPY Short
Minimum entry requirements:
- If tight non-structured 5 min continuation forms, reduced risk entry on the break of it.
- If tight structured 5 min continuation forms, reduced risk entry on the break of it or 5 min risk entry within it.
- If tight non-structured 15 min continuation forms, 5 min risk entry within it if the continuation is structured on the 5 min chart or reduced risk entry on the break of it.
- If tight structured 15 min continuation forms, reduced risk entry on the break of it or 15 min risk entry within it.
AUD/NZD Short
Minimum entry requirements:
- If tight non-structured 15 min continuation forms, 5 min risk entry within it if the continuation is structured on the 5 min chart or reduced risk entry on the break of it.
- If tight structured 15 min continuation forms, reduced risk entry on the break of it or 15 min risk entry within it.
AUD/JPY Neutral
Minimum entry requirements:
- If structured 1H continuation forms, 1H risk entry within it.
Minimum entry requirements:
- 1H impulse down below area of value.
- If tight non-structured 5 min continuation follows, reduced risk entry on the break of it.
- If tight structured 5 min continuation follows, reduced risk entry on the break of it or 5 min risk entry within it.
- If tight non-structured 15 min continuation follows, 5 min risk entry within it if the continuation is structured on the 5 min chart or reduced risk entry on the break of it.
- If tight structured 15 min continuation follows, reduced risk entry on the break of it or 15 min risk entry within it.
EUR/USD Short
Minimum entry requirements:
- Tap into area of value.
- 1H impulse down below area of value.
- If tight non-structured 15 min continuation follows, 5 min risk entry within it if the continuation is structured on the 5 min chart or reduced risk entry on the break of it.
- If tight structured 15 min continuation follows, reduced risk entry on the break of it or 15 min risk entry within it.

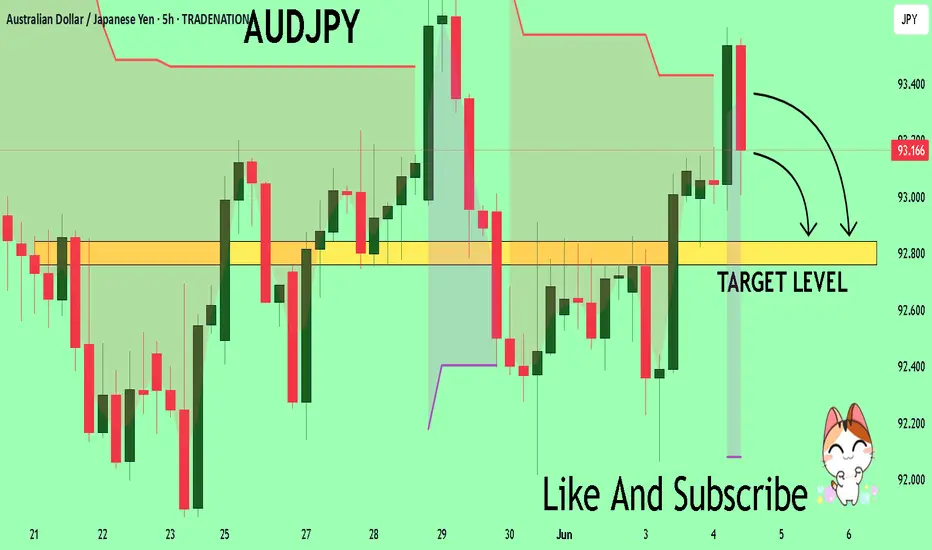
AUDJPY Trading Opportunity! SELL!
My dear friends,
Please, find my technical outlook for AUDJPY below:
The instrument tests an important psychological level 93.263
Bias - Bearish
Technical Indicators: Supper Trend gives a precise Bearish signal, while Pivot Point HL predicts price changes and potential reversals in the market.
Target - 92.841
About Used Indicators:
Super-trend indicator is more useful in trending markets where there are clear uptrends and downtrends in price.
Disclosure: I am part of Trade Nation's Influencer program and receive a monthly fee for using their TradingView charts in my analysis.
———————————
WISH YOU ALL LUCK
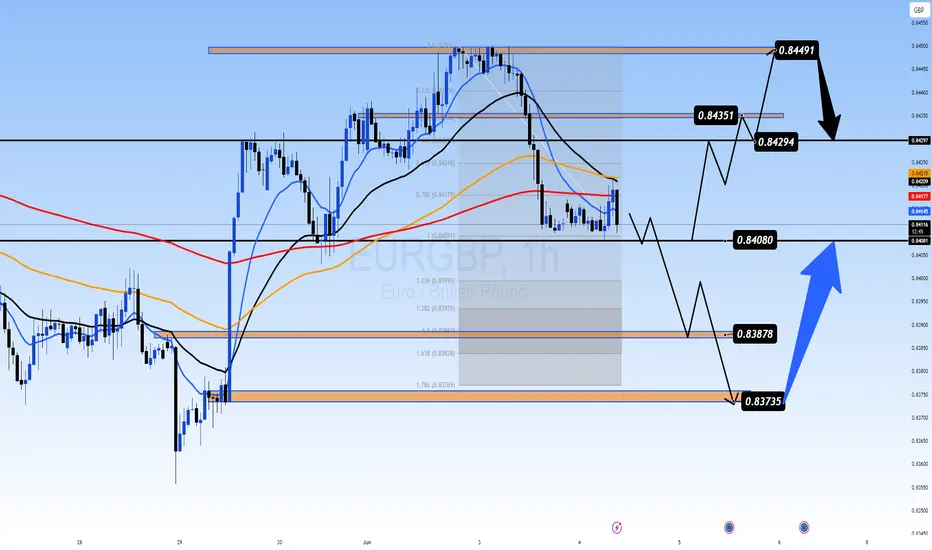
EUR/GBP BULLS WILL DOMINATE THE MARKET|LONG
EUR/GBP SIGNAL
Trade Direction: long
Entry Level: 0.837
Target Level: 0.843
Stop Loss: 0.832
RISK PROFILE
Risk level: medium
Suggested risk: 1%
Timeframe: 9h
Disclosure: I am part of Trade Nation's Influencer program and receive a monthly fee for using their TradingView charts in my analysis.
✅LIKE AND COMMENT MY IDEAS✅

USDCAD 04/06 – BoC Rate Decision Ahead USDCAD 04/06 – BoC Rate Decision Ahead | Will the Market Break Higher or Reverse From 1.3820?
The USDCAD pair is trading around the 1.3700 area as markets prepare for the upcoming Bank of Canada (BoC) interest rate decision. Price action shows potential for a breakout, but macro risks remain high.
🌍 MACRO OUTLOOK
BoC Expected to Hold Rates
Analysts widely expect the BoC to keep the interest rate unchanged at 2.75%, marking the third consecutive pause. Inflation has slipped below 2%, supporting the case for a dovish tone.
Trade Policy in Focus
With growing global uncertainties and Trump’s trade stance back in the spotlight, BoC Governor Tiff Macklem is expected to address policy risks, especially related to tariffs.
Market Sentiment
USD is mildly weaker after soft ISM data.
CAD remains near YTD highs but sensitive to policy commentary.
📉 TECHNICAL OUTLOOK – H2 Chart
Price is forming a potential double bottom near the 1.3693 zone – a key structure support.
Resistance sits at 1.3725 – 1.3757. A confirmed breakout could lead to a test of 1.3824, the recent high.
Failure to hold 1.3690 may expose deeper downside toward 1.3620–1.3600.
🔑 KEY LEVELS TO WATCH
🟢 BUY ZONE: 1.3693 – 1.3700
SL: 1.3670
TP: 1.3725 → 1.3757 → 1.3800 → 1.3824
🔴 SELL ZONE: 1.3824 – 1.3830
SL: 1.3850
TP: 1.3780 → 1.3750 → 1.3700 → 1.3650
🎯 TRADE STRATEGY
If BoC holds rates with a dovish bias, USDCAD may rally sharply toward 1.3824 and potentially higher.
If BoC surprises with hawkish comments, CAD strength may push the pair lower, targeting the 1.36 handle.
Traders should be cautious around 1.3690 – this is the pivot zone for the week.
📌 CONCLUSION
“The BoC’s decision may already be priced in – but the true volatility could come from Governor Macklem’s press conference. Any hint regarding Trump’s trade policies could trigger sharp moves. Stick to clean key levels and protect your capital.”

PMI Divergence & ECB Rate Decision Looms:0.84 Key Level in PlayEURGBP 04/06 – PMI Divergence & ECB Rate Decision Looms: 0.84 Key Level in Play
EUR/GBP is hovering around the 0.8420 mark after mixed PMI releases from the Eurozone and Germany. Traders are cautiously awaiting the ECB’s interest rate decision this Thursday, while the Bank of England signals potential easing — but remains non-committal on timing.
🌍 MACRO OUTLOOK
Eurozone & German PMI:
Eurozone Composite PMI eased to 50.2, still above forecasts (49.5) but reflecting slowing momentum.
German Composite dropped to 48.5; Services fell further to 47.1 — signaling contraction risk in Europe’s largest economy.
ECB Dovish Expectations:
Core inflation fell to 1.9% YoY in May — below the 2% ECB target for the first time in eight months.
Markets are fully pricing in a 25bps rate cut this week.
BoE Shifts Cautiously Dovish:
Governor Andrew Bailey acknowledged that monetary easing is likely, but warned of "uncertainty ahead."
The MPC is split — some fear sticky inflation; others warn that rates staying too high too long may damage growth.
Market Sentiment:
EUR remains pressured by ECB dovish expectations.
GBP is also under pressure from weak UK macro indicators and global trade tensions.
📉 TECHNICAL OUTLOOK (H1 Chart)
Price is consolidating near the EMA200 (0.8409) — a crucial dynamic support.
A tight sideways range has formed; 0.8408 is a key horizontal level to watch for breakout/breakdown confirmation.
Break below 0.8408 could send price toward Fibo 1.618 at 0.8383 or psychological support at 0.8373.
If bulls defend 0.8408, we may see a bounce toward 0.8429 → 0.8449 resistance zone.
🔑 KEY TRADE ZONES
🟢 BUY ZONE: 0.8380 – 0.8373
SL: 0.8358
TP: 0.8400 → 0.8415 → 0.8429 → 0.8435
🔴 SELL ZONE: 0.8448 – 0.8450
SL: 0.8460
TP: 0.8435 → 0.8420 → 0.8408 → 0.8388
⚠️ TRADE STRATEGY
Watch the 0.8408 area closely. If price holds → short-term BUY scalp opportunities.
If it breaks strongly → consider SELL toward lower Fibo/structure levels at 0.838x.
Be cautious around ECB release — avoid trading during the spike. Wait for structure confirmation post-news.
📌 CONCLUSION
"EUR/GBP is entering a critical zone near 0.8400. With ECB and BoE both leaning dovish, expect increased volatility. Hold or break at this key level will likely define the next directional leg. Stay patient and let the market show its hand."
GBPUSD – Is the Recovery Losing Steam? GBPUSD – Is the Recovery Losing Steam? Watch for Technical Pullback Ahead of NFP
The GBPUSD pair has recently rebounded impressively from the 1.3427 key support zone, reflecting short-term USD weakness and growing speculation of rate cuts by the Fed. However, after the strong bullish move, the market is now showing signs of exhaustion and potential profit-taking—especially with high-impact US employment data just around the corner.
🔍 Macro & Fundamental Overview:
United States: All eyes are on this week’s JOLTS and Non-Farm Payrolls (NFP) reports. Weak jobs data could strengthen the case for rate cuts by the Fed in Q3, weighing on the US Dollar. On the flip side, a solid print would revive “higher for longer” rate expectations and likely support USD strength.
United Kingdom: Although inflation remains above the Bank of England’s 2% target, political uncertainty ahead of July’s general election may keep GBP on the defensive, especially if BoE signals a dovish turn.
Bond Yield Spread (UK vs US): A widening spread in favor of the USD is exerting downward pressure on GBPUSD in the medium term.
📈 Technical Outlook (H1 Chart):
Structure: Price has formed a double-top pattern at 1.35598 and 1.35322, with multiple rejections—signaling a weakening bullish momentum after a sustained rally.
EMA 13 – 34 – 89 – 200 Setup: Price is currently testing the EMA89 zone (~1.34854). A clean break below this moving average could accelerate the downside correction.
FVG Zone (Liquidity Pool): The 1.3427 – 1.3457 area offers a potential liquidity sweep and may serve as a springboard for the next bullish leg.
📊 Trade Scenarios:
🔻 Short-Term SELL SCALP:
Entry: 1.3532 – 1.3545
Stop Loss: 1.3565
Take Profit: 1.3485 → 1.3457 → 1.3427
→ Ideal if price fails to hold above recent highs and forms bearish rejection candles.
🔵 BUY ZONE Setup:
Entry: 1.3427 – 1.3440
Stop Loss: 1.3400
Take Profit: 1.3475 → 1.3505 → 1.3535 → 1.3555
→ High-probability entry if price reacts positively to the FVG zone and maintains bullish structure.
📌 Final Thoughts:
GBPUSD is currently in a delicate zone where both technical and macro forces are converging. While the broader trend remains bullish, momentum is slowing. With critical US jobs data due, traders should stay cautious and rely on clear confirmations around key price levels. Maintain strict risk management and look for liquidity-driven moves around FVG zones.

EURUSD – Retracement Expected Before Further UpsideEURUSD – Retracement Expected Before Further Upside
The EURUSD pair has seen strong bullish momentum over the past two days, mainly driven by the weakening U.S. dollar. Last week’s softer-than-expected U.S. Core PCE and PMI data fueled speculation that the Federal Reserve may hold rates steady for longer, weighing on USD sentiment.
However, with upcoming speeches from FOMC members and the Non-Farm Payrolls (NFP) data due later this week, traders may look to take profit or step aside, leading to a short-term retracement before any continuation of the bullish trend.
🔍 Macro & Fundamental Overview:
USD remains under pressure amid declining inflation signals and weakening economic data.
ECB is expected to cut rates, but at a slower pace than the Fed, creating a divergence that supports the Euro in the near term.
Political uncertainties in the EU, including upcoming elections, are worth monitoring.
📉 Technical Analysis:
The medium-term trend remains bullish with EMA 13–34–89–200 aligned to the upside.
Price is currently reacting at the 0.0 FIBO level (1.1420), suggesting a potential pullback.
Key support lies between 1.1345 – 1.1317. If this zone holds, it could serve as a solid base for a bullish continuation.
🧭 Suggested Trade Scenarios:
🔵 BUY ZONE: 1.1317 – 1.1345
SL: 1.1285
TP: 1.1370 → 1.1400 → 1.1420 → 1.1450+
🔻 SELL ZONE (Short-term counter-trade): 1.1418 – 1.1425
SL: 1.1450
TP: 1.1385 → 1.1350 → 1.1320

Will the Dollar’s Drop Fuel More Gold Upside After Weak PCE DXY OUTLOOK – Will the Dollar’s Drop Fuel More Gold Upside After Weak PCE and Trade Tensions?
📉 TECHNICAL STRUCTURE – DXY CONTINUES TO WEAKEN
The US Dollar Index (DXY) has failed to hold the 99.20–99.30 support zone and continues to respect its bearish structure on the H2 chart. The sharp sell-off at the end of May was a direct response to weaker-than-expected PCE inflation data, combined with growing political uncertainty surrounding US–China and US–EU trade negotiations.
🔻 Key Resistance Levels: 99.234 – 99.618
🔻 Key Support Zone: 98.030 – A clean break below this may open the door toward 97.50
🌍 MACRO CONTEXT – USD UNDER PRESSURE ON MULTIPLE FRONTS
Trump’s tariff decisions remain unclear. While some deadlines were delayed (e.g., steel tariffs on the EU), no substantial agreements have been reached.
Core PCE inflation – the Fed’s preferred gauge – continues to ease, reducing expectations of further rate hikes in the short term.
Institutional flows are shifting toward safe havens like gold, especially as uncertainty clouds the outlook for both US fiscal and trade policy.
📊 IMPACT ON XAUUSD – DOLLAR DROP GIVES GOLD ROOM TO RALLY
Gold remains supported by:
A weakening DXY trend
A bullish structure on H1 with EMA 13–34–89–200 alignment in favor of upside
Strong safe-haven demand heading into a new month with fresh capital inflows
If DXY breaks below 98.70 and slides toward 98.030, gold could extend its rally toward key resistance zones at 3348 – 3361.
🎯 TRADING STRATEGY (Based on DXY Bearish Continuation):
Prioritize buy setups on XAUUSD if DXY fails to reclaim the 99.23 resistance
Watch for a potential DXY pullback to resistance – if rejected, this would confirm momentum for gold to climb further
📌 NOTE: Traders should stay alert to any major news from the Fed or new developments in US–China–EU trade talks. While the current DXY structure favors continued downside, short-term pullbacks can provide gold with consolidation before another leg higher.

GEOPOLITICAL TENSIONS & DOLLAR FATIGUE SUPPORT GOLDMACRO CONTEXT – GEOPOLITICAL TENSIONS & DOLLAR FATIGUE SUPPORT GOLD
US-China trade friction is heating up, and ongoing tax negotiations with the EU have stalled. Investors are growing wary of prolonged policy uncertainties.
The US Dollar Index (DXY) has pulled back from recent highs, with market expectations cooling on aggressive Fed policy.
Gold is regaining safe-haven status amid rising geopolitical noise and weakening risk appetite early in June.
📉 TECHNICAL OUTLOOK – STRUCTURE FLIP & RETEST POTENTIAL
A clear breakout above the descending trendline and multiple moving averages (EMA 13–34–89–200) confirms strong short-term bullish structure.
Institutional footprints likely evident from the Asian session impulse candle.
The next upside targets lie at 3,348 and 3,361, with high probability of a retest toward breakout zones.
🔑 KEY PRICE ZONES & STRATEGY
🟢 BUY ZONE ON RETEST:
Entry: 3,325 – 3,322
Stop-Loss: 3,317
Take-Profit: 3,330 → 3,340 → 3,348 → 3,361
🔴 SELL ZONE (OVEREXTENSION SCENARIO):
Entry: 3,361 – 3,364
Stop-Loss: 3,370
Take-Profit: 3,355 → 3,348 → 3,340 → 3,330
📌 STRATEGIC NOTES
As long as 3,322 holds as support, buyers remain in control.
A clean retest of this zone may present a prime long opportunity.
Failure to hold may lead to a drop toward the EMA confluence between 3,301 – 3,294, where buyers could reload.
✅ Conclusion: Gold has flipped bullish with a convincing breakout. Traders should favor buy-the-dip setups while monitoring resistance at 3,348 – 3,361 for potential profit-taking or short-term reversals.

USDJPY 4H Analysis – Market Dynamics ChangingDear Traders,
Guys, the bearish trend in USDJPY has now shifted into a bullish uptrend. My target level for USDJPY is 146.330. Once it reaches my target, I will share updates under this post.
Friends, every single like from you is my biggest source of motivation when it comes to sharing my analysis.
A huge thank you to everyone who supports me with their likes!
