EURUSD PLAN – Is the Rebound Just a Pause Before the Drop? EURUSD PLAN – Is the Rebound Just a Pause Before the Drop? | All Eyes on PCE
📊 MACRO OUTLOOK:
Following the latest FOMC meeting, the Fed kept interest rates unchanged, as expected, but maintained a hawkish tone. Chair Powell reiterated that inflation remains too sticky to consider rate cuts in the near term.
Markets now await this week’s US PCE data — the Fed’s preferred inflation gauge — which could provide the next major catalyst for USD strength or weakness.
On the Euro side, weak consumer confidence and tepid growth have strengthened expectations for an ECB rate cut in June. This divergence in monetary policy is weighing on the Euro, as the Dollar finds new demand amid global risk recalibration.
📉 TECHNICAL OUTLOOK (H1):
EURUSD has broken down from recent highs near 1.1412 and is now forming a bearish retracement pattern.
Price has broken below the 89-EMA and 200-EMA, signaling bearish structure.
Current price action suggests a temporary bounce from the 1.1260–1.1280 support zone (Fibo 38.2%–50%), but the broader trend remains bearish.
Fibonacci retracement from recent swing lows highlights 1.1338 and 1.1372 as key resistance levels to watch.
🔑 KEY TECHNICAL ZONES:
Resistance Zones:
• 1.1313 – Minor intraday level (Fibo 0.5)
• 1.1338 – EMA confluence + former structure
• 1.1372 – Major rejection zone (previous distribution top)
Support Zones:
• 1.1280 – 1.1260 – Current support bounce area
• 1.1220 – Key liquidity sweep zone
🧭 TRADE STRATEGY:
Scenario A – Sell the Pullback:
• Wait for a rebound into the 1.1313 – 1.1338 zone
• Enter SELL if bearish rejection forms
• SL: 1.1376
• TP: 1.1280 → 1.1260 → 1.1220
Scenario B – Invalid Breakout:
• If price breaks above 1.1372 with momentum, this plan is invalidated — wait for a confirmed breakout retest.
Scenario C – Reactive Buy Scalp:
• If price shows strong rejection from 1.1260 again, scalpers may consider a temporary BUY back toward 1.1300–1.1310
• This is high-risk and counter-trend.
⚠️ STRATEGIC NOTES:
EURUSD remains in a bearish bias until major resistance levels are broken. With PCE data approaching, volatility is likely. Trade setups should be based on confirmation signals and managed tightly as macro data can shift momentum rapidly.
Trading-forex

XAUUSD – Post-FOMC Trading Plan | Key Resistance: 3308 – 3310XAUUSD – Post-FOMC Trading Plan | Key Resistance: 3308 – 3310
📊 MACRO UPDATE – After the FOMC Decision:
The Fed kept interest rates unchanged as expected, but the tone remained hawkish. Chairman Powell reiterated that inflation remains too high and ruled out any near-term rate cuts, signaling prolonged restrictive policy.
This led to a swift rebound in the US Dollar and Treasury yields, weighing on gold. However, XAUUSD bounced back late in the session, suggesting the market is re-evaluating key technical zones post-announcement.
📉 TECHNICAL ANALYSIS – H1/H4 Chart Structure:
Gold remains in a corrective descending structure but is now reacting around key Fibonacci levels. The 13–34–89 EMAs provide dynamic support and resistance, and a potential double bottom has formed near the 3245–3247 zone.
🧠 Two key levels to watch:
3308–3310: major resistance with trendline + FVG confluence
3245–3247: strong horizontal support + Fib 0.618 retracement
🎯 TRADE SETUPS:
🔵 BUY ZONE: 3247 – 3245
Stop-Loss: 3241
Take-Profit: 3251 → 3255 → 3260 → 3264 → 3270 → 3275 → 3280
🔵 BUY SCALP: 3263 – 3261
Stop-Loss: 3257
Take-Profit: 3266 → 3270 → 3275 → 3280 → 3290 → 3300
🔴 SELL SCALP: 3294 – 3296
Stop-Loss: 3300
Take-Profit: 3290 → 3286 → 3282 → 3278 → 3274 → 3270 → 3260
🔴 SELL ZONE: 3308 – 3310
Stop-Loss: 3314
Take-Profit: 3304 → 3300 → 3296 → 3292 → 3288 → 3280
📌 STRATEGIC OUTLOOK:
Unless price breaks above 3310 with strong momentum, sellers are still in control short term. Any rejection from the resistance zone could offer clean short entries. A breakout, however, would shift sentiment and expose 3340–3360 next.
Patience is key — let price react before committing to entries.

Will Gold Break Through 3366 or Collapse Before NFP? XAUUSD PLAN – MAY 26 | Will Gold Break Through 3366 or Collapse Before NFP?
Gold is approaching a key resistance zone as geopolitical uncertainty and shifting Fed signals add volatility to global markets. While recent bullish momentum has been strong, traders should prepare for potential shakeouts ahead of NFP week.
🌍 MACRO & FUNDAMENTAL CONTEXT
US–Iran Tensions on the Rise: Iran has warned the US it will bear full responsibility if Israel attacks its nuclear facilities. This comes just days before both sides are scheduled to resume nuclear negotiations, increasing the risk of escalation.
Goldman Sachs Signals a Safe-Haven Shift: With 20-year US bond auctions failing and yields surging, Goldman Sachs now recommends gold and Bitcoin as core hedge assets against fiscal instability and a weakening dollar.
DXY Losing Steam: The US Dollar Index is cooling off after a short-term rally, with Fed rate hike expectations becoming less certain.
📉 TECHNICAL ANALYSIS – XAUUSD (M30 – H1)
Gold is consolidating in a bullish structure, bouncing within a rising channel and showing signs of potential continuation.
EMA13/EMA34 have crossed above EMA200 on the M30 chart → a sign of trend strength building.
A large Fair Value Gap (FVG) remains unfilled near 3360–3395 → potential magnet zone if bullish breakout succeeds.
🎯 TRADE SETUPS FOR TODAY
🟢 BUY SCALP
Entry: 3304 – 3302
SL: 3298
TP: 3308 → 3312 → 3316 → 3320 → 3325 → 3330 → 3340
🟢 BUY ZONE
Entry: 3276 – 3274
SL: 3270
TP: 3280 → 3284 → 3288 → 3292 → 3296 → 3300
🔴 SELL SCALP
Entry: 3344 – 3346
SL: 3350
TP: 3340 → 3336 → 3332 → 3328 → 3324 → 3320
🔴 SELL ZONE
Entry: 3376 – 3378
SL: 3382
TP: 3372 → 3368 → 3364 → 3360 → 3350
🧩 STRATEGIC KEYLEVELS
Key SELL Zone: 3358–3360 → If broken, gold may rush toward ATH targets.
Key BUY Zone: 3276–3274 → If lost, a deep retracement below 3200 is likely.
⚠️ NOTES TO TRADERS
This is a geo-politically sensitive market. Sudden news or tweets can trigger explosive moves.
Always wait for confirmation near key zones. Don't chase breakouts without structure.
Risk management is critical.
✅ SUMMARY:
"Political risk is the fuel. Gold is the fire. Stay sharp around the key levels and don't get caught in false breakouts. Be reactive, not predictive."

USDCHF – Awaiting Breakout Ahead of FOMC: Key Levels in Focus USDCHF – Awaiting Breakout Ahead of FOMC: Key Levels in Focus
📌 MARKET OVERVIEW
USDCHF is currently consolidating within a tight range after a technical rebound from the 0.8226 support zone. The price is testing a confluence area at the descending trendline and the 200 EMA on the H2 chart, indicating indecision between bulls and bears as we head into the high-impact FOMC event.
🔍 TECHNICAL ANALYSIS – H2 CHART
Overall Trend: Sideways corrective move within a broader downtrend channel. Price is approaching critical resistance at the EMA200 and the channel’s upper boundary.
EMAs in focus: EMA13 (black), EMA34 (orange), EMA89 (red).
Fibonacci Retracement: Price is hovering around the 0.5 fib zone (0.8298), a neutral level for potential reaction.
🎯 Key Levels & Trade Scenarios:
Major Resistance Zone: 0.8330 – 0.8368 → aligned with the 0.618 Fibonacci retracement and previous structural high.
Key Support Zone: 0.8226 → strong demand area. A break below this could expose deeper downside or set up a false break trap.
📌 Most Likely Path:
Price could dip back to 0.8226 before launching a bullish recovery targeting 0.8330 – 0.8368.
A clean breakout above 0.8368 with momentum and volume could invalidate the bearish bias and shift the trend mid-term.
🌍 MACRO & FUNDAMENTAL CONTEXT
FOMC IN FOCUS: The Federal Reserve is expected to hold rates steady at the upcoming meeting. However, market attention will be on Powell’s tone. A hawkish stance could fuel further USD strength, propelling USDCHF toward resistance zones.
SNB (Swiss National Bank) maintains a neutral tone with slight disinflationary concerns, offering limited support for the CHF and strengthening the USDCHF upside case.
US Treasury Yields are showing signs of recovery, adding bullish pressure to USD pairs.
📌 TRADING STRATEGY:
Watch for bullish reaction at 0.8226 – potential long setup if RSI divergence appears.
Short-term targets: 0.8330 → 0.8368.
Breakout Strategy: If price clears 0.8368 with conviction, shift bias to bullish continuation and monitor for FVG or trendline breakout alignment.
📣 Stay sharp for increased volatility around FOMC. Position sizing and discipline are key in macro-heavy weeks like this.

USDJPY PLAN – Will FOMC Be the Next Big Catalyst?USDJPY PLAN – Will FOMC Be the Next Big Catalyst?
💬 After several sessions of sideways movement, USDJPY is showing signs of a potential breakout, supported by both technical signals and macro fundamentals. As the FOMC meeting approaches, the market is poised for a major shift — making this the perfect time to prepare actionable trade plans.
🔍 TECHNICAL ANALYSIS
Primary Trend: Short-term bullish retracement within a broader downtrend – currently testing the 200 EMA on H2.
EMAs in use: EMA13 (black), EMA34 (orange), EMA89 (red) – effective dynamic support/resistance indicators.
Key Resistance Levels:
145.35: Major confluence zone with 0.618 Fibonacci and trendline resistance.
146.11 – 147.20: Previous highs and Fibonacci extension targets.
Key Support Zones:
144.61: EMA200 acting as immediate pressure point.
143.43 – 143.02: Crucial demand zone with strong reaction expected on pullback.
🌍 MACRO & FUNDAMENTAL FACTORS
FOMC Outlook: With recent CPI data softening and labor numbers moderating, markets anticipate a hold on rates. However, any hawkish tone from Chair Powell could trigger a sharp bullish move on USDJPY.
BOJ’s Dovish Stance: The Bank of Japan remains accommodative, showing no clear intent to hike rates. This weakens the Yen and supports mid-term upward momentum for USDJPY.
Interest Rate Differentials & Carry Trade Flows continue to drive volatility and directional bias in this pair.
🎯 TRADE SETUP SUGGESTION
If price breaks and sustains above 144.61 (EMA200): look to BUY on pullback toward 144.15–144.20, targeting 145.35 and 146.11.
If price gets rejected at 145.35: consider a short-term SELL toward 144.00 – 143.43 for a corrective leg.
⚠️ STRATEGY NOTE:
Avoid entering right at the time of the FOMC release. Wait for post-event confirmation. Prioritize strong breakouts or rejections, and manage risk carefully under volatile conditions.

GBPNZD Is Very Bullish! Long!
Here is our detailed technical review for GBPNZD.
Time Frame: 1D
Current Trend: Bullish
Sentiment: Oversold (based on 7-period RSI)
Forecast: Bullish
The market is trading around a solid horizontal structure 2.262.
The above observations make me that the market will inevitably achieve 2.298 level.
P.S
The term oversold refers to a condition where an asset has traded lower in price and has the potential for a price bounce.
Overbought refers to market scenarios where the instrument is traded considerably higher than its fair value. Overvaluation is caused by market sentiments when there is positive news.
Disclosure: I am part of Trade Nation's Influencer program and receive a monthly fee for using their TradingView charts in my analysis.
Like and subscribe and comment my ideas if you enjoy them!

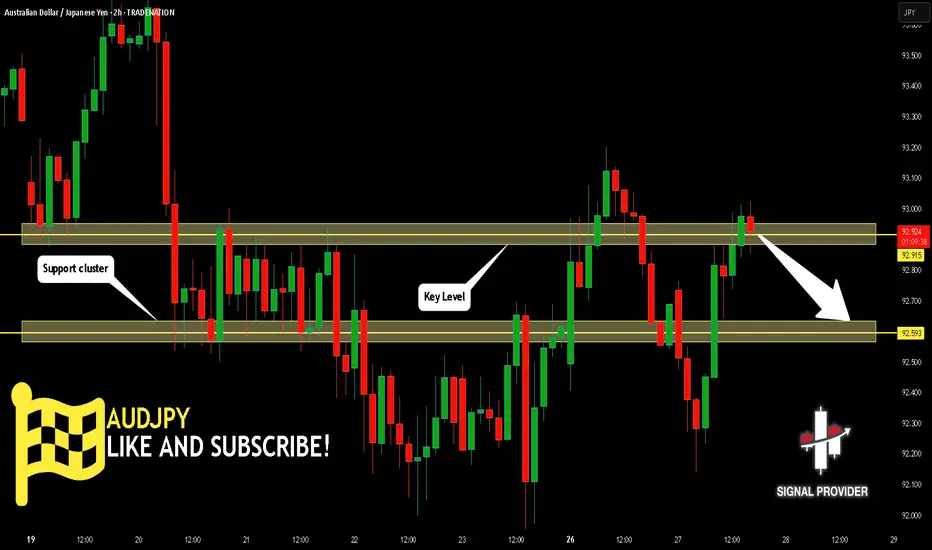
AUDJPY Will Go Lower From Resistance! Short!
Here is our detailed technical review for AUDJPY.
Time Frame: 2h
Current Trend: Bearish
Sentiment: Overbought (based on 7-period RSI)
Forecast: Bearish
The market is approaching a significant resistance area 92.915.
Due to the fact that we see a positive bearish reaction from the underlined area, I strongly believe that sellers will manage to push the price all the way down to 92.593 level.
P.S
Please, note that an oversold/overbought condition can last for a long time, and therefore being oversold/overbought doesn't mean a price rally will come soon, or at all.
Disclosure: I am part of Trade Nation's Influencer program and receive a monthly fee for using their TradingView charts in my analysis.
Like and subscribe and comment my ideas if you enjoy them!
Double Top Alert: Key Resistance at 1.3570 Before US PCE DataGBPUSD PLAN – MAY 27 | Double Top Alert: Key Resistance at 1.3570 Before US PCE Data
GBPUSD is currently testing a critical resistance zone near 1.3570, forming a potential Double Top pattern. As markets await this week’s US Core PCE inflation release, the pair may be at risk of a short-term pullback.
🌍 MACRO FUNDAMENTALS
USD Rebounds Slightly ahead of April’s PCE inflation report – a key Fed inflation gauge due this Friday.
GBP Under Pressure as dovish tones from Bank of England (BoE) officials signal a potential pause in rate hikes.
UK Political Uncertainty and sluggish EU-UK trade talks continue to dampen investor confidence in the pound.
📊 TECHNICAL ANALYSIS
Price Structure: GBPUSD surged from 1.3446 support but is now facing resistance near 1.3570, where a Double Top formation is emerging.
Key Levels:
Resistance: 1.3570 – 1.3580 (previous high and psychological barrier)
Support 1: 1.3496 (confluence of EMA89 and 38.2% Fibonacci retracement)
Support 2: 1.3446
Indicators:
EMA13, EMA34 show early signs of bearish crossover on the 30-minute chart.
RSI approaches overbought territory, hinting at potential bearish divergence.
🎯 TRADE SETUP (IF PRICE REJECTS 1.3570)
🔻 SELL SETUP
Entry: 1.3570 – 1.3550
Stop-Loss: 1.3595
Take-Profit Targets:
TP1: 1.3496
TP2: 1.3446
📌 A bullish breakout only becomes valid if price closes strongly above 1.3590 on the H1 chart.
🧠 STRATEGIC NOTES
Wait for a clear reaction or bearish confirmation near 1.3570 before entering trades.
Avoid chasing trades mid-range; focus on clean breakouts or rejections.
PCE data may trigger volatility — manage risk tightly and prepare for directional momentum.
👉 What do you think of this Double Top scenario? Will GBPUSD reject or break through resistance? Drop your analysis below and follow for daily structured plans!

SELLERS TAKE CONTROL – BUYERS WAITING BELOW 3300? XAUUSD TRADING PLAN – 27/05 | SELLERS TAKE CONTROL – BUYERS WAITING BELOW 3300?
Gold has sharply reversed after failing to break through the key 3364 – 3366 resistance zone. Price action now suggests a corrective structure is in play, potentially setting the stage for further downside before NFP week.
🌍 MACRO & FUNDAMENTAL CONTEXT
The Federal Reserve maintains a hawkish stance with U.S. 10-year yields holding above 4.5%, placing short-term pressure on safe-haven assets like gold.
U.S.–EU Trade Tensions have temporarily eased after Trump postponed 50% tariffs on EU goods until July 9. However, this pause may be short-lived, keeping geopolitical risk priced into gold.
Key data this week will influence market sentiment:
• U.S. Core PCE (April) – critical for inflation outlook
• EU HICP (May) – will shape ECB rate cut expectations for June
Gold remains caught between macro-driven demand and technical exhaustion — creating opportunities for range-based trading.
📉 TECHNICAL OUTLOOK (H1/H4)
Price broke below the rising trendline and is now trading under the EMA 13, 34, and 89, confirming a bearish shift in short-term momentum.
The 3284 – 3286 region aligns with a previous Fair Value Gap (FVG), EMA200 (H4), and structural support — a strong potential buy zone.
If this level fails, deeper pullback toward the 3247 – 3250 region (major FVG zone) becomes likely.
🔑 TRADE SETUP ZONES
🟢 PRIMARY BUY ZONE:
Entry: 3286 – 3284
Stop-Loss: 3280
Take-Profit: 3290 → 3294 → 3298 → 3302 → 3310 → 3320
🟢 BUY SCALP:
Entry: 3298 – 3296
Stop-Loss: 3292
Take-Profit: 3302 → 3306 → 3310 → 3314 → 3320 → 3330
🔴 SELL SCALP:
Entry: 3346 – 3348
Stop-Loss: 3350
Take-Profit: 3342 → 3338 → 3334 → 3330 → 3320 → 3310
🔴 STRONG SELL ZONE:
Entry: 3364 – 3366
Stop-Loss: 3370
Take-Profit: 3360 → 3356 → 3352 → 3348 → 3344 → 3340 → 3330
⚠️ STRATEGIC INSIGHTS
Selling on retracements below 3348 is favorable unless a strong breakout above 3366 occurs.
Buying is only valid near 3284 with confirmation of bullish structure (EMA support bounce or bullish engulfing pattern).
Avoid trading the mid-range between 3310–3330 unless a clear reversal setup forms — price action here remains noisy and indecisive.

EUR/NZD Short and CAD/JPY ShortEUR/NZD Short
Minimum entry requirements:
• If tight non-structured 5 min continuation forms, reduced risk entry on the break of it.
• If tight structured 5 min continuation forms, reduced risk entry on the break of it or 5 min risk entry within it.
• If tight non-structured 15 min continuation forms, 5 min risk entry within it if the continuation is structured on the 5 min chart or reduced risk entry on the break of it.
• If tight structured 15 min continuation forms, reduced risk entry on the break of it or 15 min risk entry within it.
CAD/JPY Short
Minimum entry requirements:
• Tap into area of value.
• 1H impulse down below area of value.
• If tight non-structured 5 min continuation follows, reduced risk entry on the break of it.
• If tight structured 5 min continuation follows, reduced risk entry on the break of it or 5 min risk entry within it.
• If tight non-structured 15 min continuation follows, 5 min risk entry within it if the continuation is structured on the 5 min chart or reduced risk entry on the break of it.
• If tight structured 15 min continuation follows, reduced risk entry on the break of it or 15 min risk entry within it.

USDJPY – Diverging Policies Drive Yen into Pressure Zone near 14USDJPY – Diverging Policies Drive Yen into Pressure Zone near 144
🌍 Macro Landscape: JPY Stuck Between Two Diverging Forces
In recent weeks, the US dollar has regained strength as the Federal Reserve remains committed to its "higher-for-longer" interest rate stance. On the flip side, the Bank of Japan (BoJ) is maintaining an ultra-loose monetary policy, widening the yield spread between the USD and JPY, and putting pressure on the yen.
The surge in US 10-year yields toward 4.5% is further dampening demand for JPY as a safe haven, prompting institutional capital outflows from the yen and inflows into USD-based assets.
🏦 Central Bank Policy Divergence: Fed Remains Firm, BoJ Stays Dovish
Federal Reserve: FOMC members continue to signal patience on rate cuts. Recent inflation data (PCE, CPI) shows sticky price pressure, especially in services.
Bank of Japan: BoJ remains hesitant to normalize policy despite inflation consistently above the 2% target.
This policy divergence is reminiscent of the conditions that pushed USDJPY above 151 last year — and current dynamics hint that history may repeat.
🌐 Capital Flows: JPY Loses Safe-Haven Appeal
Global capital flow models indicate a major shift. While gold and the US dollar are once again sought-after hedges amid US-China tensions and EU fiscal risk, the Japanese yen is being overlooked.
Japan’s debt-to-GDP ratio — the highest in the G7 — forces BoJ to maintain low rates to keep the fiscal structure sustainable. As a result, JPY is no longer viewed as a reliable store of safety.
📊 Technical Structure: Momentum Building Toward 144.1
On the H1 chart:
Price bounced sharply from the 142.33 demand zone, forming a higher low.
EMA 13 – 34 – 89 show a bullish alignment ("fan-out formation") confirming short-term bullish momentum.
Resistance near 144.13–144.20 is key: a clean breakout could trigger an extended rally to 145.00+
However, this zone may also trigger profit-taking, especially if traders react to upcoming macro data.
🎯 Trade Strategy Recommendations
Scenario 1 – Buy the Pullback (Preferred):
Entry: 142.70 – 142.90
Stop-Loss: 142.30
Take-Profit: 143.80 → 144.13 → 144.60
Scenario 2 – Breakout Momentum Buy:
Entry: 144.15
Stop-Loss: 143.70
Take-Profit: 145.00 → 145.50
⚠️ Key Events to Watch:
US PCE Price Index (April): If hotter-than-expected, this would reinforce the Fed’s hawkish tone and lift USD.
BoJ Governor Speech (end of week): Any unexpected hawkish shift could trigger a short-term rebound in JPY.

Pullback or Deeper Reversal After False Breakout Near 1.1425? EUR/USD Weekly Plan: Pullback or Deeper Reversal After False Breakout Near 1.1425?
🧭 MARKET OVERVIEW
EUR/USD surged toward a new monthly high at 1.1425 earlier this week but quickly lost momentum and retraced to the 1.137x zone as the US Dollar bounced back. While the short-term recovery in DXY supported the dip, macro uncertainty surrounding Trump’s erratic trade policies continues to raise questions about the dollar’s long-term credibility.
Meanwhile, Germany’s revised Q1 GDP growth of 0.4% (vs. 0.2% prior) helped support EUR, reinforcing its appeal as a safe alternative to the greenback.
📊 TECHNICAL ANALYSIS (H1 Chart)
Main Trend: Short-term correction after strong bullish rally
Resistance Levels:
1.14165 → Previous top, strong reversal zone
1.14017 → Minor supply zone
Support Levels:
1.13476 → Key break structure zone
1.12791 → Daily demand zone & previous FVG bottom
Indicators:
EMA 20 & EMA 50 crossover signals weakening bullish momentum
Price Pattern: Potential double top forming below 1.1425
🌐 MACRO & FUNDAMENTAL CONTEXT
Trump’s tariff threat postponed to July 9, but his unpredictable tone weakens USD trust.
Germany Q1 GDP upgraded to 0.4% → boosts confidence in Eurozone’s economic resilience.
ECB expected to cut rates in June, with policymakers showing confidence inflation will reach 2% target this year.
This week’s key focus:
→ US PCE Price Index (April)
→ EU May HICP (CPI)
These will drive short-term volatility and determine breakout/reversal confirmation.
✅ TRADE SETUPS
🔴 SELL ZONE:
Entry: 1.1400–1.1416
SL: 1.1440
TP: 1.1382 → 1.1347 → 1.1279
🟢 BUY SCALP ZONE:
Entry: 1.1345–1.1347
SL: 1.1320
TP: 1.1382 → 1.1400
📌 Preferred scenario: Look for bearish confirmation around 1.1400–1.1416 to enter short. Avoid aggressive buys unless price strongly holds above 1.1384.
🧩 CONCLUSION
EUR/USD is showing signs of exhaustion after testing 1.1425. If bears reclaim 1.1384 and hold below 1.1347, deeper correction toward 1.1279 is likely. Conversely, if bulls defend 1.1345 and CPI/PCE data disappoints, price may retest highs.

Will It Break Through 3366 or Reversal Ahead of NFP Week? XAU/USD PLAN – 26/05 | Gold at Crossroads: Will It Break Through 3366 or Reversal Ahead of NFP Week?
Gold is currently testing a key resistance zone following a sharp rebound last week. With the Fed maintaining its hawkish stance and US-EU trade tensions on hold, the market is in a wait-and-see mode, creating an ideal environment for structured trades.
🌍 MACRO CONTEXT:
Trump Delays 50% Tariffs on the EU Until July 9: This temporarily reduced market tension, but the long-term risks remain.
US 10-Year Yields Surge Above 4.55%: Bond markets are still pricing in tighter financial conditions, supporting the USD.
The Fed Faces Operational Pressure: The Fed continues to trim its workforce by 10%, signaling internal challenges as rate hikes push up reserve interest payments.
➡️ Investors should brace for high volatility ahead of NFP week, closely monitoring any central bank statements and reactions.
🔍 TECHNICAL OUTLOOK – H1/H4 VIEW:
Gold is consolidating near the 3360-3366 region, which is a critical sell zone where price has faced resistance. The chart reveals a rising channel and clear Fair Value Gaps (FVGs) both above and below the current price, hinting at significant volatility and liquidity sweeps in the near term.
🔑 KEY LEVELS TO WATCH:
🔺 Resistance Zones:
3364 – 3366: Local top and key reversal zone, a critical point to watch for potential rejection.
3406 – 3408: The upper bound of the FVG zone, with a potential blow-off target if a breakout occurs.
🔻 Support Zones:
3324 – 3326: 20 EMA retest, a possible bullish bounce if price holds here.
3310 – 3308: Trendline + EMA89 confluence, a strong support area.
3304: A break below this level would invalidate the short-term bullish outlook.
🎯 TRADE SETUPS:
🟢 BUY SCALP:
Entry: 3326 – 3324
Stop-Loss: 3320
Take-Profit: 3330 → 3334 → 3338 → 3342 → 3346 → 3350
🟢 BUY ZONE:
Entry: 3310 – 3308
Stop-Loss: 3304
Take-Profit: 3314 → 3318 → 3322 → 3326 → 3330 → 3340
🔴 SELL SCALP:
Entry: 3364 – 3366
Stop-Loss: 3370
Take-Profit: 3360 → 3356 → 3352 → 3348 → 3344 → 3340
🔴 SELL ZONE:
Entry: 3406 – 3408
Stop-Loss: 3412
Take-Profit: 3400 → 3396 → 3392 → 3388 → 3385 → 3380
⚠️ STRATEGY RECOMMENDATION:
If price breaks above 3366 with momentum, expect a run to 3408 and potentially 3450.
If price rejects 3366 or fails to hold above 3320, look for short positions with tight stops.
📌 Final Note:
Avoid chasing price in the middle of the range. Wait for a clear rejection or breakout confirmation to enter.

USDJPY Will Go Lower From Resistance! Sell!
Please, check our technical outlook for USDJPY.
Time Frame: 12h
Current Trend: Bearish
Sentiment: Overbought (based on 7-period RSI)
Forecast: Bearish
The market is testing a major horizontal structure 145.469.
Taking into consideration the structure & trend analysis, I believe that the market will reach 142.516 level soon.
P.S
The term oversold refers to a condition where an asset has traded lower in price and has the potential for a price bounce.
Overbought refers to market scenarios where the instrument is traded considerably higher than its fair value. Overvaluation is caused by market sentiments when there is positive news.
Disclosure: I am part of Trade Nation's Influencer program and receive a monthly fee for using their TradingView charts in my analysis.
Like and subscribe and comment my ideas if you enjoy them!

EUR/AUD Short, CAD/JPY Short and GBP/AUD LongEUR/AUD Short
Minimum entry requirements:
• If structured 1H continuation forms, 1H risk entry within it.
CAD/JPY Short
Minimum entry requirements:
• Break above area of value.
• 1H impulse down below area of interest.
• If tight non-structured 15 min continuation follows, 5 min risk entry within it if the continuation is structured on the 5 min chart or reduced risk entry on the break of it.
• If tight structured 15 min continuation follows, reduced risk entry on the break of it or 15 min risk entry within it.
GBP/AUD Long
Minimum entry requirements:
• Break below area of value.
• 1H impulse up above area of value.
• If tight non-structured 5 min continuation follows, reduced risk entry on the break of it.
• If tight structured 5 min continuation follows, reduced risk entry on the break of it or 5 min risk entry within it.
• If tight non-structured 15 min continuation follows, 5 min risk entry within it if the continuation is structured on the 5 min chart or reduced risk entry on the break of it.
• If tight structured 15 min continuation follows, reduced risk entry on the break of it or 15 min risk entry within it.
EUR/USD Short
Minimum entry requirements:
• 1H impulse down below area of value.
• If tight non-structured 5 min continuation follows, reduced risk entry on the break of it.
• If tight structured 5 min continuation follows, reduced risk entry on the break of it or 5 min risk entry within it.
• If tight non-structured 15 min continuation follows, 5 min risk entry within it if the continuation is structured on the 5 min chart or reduced risk entry on the break of it.
• If tight structured 15 min continuation follows, reduced risk entry on the break of it or 15 min risk entry within it.

EURNZD Will Fall! Short!
Take a look at our analysis for EURNZD.
Time Frame: 8h
Current Trend: Bearish
Sentiment: Overbought (based on 7-period RSI)
Forecast: Bearish
The market is on a crucial zone of supply 1.899.
The above-mentioned technicals clearly indicate the dominance of sellers on the market. I recommend shorting the instrument, aiming at 1.880 level.
P.S
Overbought describes a period of time where there has been a significant and consistent upward move in price over a period of time without much pullback.
Disclosure: I am part of Trade Nation's Influencer program and receive a monthly fee for using their TradingView charts in my analysis.
Like and subscribe and comment my ideas if you enjoy them!

XAU/USD Outlook: Will Gold Open with a Bullish Gap?XAU/USD Outlook: Will Gold Open with a Bullish Gap?
Date Range: 26th – 30th May 2025
Timeframe: H4 (4-hour chart)
Market Bias: Short-term bullish
🔍 Fundamental Analysis
US–China Trade Tensions:
China halting imports of US goods puts pressure on the dollar (gold tends to move inversely).
Escalating tensions support gold as a safe-haven asset.
Tariff Threats to the EU:
Trump proposes 50% tariffs on EU products → potential retaliatory measures raise global uncertainty.
Risk-averse sentiment may push capital into gold.
Physical Gold Demand:
High seasonal demand from India and China ahead of festivals.
Inflation fears globally increase gold's appeal.
🌍 Macro Overview
Monetary Policy:
The Fed may face pressure to cut rates if trade tensions weaken the economy → bearish for USD, bullish for gold.
PBOC could devalue the yuan in response to trade friction, boosting gold prices in USD terms.
Market Sentiment:
A potential rise in the VIX (fear index) may drive investors towards safe havens like gold.
Strong demand for physical gold and ETFs, particularly in Asia, continues to support price.
Key Events This Week:
US Core PCE (inflation indicator)
US Consumer Confidence
EU and China responses to recent US trade policy
📊 Technical Analysis (H4)
Trend: Clear ascending channel
Current Price: 3,407.554
Key Resistance Levels:
3,407 – 3,444 (major resistance zone)
3,444.436 = potential all-time high
Support Zones:
3,361.648 (channel midpoint)
3,325.347 (lower channel boundary)
Fair Value Gaps (FVG):
FVG 1: 3,361 – 3,407
FVG 2: 3,325 – 3,340
Price Action Note:
A doji candle near resistance suggests a possible short-term pullback before continuation
🔄 Possible Scenarios
🔼 Bullish Scenario (60% probability):
Break above 3,444 with momentum could trigger a bullish gap and extend toward 3,500
Strong fundamental and technical support for upside
🔽 Bearish Scenario:
Rejection from 3,444 may lead to a pullback toward 3,361 or even 3,325 for buy setups
💡 Trade Plan
✅ Long Setup:
Entry: 3,361 – 3,370 (pullback into FVG or mid-channel support)
Take Profit: 3,444 (TP1), 3,500 (TP2)
Stop Loss: Below 3,325
❌ Short Setup (only on confirmed rejection):
Entry: On clear rejection at 3,444 (e.g. bearish engulfing or head & shoulders pattern)
Take Profit: 3,361
Stop Loss: Above 3,444
⏰ Optimal Trading Times
Monitor market open (Sunday, 26th May) for confirmation of a potential bullish gap
Best liquidity during London and New York sessions
📝 Summary:
Gold is well-positioned for a bullish move amid escalating trade tensions and USD weakness.
Watch closely for a breakout above 3,444 or a retracement to 3,361 as a strategic buy zone.
Stay updated on US inflation data and trade policy developments to adjust accordingly.

IS THE BULLISH CHANNEL NEARING EXHAUSTION OR JUST GEARING UP?GBPUSD OUTLOOK – IS THE BULLISH CHANNEL NEARING EXHAUSTION OR JUST GEARING UP?
📊 Macro Overview:
The USD continues to soften slightly as markets begin pricing in a potential rate cut by the Fed later in Q3. Meanwhile, the British Pound (GBP) is holding firm, supported by stronger-than-expected UK macroeconomic data—particularly retail sales and inflation figures.
However, UK fiscal concerns remain a headwind, and GBPUSD is highly sensitive to upcoming U.S. data—especially Core PCE and employment figures this week.
📉 Technical Analysis:
On the 1H chart, GBPUSD is moving within a broad ascending channel and is now approaching the upper resistance trendline at 1.3555 – a key zone that could trigger short-term profit-taking.
EMAs 13 and 34 are still in bullish alignment, supporting ongoing momentum.
Despite the bullish setup, current candle structure suggests a potential pullback to the 1.3448 support zone before a continuation higher—if buyers regain control.
🔑 Key Price Levels:
Resistance Zones:
🔸 1.3555 – Channel top resistance
🔸 1.3586 – Extended resistance zone
Support Zones:
🔹 1.3448 – Technical and Fibo confluence
🔹 1.3398 – Major structure support in case of breakdown
🛠️ Trade Scenarios:
✅ Scenario 1: BUY on retracement
Entry: 1.3448 (watch for bullish confirmation on H1)
Stop Loss: 1.3394
Take Profit: 1.3500 → 1.3555 → 1.3585
✅ Scenario 2: SELL scalp from resistance
Entry: 1.3555
Stop Loss: 1.3588
Take Profit: 1.3500 → 1.3460
🧠 Final Thoughts:
GBPUSD remains bullish in structure but is testing key resistance levels. A clean pullback to the 1.3448 region may provide a strong buying opportunity if confirmed by price action. If this level breaks, bearish divergence could kick in and push the pair back to deeper support zones. Stay alert for high-impact economic releases and trade with solid risk management!

GOLD XAUUSD PLAN – MAY 23 IS GOLD READY TO SURGE AGAIN?GOLD XAUUSD PLAN – MAY 23 | GEOPOLITICAL RISKS FLARE UP – IS GOLD READY TO SURGE AGAIN?
🌍 MACRO CONTEXT:
Iran-Israel-US Tension: Iran has warned that if Israel attacks its nuclear facilities, the U.S. will also be held responsible. Tehran vows to take “special measures” to protect its nuclear program, and has filed formal complaints with the UN. Markets are reacting sharply to this growing geopolitical risk.
Goldman Sachs Alert: Goldman Sachs recommends gold and crypto (Bitcoin) as safe-haven assets amidst soaring bond yields, fiscal crisis fears, and a failed 20-year U.S. Treasury auction. They warn that rising yields are now posing serious threats to equities while the dollar faces longer-term pressure.
📉 TECHNICAL OUTLOOK (M30):
Price has bounced off the 3303 zone, and is showing signs of a bullish breakout if 3360 is taken out.
There is a clear Fair Value Gap (FVG) above 3360–3380, which has yet to be fully filled. Below, the untested FVG zone near 3274–3250 remains vulnerable if support fails.
EMA 13 is trending above EMA 34 and EMA 200 → bullish bias remains valid as long as 3274 holds.
🔑 KEY LEVELS TO WATCH:
SELL Side Key Level: 3358–3360 → A breakout above this zone could lead to a retest of ATH near 3400–3450.
BUY Side Key Level: 3276–3274 → Losing this zone could push gold back below 3200, targeting deeper correction levels.
📈 TRADE SETUPS:
🔵 BUY ZONE: 3276 – 3274
SL: 3270
TPs: 3280 → 3284 → 3288 → 3292 → 3296 → 3300
🔵 BUY SCALP: 3304 – 3302
SL: 3298
TPs: 3308 → 3312 → 3316 → 3320 → 3325 → 3330 → 3340
🔴 SELL ZONE: 3376 – 3378
SL: 3382
TPs: 3372 → 3368 → 3364 → 3360 → 3350
🔴 SELL SCALP: 3344 – 3346
SL: 3350
TPs: 3340 → 3336 → 3332 → 3328 → 3324 → 3320
🧠 FINAL THOUGHTS:
Gold remains highly sensitive to geopolitical headlines and macro instability. As long as the 3303 support area holds, look for bullish continuation towards FVG highs. Break below 3274 may shift the bias sharply to the downside. Stay alert — volatility is expected to rise ahead of the next U.S. data and developments in the Iran nuclear issue.GOLD XAUUSD PLAN – MAY 23 | GEOPOLITICAL RISKS FLARE UP – IS GOLD READY TO SURGE AGAIN?
🌍 MACRO CONTEXT:
Iran-Israel-US Tension: Iran has warned that if Israel attacks its nuclear facilities, the U.S. will also be held responsible. Tehran vows to take “special measures” to protect its nuclear program, and has filed formal complaints with the UN. Markets are reacting sharply to this growing geopolitical risk.
Goldman Sachs Alert: Goldman Sachs recommends gold and crypto (Bitcoin) as safe-haven assets amidst soaring bond yields, fiscal crisis fears, and a failed 20-year U.S. Treasury auction. They warn that rising yields are now posing serious threats to equities while the dollar faces longer-term pressure.
📉 TECHNICAL OUTLOOK (M30):
Price has bounced off the 3303 zone, and is showing signs of a bullish breakout if 3360 is taken out.
There is a clear Fair Value Gap (FVG) above 3360–3380, which has yet to be fully filled. Below, the untested FVG zone near 3274–3250 remains vulnerable if support fails.
EMA 13 is trending above EMA 34 and EMA 200 → bullish bias remains valid as long as 3274 holds.
🔑 KEY LEVELS TO WATCH:
SELL Side Key Level: 3358–3360 → A breakout above this zone could lead to a retest of ATH near 3400–3450.
BUY Side Key Level: 3276–3274 → Losing this zone could push gold back below 3200, targeting deeper correction levels.
📈 TRADE SETUPS:
🔵 BUY ZONE: 3276 – 3274
SL: 3270
TPs: 3280 → 3284 → 3288 → 3292 → 3296 → 3300
🔵 BUY SCALP: 3304 – 3302
SL: 3298
TPs: 3308 → 3312 → 3316 → 3320 → 3325 → 3330 → 3340
🔴 SELL ZONE: 3376 – 3378
SL: 3382
TPs: 3372 → 3368 → 3364 → 3360 → 3350
🔴 SELL SCALP: 3344 – 3346
SL: 3350
TPs: 3340 → 3336 → 3332 → 3328 → 3324 → 3320
🧠 FINAL THOUGHTS:
Gold remains highly sensitive to geopolitical headlines and macro instability. As long as the 3303 support area holds, look for bullish continuation towards FVG highs. Break below 3274 may shift the bias sharply to the downside. Stay alert — volatility is expected to rise ahead of the next U.S. data and developments in the Iran nuclear issue.

GBP/JPY (Trade Recap) and EUR/JPY ShortEUR/JPY Short
Minimum entry requirements:
• If structured 1H continuation forms, 1H risk entry within it.

USDCAD RETEST OR FRESH DOWNTREND? PRICE AT A CRUCIAL CROSSROAD!USDCAD 22/05 – KEY RETEST OR FRESH DOWNTREND? PRICE AT A CRUCIAL CROSSROAD!
🌐 MACRO BACKDROP:
Canada’s CPI and Retail Sales have come in weaker than expected, signaling sluggish consumer demand and reducing the probability of near-term rate hikes by the Bank of Canada.
Meanwhile, the USD is stabilizing, supported by steady U.S. Treasury yields after the Fed reaffirmed its “higher for longer” stance.
Oil prices, a major driver of the Canadian Dollar, have shown no significant breakout, further weakening CAD’s bullish momentum.
🔍 TECHNICAL OVERVIEW (H1–H4 Chart):
After hitting a key swing low at 1.3820, USDCAD is now retracing towards the 0.5 Fibonacci zone (1.3889 – 1.3913), which also aligns with:
The 200 EMA resistance (red line)
Previous structure rejection zone
➡️ This area is critical – it could act as a trap zone before price resumes downward or breaks to confirm a short-term bullish reversal.
📈 TRADE SETUPS:
🔻 SELL SETUP (HIGH PROBABILITY IF PRICE FAILS AT RESISTANCE):
Entry: 1.3900 – 1.3913
Stop Loss: 1.3930
Take Profit Targets: 1.3884 → 1.3859 → 1.3847 → 1.3820
🔹 BUY SETUP (IF PRICE HOLDS ABOVE THE BASE ZONE):
Entry: 1.3820 – 1.3823
Stop Loss: 1.3805
Take Profit Targets: 1.3847 → 1.3880 → 1.3913
⚠️ STRATEGY NOTES:
Be cautious during the New York session, as potential comments from Fed officials or crude oil updates could spike volatility.
This is a textbook case of “reaction vs. continuation” at a Fibo cluster – stick to confirmed candlestick signals to avoid false breakouts.
📌 FINAL THOUGHTS:
USDCAD is in a corrective rally after an extended decline. The 1.3913 zone is a key decision point. Sellers should watch for signs of exhaustion, while buyers can target short-term retracements if support holds at 1.3820.

STRUCTURE SHIFT OR FALSE BREAKOUT? MAJOR MOVE LOADING? EURUSD 22/05 – STRUCTURE SHIFT OR FALSE BREAKOUT? MAJOR MOVE LOADING?
🌐 MACRO OUTLOOK
The market remains caught between dovish expectations and hawkish reality. While recent US CPI and PPI came in weaker than expected, Fed officials have refrained from confirming any imminent rate cuts, keeping the dollar resilient in the medium term.
Meanwhile, the ECB’s cautious stance and ongoing inflation risks across the eurozone continue to cap euro strength. The divergence in tone between the Fed and the ECB adds to the short-term volatility and uncertainty around EURUSD’s direction.
📉 TECHNICAL ANALYSIS (H1 + H4 Timeframe)
EURUSD has faked a breakout above the 1.1310–1.1320 resistance zone and is now pulling back to the key structure support around 1.1279 — a critical short-term level.
📌 Key Observations:
Bearish engulfing candle formed on H1 after price rejected the upper zone → potential reversal signal.
EMA 13 is crossing below EMA 34 → suggesting short-term downside pressure.
A confirmed H1 close below 1.1279 opens room for deeper retracement towards 1.1234 (previous demand/FVG area).
If momentum builds, we could see a broader correction toward 1.1148 in the coming days.
⚙️ TRADE STRATEGY FOR TODAY
🔻 PRIMARY SCENARIO – SELL THE RALLY
Entry Zone: 1.1315 – 1.1318 (near FVG + fake breakout zone)
Stop Loss: 1.1360
Take Profit Targets:
→ TP1: 1.1279
→ TP2: 1.1234
→ TP3: 1.1148
🔹 ALTERNATE SCENARIO – BUY SCALP ON STRONG REACTION
Buy Entry: 1.1234 – 1.1230 (only with bullish M15 confirmation)
Stop Loss: 1.1210
Take Profit: 1.1279 → 1.1300
🧠 STRATEGIC INSIGHT
A D1 candle close below 1.1234 will confirm a structure break and likely initiate a deeper downward trend.
On the flip side, if 1.1234 holds and US jobless claims disappoint later today, EURUSD may recover back to test 1.131x.
Market sentiment is highly reactive — stay flexible and prioritize price action confirmation.
📌 FINAL THOUGHTS:
EURUSD is at a pivotal point — either confirming a new downtrend or bouncing back within the current range. This is a trader’s market: clear key levels, disciplined risk management, and adaptive execution are essential.
📈 Follow for real-time chart updates, FVG mapping, and more daily trading setups.
Stay smart, stay sharp. Risk management first.

FVG LIQUIDITY & POLITICAL SHOCKS: WILL THE SELLERS STRIKE BACK?GOLD PLAN 22/05 – FVG LIQUIDITY & POLITICAL SHOCKS: WILL THE SELLERS STRIKE BACK?
🌍 Fundamental & Geopolitical Overview:
🔺 Breaking Political News:
On the night of May 21, two Israeli embassy officials were fatally shot near the Jewish Museum in Washington in what’s being labeled an anti-Semitic terrorist act.
→ Former President Trump condemned the attack, calling it “disgusting” and demanding an end to extremism.
→ Events like these typically boost gold as a safe haven, but this time the market appears hesitant.
🔺 Meanwhile, the Federal Reserve remains hawkish, signaling “higher-for-longer” interest rates.
→ This continues to support USD strength, putting downward pressure on gold.
🔍 Technical Outlook (H1):
Gold (XAUUSD) recently topped around 3397, followed by a strong bearish rejection candle at that level.
Two Fair Value Gaps (FVG) are now defining market sentiment:
Upper FVG: 3330 – 3356 (partially filled)
Lower FVG: 3277 – 3247 → highly likely to be targeted if breakdown occurs.
EMA 13 & EMA 34 are flattening out, indicating consolidation within a breakout range.
🧭 Trade Strategy for Today:
🔻 PRIMARY SELL ZONE:
Entry: 3395 – 3397
Stop Loss: 3401
Take Profit: 3390 → 3386 → 3380 → 3376 → 3370
🔻 SELL SCALP:
Entry: 3358 – 3360
Stop Loss: 3364
Take Profit: 3354 → 3350 → 3346 → 3342 → 3338 → 3330
🔵 BUY ZONE:
Entry: 3296 – 3294
Stop Loss: 3290
Take Profit: 3300 → 3304 → 3308 → 3315 → 3320 → 3330 → ???
🔵 BUY SCALP:
Entry: 3316 – 3314
Stop Loss: 3310
Take Profit: 3320 → 3324 → 3328 → 3332 → 3340 → 3350
⚠️ Key Things to Watch:
FBI and White House responses to the DC shooting could ignite renewed risk-off sentiment, pushing gold higher suddenly.
A break above 3400 invalidates today’s setup – expect renewed bullish pressure if that happens.
📌 Pro Tip: Don’t chase the market. Let price come to your zones. Respect SL/TP and manage risk – especially on volatile days like today.
📣 Follow this account for live updates, scalping levels, and macro-triggered trading zones in real time!
