USDJPY TRADE PLAN – MAY 21 BIG BREAKOUT AHEAD?USDJPY TRADE PLAN – MAY 21 | FED HAWKISH BUT YEN STAYS WEAK – BIG BREAKOUT AHEAD?
USDJPY is entering a critical technical zone as the market weighs the Fed’s persistent hawkish stance against Japan’s passive approach to the Yen’s depreciation. After a strong rally, we are seeing a potential exhaustion with key levels in play.
🌍 MACRO CONTEXT:
FED remains hawkish: Officials continue to support higher-for-longer interest rates to tame inflation → USD remains firm.
Bank of Japan silence: No signs of FX intervention or rate policy shift, causing ongoing weakness in JPY.
Risk sentiment neutral: Risk-off flows are muted; USDJPY remains trapped in a wide range – awaiting macro catalysts.
📊 TECHNICAL OUTLOOK (H2 CHART):
Price is now correcting within a falling channel.
Price broke below the MA200 and rising trendline, now retesting a key support zone at 143.77.
The current range 141.99 – 144.71 is critical – a breakout from either end may dictate the next medium-term direction.
🎯 TRADE SETUPS FOR TODAY:
✅ SCENARIO A – SELL THE RALLY (PRIMARY BIAS):
If price rejects 144.71:
SELL ZONE: 144.70 – 144.71
SL: 145.10
TP: 143.77 → 143.30 → 142.50 → 141.99
→ Key resistance area – price may trigger strong seller interest.
✅ SCENARIO B – SELL ON BREAKDOWN:
If price breaks 143.77 and retests:
SELL ZONE: 143.60 – 143.70 (post-breakdown entry)
SL: 144.10
TP: 142.50 → 142.00 → 141.99
✅ SCENARIO C – SHORT-TERM BUY (LESS FAVORABLE):
If price reacts positively at 141.99 with bullish confirmation:
BUY ZONE: 141.90 – 141.99
SL: 141.50
TP: 142.50 → 143.00 → 143.77
→ Only take this setup if strong reversal signals appear.
🔑 KEY LEVELS TO WATCH:
Resistance: 144.71 – 145.00 – 148.44
Support: 143.77 – 143.30 – 141.99 – 141.20
📌 FINAL THOUGHTS:
USDJPY remains in a volatile consolidation zone, pressured by a hawkish Fed but lacking JPY strength. Watch for PMI data and Fed comments this week for directional cues. Until then, respect the current range and trade with discipline.
📣 Bias favors SELL from 144.71 unless buyers reclaim full control – trade the reaction, not the prediction!
Trading-forex

NZD/USD TRADING PLAN – MAY 21 | RETEST OR CONTINUATION?NZD/USD TRADING PLAN – MAY 21 | RETEST OR CONTINUATION? 🔍
After several steady bullish sessions, NZD/USD is pulling back slightly from the 0.5961 resistance zone. The pair remains within a well-defined ascending channel on the H1 chart and is approaching a key support area around 0.5910 — a zone that could trigger a technical bounce and continuation of the current bullish trend.
🌍 MACRO CONTEXT:
The US Dollar Index (DXY) is showing signs of weakness following disappointing CPI and PPI data. This opens up room for commodity currencies like NZD to recover further.
Meanwhile, New Zealand's domestic consumption data has exceeded expectations, and the RBNZ continues to maintain a stable policy outlook — a medium-term bullish sign for NZD.
Market sentiment is leaning cautiously against the USD, especially as the Fed holds its “no cut but no hike” stance — boosting interest in alternative currencies.
📊 TECHNICAL OUTLOOK (H1):
NZD/USD is trading within an ascending price channel.
EMA 13 is above EMA 34 and EMA 200 — a positive short-term trend signal.
Two important zones to watch today are 0.5910 (key support) and 0.5961 (key resistance).
🎯 TRADE SETUPS FOR TODAY:
✅ SCENARIO A – BUY THE RETEST:
If price tests the 0.5910 zone and shows strong reaction:
BUY ZONE: 0.5910 – 0.5915
SL: 0.5890
TP: 0.5960 → 0.5980 → 0.6000 → 0.6006
→ This zone aligns with ascending channel support + prior FVG → strong rebound probability.
✅ SCENARIO B – BREAKOUT & CONTINUATION:
If price breaks and holds above 0.5961:
BUY SCALP: 0.5965 – 0.5970
SL: 0.5950
TP: 0.5980 → 0.6000 → 0.6006
❌ SCENARIO C – BEARISH BREAKDOWN:
If price fails to hold above 0.5910 and closes H1 candle below it:
SELL SCALP: 0.5900 – 0.5895
SL: 0.5915
TP: 0.5870 → 0.5850 → 0.5820
📌 FINAL THOUGHTS:
NZD/USD is at a critical decision point — this could be a retest before continuation to 0.6000 or the beginning of a deeper drop.
Watch the 0.5910 level closely to determine market direction.
⚠️ Risk management is key — high volatility expected as U.S. PMI data is set for release during today’s NY session.
🧠 Be patient. Let price come to your zone. React, don’t predict.

GBP/USD Retracement or Reversal? Stay Sharp as Momentum FadesGBP/USD Trading Plan – May 20th | Retracement or Reversal? Stay Sharp as Momentum Fades
🌐 Macro Overview
GBP/USD is currently influenced by several macroeconomic forces:
USD strength is returning, supported by stable US data (Retail Sales, Jobless Claims), leading the market to delay expectations of a Fed rate cut.
The British Pound is under pressure as the Bank of England (BoE) is not expected to raise rates further amid slowing domestic growth and easing inflation.
Simultaneously, US-China trade tensions and US debt concerns are keeping market sentiment cautious. The pair is forming a bullish flag structure, but signs of exhaustion are emerging.
📉 Technical Analysis (2H Chart)
GBP/USD is moving within a rising channel. However:
1.3433 remains a strong resistance, aligning with a local top — breakout potential is limited in the short term.
A rising wedge pattern is forming — watch for a potential trap followed by a sharp sell-off.
EMA13 and EMA34 are diverging, signaling distribution and potential reversal ahead.
🔑 Key Levels to Watch
Major Resistance:
🔺 1.3433 – recent swing high and potential double top
🔺 1.3355 – mid-range resistance and EMA34 convergence (H2)
Key Support:
🔻 1.3303 – key FIBO + trendline intersection
🔻 1.3251 – medium-term bullish structure support
🔻 1.3174 – previous swing low and strategic BUY ZONE
🎯 Trading Scenarios
📍 Scenario A – False Break and Rejection from Resistance
Entry (SELL): 1.3430 – 1.3433 (after bearish confirmation)
Stop Loss: 1.3460
Take Profits: 1.3355 → 1.3303 → 1.3250
📍 Scenario B – Breakdown and Failed Retest
Entry (SELL): 1.3303 – 1.3310 (after support break and retest)
Stop Loss: 1.3340
Take Profits: 1.3251 → 1.3174
📍 Scenario C – Deep Buy from Strong Support
Entry (BUY): 1.3170 – 1.3174
Stop Loss: 1.3140
Take Profits: 1.3251 → 1.3300
⚠️ Key Reminders:
Stay cautious ahead of key US releases this week (PMI, FOMC Minutes), which may trigger high volatility.
Avoid FOMO and respect SL/TP discipline — especially near potential trap zones.
📌 Follow for intraday updates and real-time trade setups as the structure evolves. Flexibility is key in this market.

Gold Price Market in a Sideways Phase Awaiting BreakoutGold Price Drops Amid Hawkish Fed Comments - Market in a Sideways Phase Awaiting Breakout
Gold (XAU/USD) has experienced a sharp drop following recent hawkish comments from the Federal Reserve. The continuation of tight monetary policy has unsettled investors, leading to strong sell-offs during both the Asian and US trading sessions today.
📊 Technical Analysis:
Currently, gold is forming a new sideways range, and if you zoom out to higher timeframes, you'll notice a classic bearish flag pattern developing. This suggests that gold is in a period of consolidation before a potential large-scale breakout. While the upward momentum from both the Asian and European sessions was strong, gold failed to break the critical 3250–3255 zone. This area remains vital for determining the next direction in gold's price action.
Should the bearish trend continue, if we break the support trendline below the current price, the likelihood of the bearish flag pattern playing out rises to around 80%. This could lead to further price corrections.
Key Levels to Watch:
Support Levels: 3205, 3194, 3280, 3262
Resistance Levels: 3244, 3262, 3278, 3286
📈 Trading Strategy:
BUY SCALP:
Entry: 3294 - 3292
Stop Loss (SL): 3288
Take Profit (TP): 3298 → 3302 → 3306 → 3310 → 3315 → 3320 → 3330
BUY ZONE:
Entry: 3272 - 3270
SL: 3266
TP: 3276 → 3280 → 3284 → 3288 → 3292 → 3296 → 3330
SELL SCALP:
Entry: 3242 - 3244
SL: 3248
TP: 3238 → 3234 → 3230 → 3226 → 3220 → 3210
SELL SCALP:
Entry: 3276 - 3278
SL: 3282
TP: 3272 → 3268 → 3264 → 3260 → 3250 → 3240
⚠️ Risk Management:
As we approach the close of the week, the volatility in gold could intensify, especially with the Fed’s actions, market sentiment, and geopolitical developments. Always follow your TP/SL to safeguard your investments and avoid unnecessary risk.
🧠 Final Thoughts:
The market is in a consolidation phase, and it's essential to wait for confirmation before taking significant positions. If gold fails to break the 3250–3255 resistance zone, the chances of a more significant move downwards increase. However, be cautious, as the market is volatile, and things can shift rapidly.

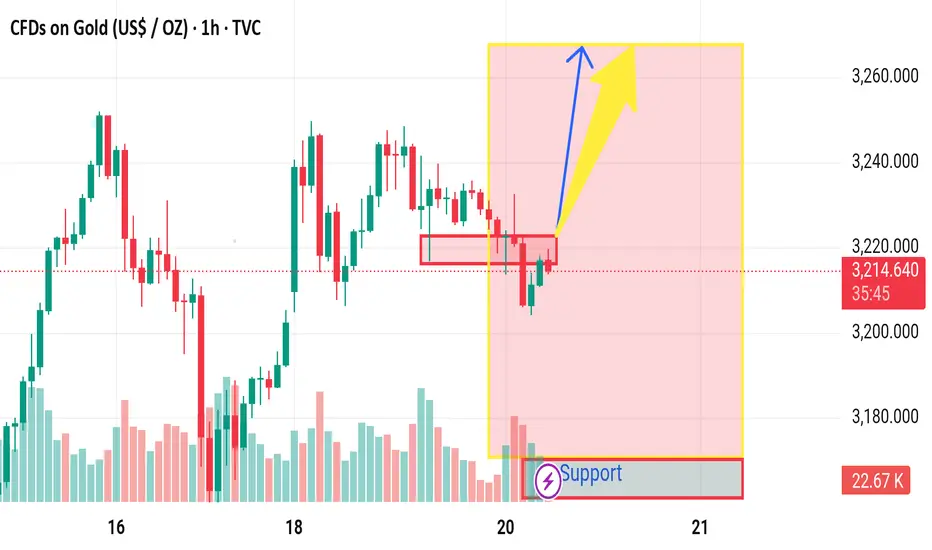
Market next move 1. Over-Reliance on Support Zone
The analysis heavily leans on the assumption that the support zone (marked with the purple "Support" label) will hold.
However, this support has already been tested multiple times, which weakens its strength.
A break below this zone could trigger significant stop-loss hunting, leading to a bearish breakdown instead of a bullish reversal.
2. Volume Analysis Suggests Weak Momentum
The recent bounce lacks strong volume. This suggests that buying interest is not convincing at this level.
Without volume confirmation, any bullish move is less likely to sustain.
3. Lower Highs Pattern
Despite small rallies, the chart is forming lower highs, which is typically a bearish signal.
This hints at seller dominance, and the yellow bullish projection might be overly optimistic.
4. Resistance Overhead
The price is approaching a short-term resistance zone (red box), which has rejected the price previously.
Without a clear breakout above that, the bullish case is speculative.
5. Fundamental Factors Unaccounted
The chart doesn’t account for macro factors like U.S. dollar strength, interest rates, or geopolitical influences that often affect gold.
If the dollar strengthens, gold may drop, breaking the support.
Market next move Bearish Disruption Analysis:
1. Range Weakness and Exhaustion Risk:
The price has been ranging within a tight zone, and repeated tests of the support line near 3,215–3,218 show weakening buyer pressure.
If bulls were strong, we might have already seen a breakout with momentum. Instead, there's sideways choppiness, suggesting indecision or exhaustion.
2. Lower Highs Forming:
Despite a flat support zone, price is forming lower highs, a bearish signal. Sellers are stepping in earlier on each bounce, tightening the range from the top.
3. Volume Depletion:
Volume is gradually dropping during this consolidation. If a breakout happens without a volume surge, it risks becoming a false breakout.
4. Liquidity Sweep Possibility:
Market makers might push price below the support zone (~3,215) to trigger stop-losses and accumulate orders before a potential real breakout. This would trap late buyers who enter early.
5. Bearish Scenario Path:
If price breaks below 3,215 and closes under that on decent volume, expect a move to the next demand zone near 3,200 or lower.
Downside target could be around 3,180–3,190, where the previous demand base formed on May 15.

EUR/USD DAILY PLAN – BREAKOUT CONFIRMATION OR FAKEOUT TRAP?EUR/USD DAILY PLAN – BREAKOUT CONFIRMATION OR FAKEOUT TRAP?
🧠 Macro Overview
This week’s trading landscape is influenced by both European and U.S. developments:
EU Side: There are no major macroeconomic releases ahead, but expectations are growing that the ECB may adopt a more dovish tone in upcoming meetings. If inflation continues to cool, the euro may face downside pressure.
U.S. Side: Last week’s CPI and PPI data showed signs of cooling inflation, yet not enough for the Fed to shift gears. The U.S. dollar remains supported by the prospect of “higher for longer” interest rates.
Global Sentiment: Ongoing U.S.–China tensions and trade policy updates in Europe are keeping risk appetite cautious. The EUR/USD pair is testing a key zone and may break out of the descending channel soon — or reject hard if buyers fail to hold.
📊 Technical Analysis (H1 Chart)
EUR/USD bounced strongly from the 1.1160 – 1.1180 demand zone and is now testing the key resistance at 1.1237 — a confluence of descending trendline and the 200 EMA on the 1H chart.
A clean breakout above and sustained hold of 1.1237 could pave the way toward higher resistance levels at 1.1270 and 1.1325.
However, if the pair gets rejected at 1.1237, it may fall back to test the lower support at 1.1160 – 1.1180, possibly forming a range before a larger move.
📌 Key Levels to Watch
🔺 Resistance Levels:
1.1237 → Key confluence zone (EMA200 + trendline)
1.1270 → Previous swing high
1.1302 – 1.1325 → Upper resistance zone with Fibo confluence
🔻 Support Levels:
1.1180 → Immediate demand area
1.1160 → Critical trendline support
A break below 1.1160 could trigger stronger bearish momentum
🎯 Trading Scenarios
1. Bullish Breakout Above 1.1237
🔹 Entry: 1.1240 – 1.1250
🔹 SL: 1.1210
🔹 TP: 1.1270 → 1.1302 → 1.1325
2. Bearish Rejection at 1.1237
🔻 Entry: 1.1230 – 1.1225
🔻 SL: 1.1255
🔻 TP: 1.1180 → 1.1160
3. Buy-the-Dip at Key Support
🔹 Entry: 1.1165 – 1.1170
🔹 SL: 1.1135
🔹 TP: 1.1200 → 1.1230
⚠️ Key Notes:
Avoid entering trades during chop between 1.1215 – 1.1237 unless breakout confirmation appears.
Be cautious of liquidity grabs during London and NY session opens.
Stick to tight risk management as market remains uncertain and range-bound.
📌 Conclusion:
EUR/USD is at a decision point. Whether bulls take control or sellers defend key resistance will determine short-term trend direction. Trade the breakout or the reaction — not the prediction.

Gold Price Surge Will This Be the Catalyst for the Next Breakout💥 Gold Price Surge: Will This Be the Catalyst for the Next Breakout? | Trading Plan for Today 📊
📊 Market Overview:
✔️ Gold (XAU/USD) has shown a strong recovery following significant geopolitical and economic developments over the weekend. Key factors driving this rally include:
✔️ Putin’s Rejection of Peace Talks: If the conflict intensifies, we may see a surge in demand for safe-haven assets like gold.
✔️ US Credit Downgrade: Rising concerns over US debt and bond yields could drive more investors back into gold.
✔️ Trump’s Tariff Threat: Although less aggressive than before, Trump’s volatility still poses risks to market stability, with gold remaining a key hedge.
✔️ These combined factors have driven a gap up of over 20 points during the early Asia session. Should these issues remain unresolved, gold could be set for a strong move back toward its previous All-Time High (ATH).
📉 Technical Analysis:
✔️ The chart is showing an increasingly bullish setup. EMA 13 has crossed above both EMA 34 and EMA 200 on the M30 chart, suggesting that the market is primed for a breakout.
✔️ We’re seeing the potential for a $100–$200 rally per ounce, should the bullish momentum persist.
✔️ Given the current market volatility, geopolitical events could cause sharp price movements. A breakout of the current trendline may indicate that we are witnessing a retest before the next significant surge.
🔑 Key Levels to Watch:
🔻 Support Levels: 3204, 3193, 3186, 3174, 3163
🔺 Resistance Levels: 3254, 3277, 3288
💰 Trading Strategy for Today:
✅ BUY Scalp: 3194 – 3196
🔴 Stop-Loss (SL): 3190
✅ Take-Profit (TP): 3200 → 3210 → 3220 → 3230
✅ BUY Zone: 3186 – 3184
🔴 Stop-Loss (SL): 3180
✅ Take-Profit (TP): 3190 → 3195 → 3200 → 3210 → 3220 → 3230
✔️ SELL Zone: 3287 – 3289
🔴 Stop-Loss (SL): 3293
✅ Take-Profit (TP): 3285 → 3280 → 3285 → 3280 → 3270
💎 Good Luck! Stay tuned for more updates, and trade wisely! 📈

GBP/JPY Short and CAD/JPY ShortGBP/JPY Short
Minimum entry requirements:
• Corrective tap into area of value.
• 4H risk entry or 1H risk entry after 2 x 1H rejection candles.
Minimum entry requirements:
• Tap into area of value.
• 1H impulse down below area of value.
• If tight non-structured 5 min continuation follows, reduced risk entry on the break of it.
• If tight structured 5 min continuation follows, reduced risk entry on the break of it or 5 min risk entry within it.
• If tight non-structured 15 min continuation follows, 5 min risk entry within it if the continuation is structured on the 5 min chart or reduced risk entry on the break of it.
• If tight structured 15 min continuation follows, reduced risk entry on the break of it or 15 min risk entry within it.
CAD/JPY Short
Minimum entry requirements:
• Corrective tap into area of value.
• 4H risk entry or 1H risk entry after 2 x 1H rejection candles.
Minimum entry requirements:
• Tap into area of value.
• 1H impulse down below area of value.
• If tight non-structured 5 min continuation follows, reduced risk entry on the break of it.
• If tight structured 5 min continuation follows, reduced risk entry on the break of it or 5 min risk entry within it.
• If tight non-structured 15 min continuation follows, 5 min risk entry within it if the continuation is structured on the 5 min chart or reduced risk entry on the break of it.
• If tight structured 15 min continuation follows, reduced risk entry on the break of it or 15 min risk entry within it.

Will the Market Continue to Sink or Rebound?Gold Price Volatility: Will the Market Continue to Sink or Rebound?
💥 Market Outlook:
Today’s market is seeing unpredictable movements, with gold making significant drops and then rebounding sharply in the last two days. Are the recent news developments aligning with the price action, or is it just a major coincidence?
🔍 Technical Analysis:
Looking at the D1 and H4 charts, you can clearly see the breakdown, but gold quickly bounced back to the 325x area and reacted. The 3254–3256 zone is a key level that holds strong for sellers on both daily and H4 candles. If gold continues to hold below this level, the bearish trend remains strong, and another sharp drop could happen before the weekend.
If the 3254–3256 level is broken, the price may push toward the 327x, possibly even the 328x levels. However, this will be dependent on whether this critical support is maintained.
Trend Continuation or Reversal?
From a technical perspective, gold is still in a downtrend, and the current bounce is likely just a retracement before continuing lower. However, in terms of macro news, the USD is continuously dealing with bad inflation data, affecting the recovery of DXY (USD). The market is very sensitive to trap candles, and there may be false breakouts, so proceed cautiously.
There are also some news reports indicating that the US and China have reached a minor détente, but tensions remain around trade restrictions, imports, exports, and the use of rare earth minerals. Things are unpredictable with these two powers. Today, there are updates on tariffs, so keep an eye out!
📊 Key Resistance Levels:
3237
3251
3261
3276
3287
📉 Key Support Levels:
3205
3188
3170
3143
🎯 Trading Plan:
🔵 BUY SCALP:
Entry: 3172 – 3170
SL: 3166
TP: 3176 → 3180 → 3184 → 3188 → 3192 → 3196 → 3200
🔵 BUY ZONE:
Entry: 3142 – 3140
SL: 3136
TP: 3146 → 3150 → 3154 → 3158 → 3162 → 3170 → 3180 → 3190
🔴 SELL SCALP:
Entry: 3160 – 3162
SL: 3166
TP: 3156 → 3152 → 3148 → 3144 → 3140 → 3130 → 3120
🔴 SELL ZONE:
Entry: 3276 – 3278
SL: 3282
TP: 3272 → 3268 → 3264 → 3260 → 3255 → 3250 → 3240
⚠️ Risk Management:
With strong volatility today, manage your risk carefully. It’s essential to adhere to your TP/SL to protect your account. Stay cautious, as there is a lot of unpredictability in the market with the upcoming news.
Conclusion:
Given the unpredictability of the market and geopolitical tensions, it’s wise to trade with caution today. Watch the critical support and resistance levels closely and stay flexible, adapting your strategy based on how the market evolves.
📣 Stay tuned for more updates and trade smart!

EUR/USD – BEARISH BIAS IN PLAY, IS A FAKEOUT COMING?EUR/USD – BEARISH BIAS IN PLAY, IS A FAKEOUT COMING?
🧠 Market Context:
After a technical rebound earlier this week, EUR/USD is now consolidating inside a symmetrical triangle. Despite buyers attempting a breakout, low volume and price action still below the 200 EMA indicate weak bullish momentum.
The DXY is recovering on expectations the Fed will hold rates higher for longer.
Meanwhile, the Euro lacks fundamental support as the ECB remains cautious with policy moves.
👉 Given the current technical setup, the higher probability scenario (70%) is a bearish breakout, continuing the dominant downtrend.
📊 Trade Scenarios for Today:
✅ High Probability – SITUATION 1 (70%):
Price breaks below the triangle’s base near 1.1185–1.1190 and continues lower toward the 1.1110 demand zone.
⛔ SELL ZONE: 1.1210 – 1.1220 (after minor retest of broken trendline)
🎯 TP: 1.1180 → 1.1150 → 1.1120 → 1.1100
🛑 SL: 1.1245 (above EMA200)
🚨 Lower Probability – SITUATION 2 (30%):
Price breaks out and closes firmly above the triangle and 200 EMA (~1.124x) → short-term bullish reversal.
🔵 BUY ZONE: 1.1250 – 1.1260 (only after confirmed breakout with volume)
🎯 TP: 1.1290 → 1.1325 → 1.1350
🛑 SL: 1.1215
🔍 Key Technical Levels & EMA:
Resistance (200 EMA on H1): ~1.1247
Major Support Zones: 1.1180 – 1.1150 – 1.1110
🎯 Execution Strategy:
Favor short setups unless a clear bullish breakout occurs above 1.1247 with strong volume.
Watch for a breakdown and retest below 1.1180 to confirm bearish continuation.
Avoid premature entries — let price come to your levels.
⚠️ News to Watch:
No major data today, but USD is still sensitive to Fed tone and macro headlines.
Keep an eye on Fed speakers later in the NY session for potential impact on dollar direction.
✅ Final Thoughts:
The triangle pattern is coiling tight, but overall momentum favors sellers.
Expect liquidity sweeps and volatility traps, especially around session transitions.
Stick to your plan, respect your levels, and let the market decide the breakout direction.


EUR MXN LONG Investment Opportunity
The EUR/MXN pair is showing signs of recovery, with an interesting possibility of appreciation of the Euro against the Mexican Peso. In this analysis, we will explore a LONG strategy, with an entry point at 21.80, based on technical and fundamental considerations.
Position parameters:
Take Profit (TP): 22.80
Stop Loss (SL): 21.46
Trend analysis and motivations for LONG:
The Euro is showing a certain degree of stability thanks to the monetary policy of the ECB and the improving economic outlook in the Eurozone. On the other hand, the Mexican Peso could be pressured by the volatility of emerging markets and the decisions of Banxico on interest rates.
Graphically, the 21.80 level has acted as a key support, suggesting a favorable area for the opening of a LONG position. The 22.80 target represents a significant resistance, tested in previous market phases. If the bullish momentum is maintained, this level could be reached with a gradual progression.
Risk management and operational outlook:
The Stop Loss is positioned at 21.46, a point that could indicate a bearish breakout if reached. The risk/reward ratio appears balanced, allowing a prudent management of the position without exposing the capital to excessive risks.
Conclusion:
The LONG strategy on EUR/MXN is supported by technical and macroeconomic factors that indicate a possible revaluation of the Euro in the short-medium term. Monitoring global economic developments and central bank decisions will be essential to confirm the validity of this approach.

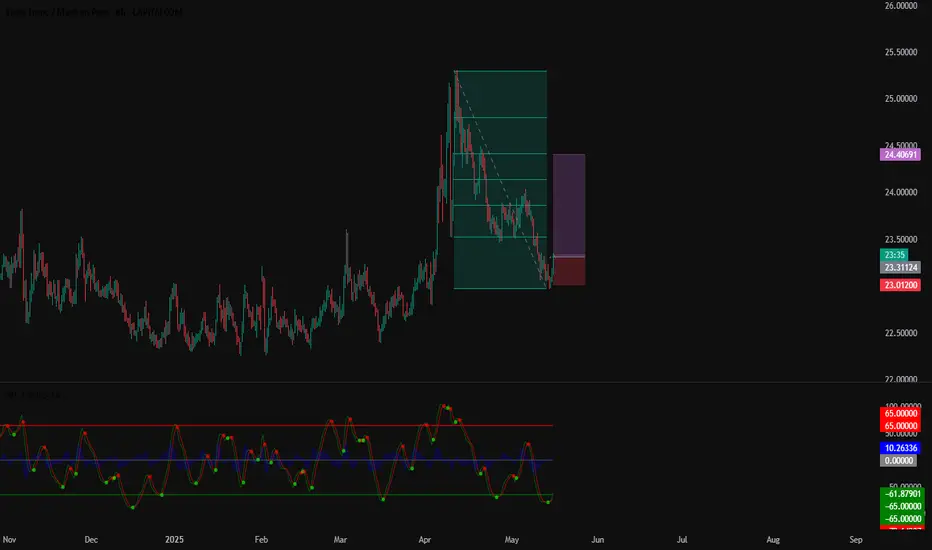
Investment Opportunity CHF/MXN LONG
The CHF/MXN cross is showing interesting signs of recovery after a consolidation phase. With a view to the strengthening of the Swiss Franc against the Mexican Peso, I decided to set a LONG position, with an entry point at 23.31.
Key levels of the strategy:
Take Profit (TP): 24.4060
Stop Loss (SL): 23.0100
Rationale for the LONG position:
Technical analysis suggests a potential rebound, supported by several macroeconomic factors. Switzerland continues to maintain a prudent monetary policy, with stable interest rates and a currency considered a safe haven in times of uncertainty. On the contrary, the Mexican Peso is subject to pressure from inflation and volatility in emerging markets.
Looking at the chart, the 23.31 level has proven to be a significant support, increasing the probability of a bullish move towards the 24.4060 target, a key resistance level that coincides with a previous distribution area.
Risk Management:
The Stop Loss is set at 23.0100, a level that, if reached, would invalidate my bullish idea and signal a possible trend reversal. With this setup, the risk/reward ratio is favorable, ensuring a balance between caution and profit opportunities.
Conclusion:
The current configuration of CHF/MXN presents an interesting opportunity for those looking for medium-term movements. If the momentum remains positive, the price could approach the 24.40 area, confirming the validity of the LONG strategy. Closely monitoring global economic dynamics and monetary policies will be key for active position management.
SHORT NZD/CNH 8H Investment Opportunity
Hello, I am trader Andrea Russo and today I want to talk to you about a SHORT investment opportunity on the NZD/CNH exchange rate.
Trade Details
The trade starts at the 4.40 area with a Stop Loss (SL) at 4.44 and a Take Profit (TP) at 4.21.
Market Analysis
Currently, the NZD/CNH exchange rate is around 4.381. The recent performance of the NZD has shown some volatility, influenced by economic factors such as inflation in New Zealand and trade policies. These elements have contributed to creating a context of uncertainty that could favor a decline in the exchange rate.
Trading Strategy
The proposed strategy involves entering a SHORT position at 4.40, anticipating a decline towards the level of 4.21. The Stop Loss at 4.44 is used to limit losses in case the market moves against our prediction. This setup offers a good risk/reward ratio, making the trade interesting for traders looking for short-term profit opportunities.
Final Thoughts
This trading opportunity requires careful risk management and constant monitoring of market conditions. The volatility of the NZD/CNH exchange rate can offer good profit opportunities, but it is essential to be prepared to react quickly to changes. It is advisable to stay updated on economic news and events that could affect the market.
Happy trading!

LONG GBP/CHF Investment Opportunity
Hello, I am Trader Andrea Russo, and today I want to share an investment opportunity that I consider extremely interesting: a LONG position on GBP/CHF.
In recent months, the GBP/CHF currency cross has shown signs of consolidation and a potential resumption of the bullish trend. In this article, I will analyze in detail the reasons that make this investment promising, the key points to monitor and the strategies to manage risk and maximize profits.
Investment Strategy: Main Points
Entry: The LONG position is opened at the price of 1.01119, a level that represents an interesting technical area and is located near the recent lows of the market.
Stop Loss (SL): To minimize risks, the SL is set at a distance of 0.95%. This level protects us from sudden movements contrary to our direction.
Take Profit (TP): The final target is set at 2.83%. This target allows us to capitalize on a significant bullish move.
GBP/CHF Technical Analysis
Technical analysis provides us with useful tools to understand the historical and future behavior of the market. In the case of GBP/CHF, there are some interesting signals:
1. Support and Resistance
Support: The level of 1.01119 is configured as a key support. Historically, the market has respected this area, bouncing on several occasions. This makes it the ideal level to position Long.
Resistance: The first significant resistance area is located around 1.03000. If the price breaks this threshold, it is likely to open up room for further bullish movements.
2. Moving Average and Trend
The 50 and 200-period moving averages on the daily chart indicate a possible bullish reversal. GBP/CHF is attempting to break above the short-term moving average, an encouraging sign for traders looking for Long opportunities.
3. Chart Patterns
A potential double bottom is forming on the 4H and daily charts. This pattern is a classic reversal indicator, suggesting growing strength among buyers.
4. Technical Indicators
RSI: The RSI indicator is currently in the neutral zone, around 50. A breakout above 60 would confirm the bullish strength.
MACD: The MACD oscillator is showing a bullish crossover, with the signal line above zero. This is another sign that the bullish momentum could gain strength.
Fundamental Analysis
Fundamental analysis is also crucial to support our strategy.
1. Monetary Policies and Interest Rate Differential
British Pound (GBP): The Bank of England has recently adopted a restrictive monetary policy, raising interest rates. This could favor an appreciation of the pound against the Swiss franc.
Swiss Franc (CHF): Swiss monetary policy, although historically prudent, could be affected by global inflation pressure, but the CHF remains less aggressive in raising rates.
2. Economic Context
Consumer confidence in the UK is recovering, and recent data shows stable GDP growth. These factors support a possible strengthening of the pound. On the other hand, the Swiss franc is influenced by increased demand for safe haven currencies, but could come under pressure in the context of a global economic recovery.
Risk Management
The most important aspect of any trading strategy is risk management:
Risk-Reward Ratio: With a SL of 0.95% and a TP of 2.83%, the risk-reward ratio is very favorable, above 1:3.
Diversification: This trade should be part of a diversified portfolio to minimize global risks.
Conclusions
Investing in GBP/CHF with a LONG position at 1.01119 represents an interesting opportunity based on both technical and fundamental analysis. The combination of key levels, technical signals and economic context suggests a potential bullish movement. However, let's remember that the market is unpredictable, and good risk management is essential.
I hope this analysis is useful for your trading strategy. If you have any questions or want to share your point of view, do not hesitate to do so in the comments!

EUR/GBP LONG Investment Opportunities: Technical Analysis
The currency market offers new investment opportunities, and among the most interesting pairs of the moment we find EUR/GBP, with a favorable configuration for a long trade.
Entry Point and Trading Objectives
Entry: 0.8526
Take Profit (TP): +1.34%
Stop Loss (SL): -0.44%
This trade is based on in-depth technical analysis, considering key support and resistance levels that reinforce the hypothesis of a bullish movement.
Technical Analysis and Market Trends
After a consolidation phase around the 0.8526 threshold, the currency cross shows signs of bullish strength, with technical indicators confirming a potential breakout.
Primary Trend: Bullish with dynamic support.
RSI: In the neutral zone, indicating room for further growth.
Moving Averages: The 50-period crossed the 200-period, a sign of positive momentum.
Optimism on the single currency is also supported by fundamental factors, including monetary policies of the European Central Bank (ECB) and economic dynamics of the United Kingdom.
Risk Management and Final Considerations
To mitigate market volatility, the trade is accompanied by a Stop Loss at -0.44%, to protect the capital from any unexpected reversals.
Investors interested in this opportunity should carefully monitor macroeconomic events, such as inflation data and interest rate decisions, which could influence the direction of the EUR/GBP exchange rate.

LONG EUR/SGD Investment Opportunity
Entry: 1.46708 Take Profit (TP): +1.33% Stop Loss (SL): -0.86%
📊 Market Overview
EUR/SGD is in a strategic zone, with an entry level set at 1.46708, an area that could act as a key support. The idea of this LONG trade is based on a possible resumption of the trend, taking advantage of a bullish movement in case of confirmation of the momentum.
🔍 Technical Analysis
Key Support: The price has tested the entry level several times, suggesting a potential base for a restart.
Resistance: The TP target implies a movement of +1.33%, indicating a possible breakout to new highs.
Stop Loss: The protection set at -0.86% helps manage the risk and minimize any losses.
📈 Risk Management
Capital management is crucial. With a Stop Loss of 0.86%, the risk is well calibrated against the potential gain of 1.33%, maintaining a positive risk/reward ratio.
🔥 Conclusion
If the price confirms the support and shows signs of strength, this LONG strategy on EUR/SGD could generate a favorable opportunity. However, it is always essential to monitor the market conditions and adjust the strategy if necessary.

Is $3000 the Next Stop for Gold? Double Top Formation in Play!Is $3000 the Next Stop for Gold? Double Top Formation in Play!
Gold (XAU/USD) is showing signs of a potential bearish reversal as it forms a Double Top pattern on the daily chart. After hitting an all-time high near $3,500, the metal has entered a sharp correction phase and is now hovering dangerously close to key psychological support at $3,200.
Technical Analysis Breakdown:
A clear Double Top pattern is forming on the Daily (D1) chart, with two peaks near the same resistance level — a classical bearish signal indicating bullish exhaustion.
If today’s daily candle closes below the $3,200 level, we could see a rapid decline toward $3,000 in the short to medium term.
The neckline for this pattern aligns with the critical support zone between 3196–3200, which is the key area to monitor for potential breakdown confirmation.
What’s the Smart Money Doing?
Investors are currently pulling out of gold and rotating into higher-risk assets like equities and cryptocurrencies, looking for higher yields and growth potential.
This shift in investment suggests that the current sell-off might not just be a technical correction, but also a sign of changing macro sentiment — particularly if the Fed continues with a hawkish stance and delays rate cuts.
Suggested Trade Scenarios:
🔻 If Daily Close is Below $3,200:
High probability sell setup based on the Double Top pattern
Potential downside targets: 3120 → 3050 → 3000
🔺 If Price Holds Above $3,200 and Bounces:
Watch for a retracement to 3250–3278 for potential reversal signals
Short-term BUY scalp towards 3300–3320 with a tight SL below 3190
What to Watch This Week:
Keep an eye on key US economic data, including CPI, PPI, and a Fed Chair speech, which could cause significant volatility.
The market is highly reactive right now — avoid emotional trades and wait for clear confirmation from the charts.
Risk management is essential, especially during these uncertain times.
Final Thoughts:
The Double Top pattern on Gold is becoming a significant technical signal for a potential trend reversal. A confirmed break below $3,200 could open the door for a deeper correction toward $3,000.
📣 Stay connected with AD for more real-time updates, technical insights, and trading setups during every market session.

Gold Faces Strong Sell-Off: Is a Reversal on the Horizon? Gold Faces Strong Sell-Off After Initial Bounce – Is a Reversal Looming?
Gold opened the day with a slight uptick, only to be quickly slammed down, reflecting the current weakness in buying power. The market is reacting to news in flashes, quickly reversing direction — slow on the way up, but fast on the way down. This is the perfect reflection of a market losing confidence in any recovery trend.
🧐 Is This a Sign That Gold Is Heading Towards a Strong Reversal Zone?
📌 Support Zones to Monitor:
3222 – 3220: Short-term cushion. If this fails, expect further downward pressure.
3206 (M30): Next level of defense where technical reactions may occur.
⏳ Caution: Early European session tends to show strong volatility. If no clear signs of a bounce, be cautious of sudden sharp drops.
As for the trade negotiations, the developments around tariffs have been much more positive recently. Most news points toward further downside pressure on Gold, and it seems to be staying in the downward price channel. The price zones are not much different from yesterday’s levels, so I’ll slightly adjust my entries for today.
Watch the Resistance Levels: They are key for shorting opportunities. The BUY setup still seems far off; it’s hard to pick a good entry with resistance zones appearing everywhere right now. Don't rush into BUY positions just yet!
📊 Key Resistance Levels:
3244 – 3262 – 3278 – 3290 – 3308 – 3330
📊 Key Support Levels:
3216 – 3206 – 3194 – 3170 – 3158
🎯 Scalping BUY Zones:
BUY SCALP: 3196 – 3194
SL: 3190
TP: 3200 – 3204 – 3208 – 3212 – 3216 – 3220
BUY ZONE: 3158 – 3156
SL: 3152
TP: 3162 – 3166 – 3170 – 3174 – 3178 – 3182 – 3190
🎯 Scalping SELL Zones:
SELL SCALP: 3257 – 3259
SL: 3263
TP: 3253 – 3250 – 3246 – 3242 – 3238 – 3235 – 3230 – 3220
SELL ZONE: 3278 – 3280
SL: 3284
TP: 3274 – 3270 – 3266 – 3262 – 3258 – 3254 – 3250 – 3240 – 3230
🔎 Key Insights:
The market is moving in a tight range, but gold continues to hold below significant resistance. As the geopolitical situation stabilizes and tariff talks improve, any sudden price reversals will be important to monitor. The FOMC meeting and global developments will play key roles in shaping the future trend for gold.
💡 Conclusion:
Gold is facing a strong sell-off after testing key resistance. Focus on shorting at key resistance zones and be cautious with any buys until a clearer upward trend forms. Stay disciplined, watch the support levels carefully, and manage your trades well!

EURCHF Will Go Down From Resistance! Sell!
Take a look at our analysis for EURCHF.
Time Frame: 2h
Current Trend: Bearish
Sentiment: Overbought (based on 7-period RSI)
Forecast: Bearish
The market is testing a major horizontal structure 0.936.
Taking into consideration the structure & trend analysis, I believe that the market will reach 0.934 level soon.
P.S
Overbought describes a period of time where there has been a significant and consistent upward move in price over a period of time without much pullback.
Disclosure: I am part of Trade Nation's Influencer program and receive a monthly fee for using their TradingView charts in my analysis.
Like and subscribe and comment my ideas if you enjoy them!

USD/JPY Long, EUR/CAD Short, GBP/USD Neutral and EUR/USD ShortUSD/JPY Long
Minimum entry requirements:
• If structured 1H continuation forms, 1H risk entry within it.
EUR/CAD Short
Minimum entry requirements:
• If structured 1H continuation forms, 1H risk entry within it.
GBP/USD Neutral
Minimum entry requirements:
• If structured 1H continuation forms, 1H risk entry within it.
EUR/USD Short
Minimum entry requirements:
Minimum entry requirements:
• If structured 1H continuation forms, 1H risk entry within it.

GBP/USD Set for a Big Move! Will It Break the Channel or Reboun📈 GBP/USD DAILY PLAN – 12/05/2025
🔍 Technical Overview:
The GBP/USD pair is currently consolidating in a descending channel, with clear resistance and support levels. After forming a short-term high at 1.32507, the price is showing signs of retracing and looks set to continue the downward move.
Key Resistance Levels:
1.32507: The latest high, still unbroken. This is a key resistance level in the short term.
1.31690: The next resistance level, which could provide bearish momentum as the price touches it.
1.31417: A strong resistance level if the price continues to rise.
Key Support Levels:
1.32474: A strong support zone, likely to be tested if the price dips.
1.32169: A short-term support level for potential reversal.
1.31216: A key support level in case of a sharp decline, potentially a strong BUY zone.
🎯 Trade Scenarios:
1. Bearish Breakout Scenario:
SELL Zone: 1.32507 – 1.31690
Stop Loss (SL): 1.3300
Take Profit (TP): 1.31417 → 1.31000 → 1.30500
2. PullbackScenario – Reversal at Support:
BUY Zone: 1.31216 – 1.31417
Stop Loss (SL): 1.31000
Take Profit (TP): 1.31800 → 1.32100 → 1.32400
⚠️ Notes:
Market Sentiment: The market is highly sensitive to ongoing political and economic developments, especially comments from ECB and Fed officials. Watch the key support and resistance levels carefully before making any trades today.
Risk Management: Be sure to manage your SL/TP levels carefully and avoid chasing signals during volatile market moves.
📣 Important:
Today is a key day with important macroeconomic data that could shift market sentiment, particularly from Fed officials and trade talks. Be cautious and wait for confirmation signals before entering any trades.
