EUR/CAD LONG Investment OpportunityHello, I am Forex Trader Andrea Russo and today I want to talk to you about an interesting trade on EUR/CAD.
In the world of Forex, every trade is a combination of analysis, strategy and intuition. Today I decided to open a buy position (BUY) on EUR/CAD based on the 4-hour timeframe. This choice comes from technical and fundamental signals that indicate potential favorable movements.
The details of my trade:
Entry Price (Entry Point): 1.53771
Stop Loss (SL): 1.52444
Take Profit (TP): 1.55621
I set the Stop Loss at 1.52444 to manage the risk effectively. It is essential to protect the capital, especially in a volatile market like the currency market. At the same time, the Take Profit is set at 1.55621, aiming to capture a significant positive movement.
Why EUR/CAD?
EUR/CAD has an interesting market dynamic influenced by European and Canadian economic factors. At the moment, technical indicators such as support and resistance, along with trend analysis and candlestick patterns, suggest a possible growth opportunity for the Euro against the Canadian Dollar.
Conclusion
Every trade is a step towards knowledge and experience. Although the outcome may vary, disciplined approach and risk management are always at the heart of every decision. I will update you on the results of this trade and continue to share my trading strategies and ideas.
Trading-forex

CAD/CNH SHORT Investment Opportunity
Hello, I am Forex Trader Andrea Russo and today I want to share with you a short trade on CAD/CNH.
In the world of Forex, every open position tells a story of analysis and strategic choices. This time I decided to focus on a short position on the CAD/CNH currency pair, with a particular focus on risk management and achieving the objectives set.
Trade details:
Entry Price (Entry Point): 5.09402
Stop Loss (SL): 5.10417
Take Profit (TP): 5.06362
Being a short position, my goal is to capture a potential decline in the Canadian dollar against the Chinese yuan. I set a Stop Loss at 5.10417 to limit any losses and a Take Profit at 5.06362 to ensure a profitable exit if the market moves as expected.
Why CAD/CNH?
This currency pair offers an interesting dynamic related to macroeconomic factors from Canada and China, including export data, monetary policies and global market movements. Technical analysis highlights patterns that justify a potential downtrend, ideal for a short position.
Conclusion
Forex trading requires discipline and patience, but every trade is an opportunity for growth and learning. I will continue to monitor the market and update you on the evolution of this position. Don't forget: risk management is always the priority!

EURUSD Is Very Bearish! Short!
Please, check our technical outlook for EURUSD.
Time Frame: 6h
Current Trend: Bearish
Sentiment: Overbought (based on 7-period RSI)
Forecast: Bearish
The price is testing a key resistance 1.082.
Taking into consideration the current market trend & overbought RSI, chances will be high to see a bearish movement to the downside at least to 1.069 level.
P.S
Overbought describes a period of time where there has been a significant and consistent upward move in price over a period of time without much pullback.
Disclosure: I am part of Trade Nation's Influencer program and receive a monthly fee for using their TradingView charts in my analysis.
Like and subscribe and comment my ideas if you enjoy them!

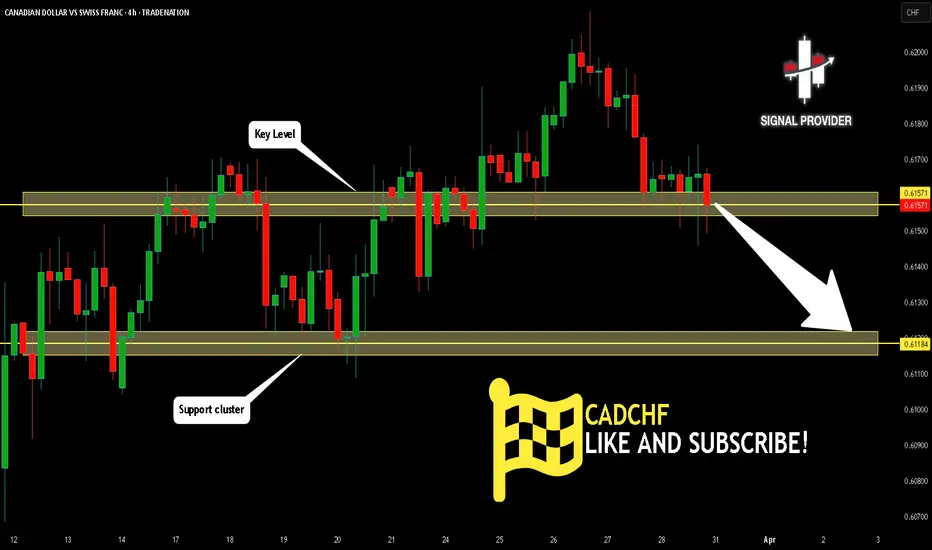
CADCHF Will Go Lower From Resistance! Sell!
Please, check our technical outlook for CADCHF.
Time Frame: 4h
Current Trend: Bearish
Sentiment: Overbought (based on 7-period RSI)
Forecast: Bearish
The market is approaching a key horizontal level 0.615.
Considering the today's price action, probabilities will be high to see a movement to 0.611.
P.S
We determine oversold/overbought condition with RSI indicator.
When it drops below 30 - the market is considered to be oversold.
When it bounces above 70 - the market is considered to be overbought.
Disclosure: I am part of Trade Nation's Influencer program and receive a monthly fee for using their TradingView charts in my analysis.
Like and subscribe and comment my ideas if you enjoy them!
AUD/USD BULLISH BIAS RIGHT NOW| LONG
AUD/USD SIGNAL
Trade Direction: long
Entry Level: 0.629
Target Level: 0.631
Stop Loss: 0.627
RISK PROFILE
Risk level: medium
Suggested risk: 1%
Timeframe: 1h
Disclosure: I am part of Trade Nation's Influencer program and receive a monthly fee for using their TradingView charts in my analysis.
✅LIKE AND COMMENT MY IDEAS✅

Weekly Analysis for Week 13 2025!Hello fellow traders , my regular and new friends!
Did you managed to get some pips from EURUSD before the mid week reversal ?
Or did you catch some pips from EJ as well?
No? Missed out on it? No worries, check out my trading analysis for next week (week 13) to get some insights and tips for the potential moves in the Forex market!
Do Like and Boost if you have learnt something and enjoyed the content, thank you!
-- Get the right tools and an experienced Guide, you WILL navigate your way out of this "Dangerous Jungle"! --
*********************************************************************
Disclaimers:
The analysis shared through this channel are purely for educational and entertainment purposes only. They are by no means professional advice for individual/s to enter trades for investment or trading purposes.
*********************************************************************

EUR/USD LONG 4H
Hello, I am Forex Trader Andrea Russo, and today I want to share with you a strategy I have adopted for a position on EUR/USD. I will analyze the reasoning behind my choice and the setup I am using to maximize opportunities, minimizing risk.
The trade setup
I decided to enter EUR/USD with an entry level at 1.08483, setting a stop loss (SL) at 1.08095 and a take profit (TP) at 1.0944. This trade is based on a series of technical and fundamental factors that suggest a probable continuation of the upward movement.
Technical analysis
My decision is supported by some key technical signals:
Uptrend: The EUR/USD cross has shown good recent strength, supported by a series of higher lows.
Support at 1.08095: The SL level has been set below the main support to protect the trade from a potential reversal.
Resistance at 1.0944: The TP was calculated based on a major resistance level that could serve as a target for a significant upside move.
Fundamental Analysis
From a fundamental perspective, there are several elements that are positively influencing EUR/USD:
Divergent monetary policies: The prospect of more hawkish ECB policies versus the Fed is supporting the euro.
Macroeconomic factors: Recent data on economic growth expectations in the eurozone provide a favorable backdrop for the cross to rise.
Risk/reward ratio
With a stop loss set at 1.08095 and a take profit at 1.0944, the risk/reward ratio of this trade is optimal, standing at around 1:2. This setup allows you to contain your risk and aim for a significant gain.
Trade Management
Once the position is opened, I will monitor the market movements and keep an eye on key indicators to assess any adjustments. If prices move quickly towards the TP, I may consider partially closing the position to protect profits.
Conclusion
This trade represents an interesting opportunity in a dynamic and variable market. Risk management remains the cornerstone of any winning strategy, and with a well-calculated setup like this, we aim to make the most of market conditions.

Week of 3/23/25: AUDUSD AnalysisAnalysis of my main pair AUDUSD, last week resulted in the bears taking over and my analysis explains why my bias is bearish going into the new week.
Not much volatile news except for Unemployment Claims on Thursday.
Let me know what you guys think, your analysis, and if you want to see anything else!
Goodluck this week traders, let's kill it.

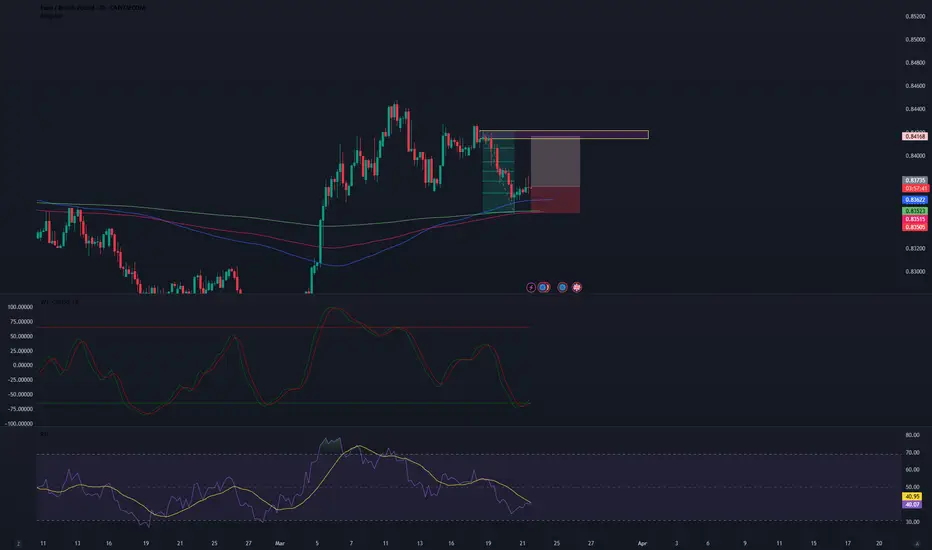
EUR/GBP LONG 4H
Hi, my name is Russo Andrea and I am a Forex Trader. Today I want to talk to you about a trading strategy that I am considering on EUR/GBP, a very interesting pair for those who, like me, operate in the currency markets.
The idea behind this trade is to go LONG on EUR/GBP. After analyzing the technical data and fundamentals, I believe that there is an interesting profit opportunity. Here are the details of my strategy:
Entry Point: 0.83781
Stop Loss (SL): 0.8550
Take Profit (TP): 0.84168
Trade Rationale: This trade is based on a combination of technical and fundamental analysis. Looking at the charts, we have a key support near the 0.83781 area, which represents an ideal level to open a long position. Technical indicators, such as RSI and moving averages, are showing signs of a possible bullish reversal.
On the other hand, my Stop Loss at 0.8550 was strategically placed to limit losses if the market moves against us, while still maintaining an acceptable risk for this trade. The Take Profit at 0.84168, on the other hand, represents a realistic level of profit based on previous resistances.
Risk Management: Risk management is essential in trading. It is important to always stick to your plan, without being influenced by emotions. With this trade, I am maintaining a balanced risk/reward ratio, increasing the probability of success in the long term.
GBP Retreats as BoE Maintains PolicyThe pound dipped below $1.30, retreating from a four-month high after the BoE held rates at 4.5% and signaled a cautious approach to easing policy, despite recent inflation progress.
Global trade tensions added pressure, with new U.S. tariffs prompting retaliatory moves and raising inflation risks.
UK data showed weak growth, steady 4.4% unemployment, and wage growth easing to 5.8%, in line with forecasts. In the U.S., the Fed kept rates steady but reaffirmed plans for two cuts this year.
If GBP/USD breaks above 1.3050, the next resistance levels are 1.3100 and 1.3150. On the downside, support stands at 1.2860, with further levels at 1.2800 and 1.2715 if selling pressure increases.

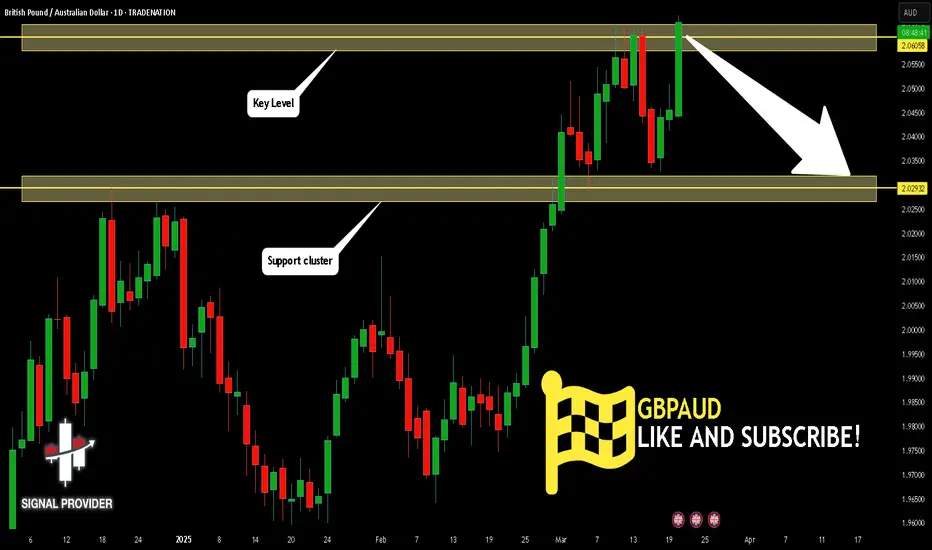
GBPAUD Will Fall! Short!
Please, check our technical outlook for GBPAUD.
Time Frame: 1D
Current Trend: Bearish
Sentiment: Overbought (based on 7-period RSI)
Forecast: Bearish
The price is testing a key resistance 2.060.
Taking into consideration the current market trend & overbought RSI, chances will be high to see a bearish movement to the downside at least to 2.029 level.
P.S
Overbought describes a period of time where there has been a significant and consistent upward move in price over a period of time without much pullback.
Disclosure: I am part of Trade Nation's Influencer program and receive a monthly fee for using their TradingView charts in my analysis.
Like and subscribe and comment my ideas if you enjoy them!
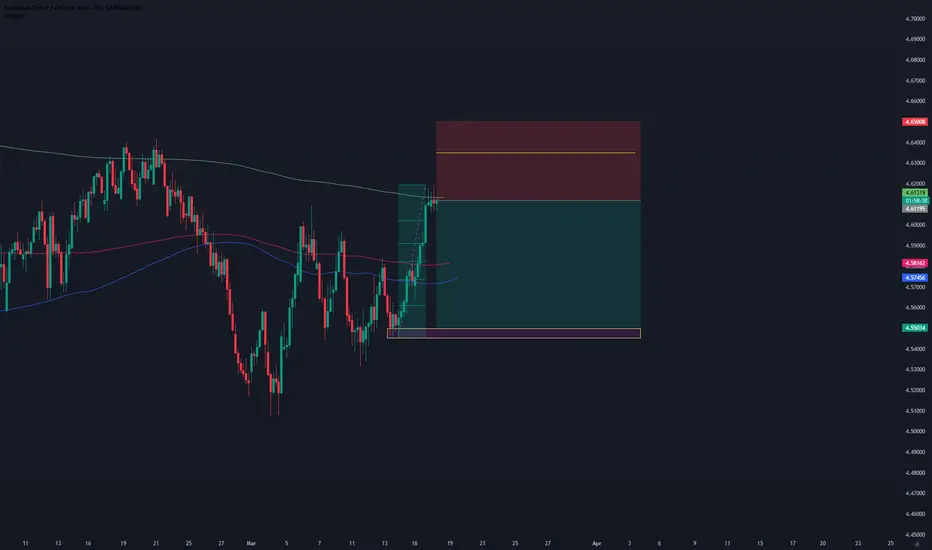
AUDCNH SELL 4H
Hello, I am Forex Trader Andrea Russo and today I want to talk to you about an interesting strategy for the AUDCNH currency cross.
Currently, the AUDCNH exchange rate is at a value of 4.61195, and I have identified a selling opportunity based on technical and fundamental analysis. My strategy involves a short entry at this level, with a stop loss (SL) placed at 4.63500, which represents a potential loss of 0.50%. My profit target (TP) is set around 4.55, aiming for a significant bearish movement.
Technical Analysis
The AUDCNH is showing signs of weakness, with a key resistance that has formed near the 4.63500 level. Technical indicators, such as the RSI and the MACD, suggest a possible bearish reversal. Furthermore, the price is below the major moving averages, confirming a bearish trend.
Fundamental Analysis
From a fundamental perspective, the Australian dollar may be under pressure due to weak economic data and a less hawkish monetary policy by the Reserve Bank of Australia (RBA). On the other hand, the Chinese renminbi is benefiting from relative economic stability and targeted stimulus policies.
Trading Strategy
Entry: 4.61195
Stop Loss: 4.63500 (-0.50%)
Take Profit: 4.55 (approximately)
This setup offers an attractive risk/reward ratio, making it a potentially profitable strategy for traders looking for opportunities in the Forex market.
NZD/JPY SELL 4H
Hi, my name is Andrea Russo and I am a Forex Trader. Today I want to talk to you about an interesting trade on the NZD/JPY cross.
I have currently decided to position myself in sale (short) on NZD/JPY at an entry price of 86,860, with a stop loss set at 87,840 and a target price of 84,190. I will explain my reasoning behind this choice and the technical and fundamental analyses that supported my decision.
Technical Analysis
Looking at the daily chart of NZD/JPY, I noticed a significant resistance in the area around 87,000, which in the past has repeatedly rejected attempts to increase the price. At the time of entry, the price was showing signs of weakness near the resistance, indicating to me an excellent opportunity for a short position. Furthermore, the RSI and MACD indicators were suggesting an overbought condition, reinforcing the possibility of an impending bearish move.
From an Elliott wave perspective, the cross appears to be in a possible corrective wave, with room for further downside towards the target level of 84,190.
Fundamental Analysis
On the fundamental side, the New Zealand Dollar (NZD) looks vulnerable due to the recent economic slowdown in New Zealand, while the Japanese Yen (JPY) has shown signs of strengthening as a safe haven, especially amid global uncertainty. Monetary policies from respective central banks point to a possible tailwind in favor of the Yen, further increasing the bearish outlook for the NZD/JPY pair.
Strategy
My strategy involves:
Short Price: 86,860
Stop Loss: 87,840 (to limit losses in case of contrary movements)
Target Price: 84,190 (key support area, representing a reasonable level of profit).
This trade is based on a balance between technical and fundamental analysis, with a favorable risk/reward ratio.
Conclusion
I remain alert for any news or market events that could affect the trade and adjust the strategy if necessary. Remember that Forex trading carries significant risks and is not suitable for all investors.
I hope this analysis can be useful to you. Happy trading and may the pips be in your favor!

BITCOIN Will Go Lower From Resistance! Sell!
Here is our detailed technical review for BITCOIN.
Time Frame: 4h
Current Trend: Bearish
Sentiment: Overbought (based on 7-period RSI)
Forecast: Bearish
The market is trading around a solid horizontal structure 83,533.11.
The above observations make me that the market will inevitably achieve 79,022.44 level.
P.S
Please, note that an oversold/overbought condition can last for a long time, and therefore being oversold/overbought doesn't mean a price rally will come soon, or at all.
Disclosure: I am part of Trade Nation's Influencer program and receive a monthly fee for using their TradingView charts in my analysis.
Like and subscribe and comment my ideas if you enjoy them!

EURUSD Will Go Lower! Short!
Take a look at our analysis for EURUSD.
Time Frame: 6h
Current Trend: Bearish
Sentiment: Overbought (based on 7-period RSI)
Forecast: Bearish
The market is testing a major horizontal structure 1.089.
Taking into consideration the structure & trend analysis, I believe that the market will reach 1.078 level soon.
P.S
The term oversold refers to a condition where an asset has traded lower in price and has the potential for a price bounce.
Overbought refers to market scenarios where the instrument is traded considerably higher than its fair value. Overvaluation is caused by market sentiments when there is positive news.
Disclosure: I am part of Trade Nation's Influencer program and receive a monthly fee for using their TradingView charts in my analysis.
Like and subscribe and comment my ideas if you enjoy them!

BTCUSD 15MINTS CHART TECHNICAL ANALYSIS NEXT MOVE POSSIBLE..This chart shows a potential bullish move for Bitcoin (BTC/USD).
The price is currently in a support zone (blue area) around 81,800-82,000.
A breakout from this level is expected, leading to a rise toward 83,224 (resistance level).
If momentum continues, BTC could reach 84,457.
The blue arrows indicate the expected bullish movement.

EURNZD BUY 4H
Hello, I am Forex Trader Andrea Russo and today I want to talk to you about a promising strategy for the EURNZD currency cross.
The EURNZD is showing interesting signals for an upward movement. I decided to open a long position at 1.87460, with a stop loss (SL) at 1.861, which represents a potential loss of 0.50%. The profit target (TP) is set at 1.913, aiming for a consistent uptrend.
Technical Analysis
The EURNZD is going through a consolidation phase, offering a breakout opportunity to the upside. Technical indicators such as the MACD and the RSI indicate a growing bullish momentum. Furthermore, the price is positioning itself above the key moving averages, a sign of strength that supports my buy strategy.
Fundamental Analysis
On a fundamental level, the euro is benefiting from an improved economic environment in the Eurozone, along with a relatively stable monetary policy from the ECB. Conversely, the New Zealand dollar could be negatively affected by the recent volatility in the commodity markets, given the New Zealand economy's link to this sector.
Trading Strategy
Entry: 1.87460
Stop Loss: 1.861 (-0.50%)
Take Profit: 1.913
This setup offers a favorable risk/reward ratio and aligns with the current technical and fundamental environment. I recommend closely monitoring any changes in fundamentals or key technical levels that could impact the trade.

Weekly Analysis for Week 12 2025!Hello fellow traders , my regular and new friends!
How was your trading this week? Managed to catch the Eurjpy or GbpCad and EurCad movements as mentioned last week?
Which pairs or instruments should we keep a look out for?
This coming week is packed with interest rate decision, how?What to do?
Do check out my recorded video for more insights!
Do Like and Boost if you have learnt something and enjoyed the content, thank you!
-- Get the right tools and an experienced Guide, you WILL navigate your way out of this "Dangerous Jungle"! --
*********************************************************************
Disclaimers:
The analysis shared through this channel are purely for educational and entertainment purposes only. They are by no means professional advice for individual/s to enter trades for investment or trading purposes.
*********************************************************************

Silver Climbs on Weak Inflation DataSilver surged toward $33.90 an ounce, its highest since late October with ongoing trade tensions and rising Fed rate cut expectations after weak U.S. inflation data.
Trump threatened 200% tariffs on European wines in response to the EU’s 50% tariff on U.S. whiskey, further heightening market uncertainty. U.S. producer prices remained flat in February in the meantime, consumer inflation rose just 0.2%, and jobless claims declined, signaling a resilient labor market.
If silver breaks above $34.00, the next resistance levels are $34.85 and $35.00. On the downside, support is at $33.80, with further levels at $33.15 and $32.75 if selling pressure increases.

GOLD hit 3000$ The first notable event is the Bank of Japan (BOJ) monetary policy meeting on Tuesday, followed by the US Federal Reserve (FED) interest rate decision on Wednesday. The Swiss National Bank (SNB) and the Bank of England (BOE) will announce their interest rate policies on Thursday.
These moves can directly affect the strength of the USD and capital flows into gold. This expert believes that if the FED maintains a "hawkish" stance and takes a cautious view on cutting interest rates, the USD may continue to strengthen, putting pressure on gold prices. On the contrary, if the signals from the FED are more easing, the precious metal may maintain its upward momentum.
Commodity experts at Macquarie have raised their gold price forecast to $3,500 an ounce by the third quarter of 2025. They had previously targeted $3,000 for mid-year, but gold prices have hit that mark earlier than expected.

AAPL BULLS ARE GAINING STRENGTH|LONG
AAPL SIGNAL
Trade Direction: long
Entry Level: 213.28
Target Level: 232.17
Stop Loss: 200.88
RISK PROFILE
Risk level: medium
Suggested risk: 1%
Timeframe: 9h
Disclosure: I am part of Trade Nation's Influencer program and receive a monthly fee for using their TradingView charts in my analysis.

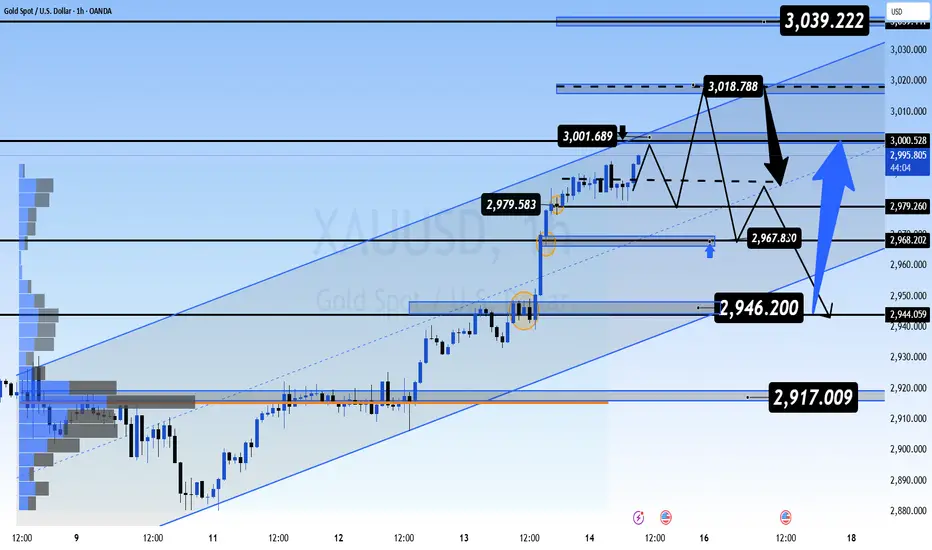
GOLD SURGES TO RECORD HIGH – IS $3,000 JUST THE BEGINNING?📌 Market Overview
Gold has surged to a new all-time high (ATH), approaching the critical $3,000 per ounce level. The rally has been fueled by recent inflation data (CPI & PPI), which has heightened market volatility. The US Dollar Index (DXY) has dropped to its lowest levels in recent months, further strengthening gold’s bullish momentum. As a result, investors are aggressively buying gold as a safe-haven asset amidst global economic and geopolitical uncertainty. 🚀
👉 Why is gold continuing to rise?
Investors are piling into gold, despite record-high prices, as uncertainty continues to drive demand for safe assets.
Donald Trump’s economic policies have added market instability, increasing gold's appeal.
As long as the USD remains weak, gold will continue to be a top investment choice.
📊 Will Gold Break Above $3,000?
🔹 Short-Term Outlook:
The Asian and European sessions are expected to remain bullish as investors continue accumulating gold.
The US session could bring some profit-taking, leading to temporary price swings.
Friday is historically volatile, meaning sharp pullbacks are possible before the week closes.
📉 Key Technical Levels to Watch
🔺 Resistance Levels: $3,000 - $3,019 - $3,039 - $3,052
🔻 Support Levels: $2,978 - $2,967 - $2,942 - $2,918
🎯 Trading Plan for Today
🔴 SELL ZONE: $3,039 - $3,041
📍 SL: $3,045
🎯 TP: $3,035 - $3,030 - $3,025 - $3,020 - $3,015 - $3,010 - ???
🟢 SCALP BUY: $2,968 - $2,966
📍 SL: $2,962
🎯 TP: $2,972 - $2,976 - $2,980 - $2,985 - $2,990 - $3,000
🟢 BUY ZONE: $2,948 - $2,946
📍 SL: $2,942
🎯 TP: $2,952 - $2,956 - $2,960 - $2,965 - $2,970 - $2,980 - $3,000 - ???
⚡ Final Thoughts – A Correction Before the Next Move?
📌 Gold continues its strong rally, but Friday could bring volatility as traders lock in profits.
📌 Stick to TP/SL strategies to manage risks and avoid sudden market swings.
📌 Watch the US session closely – major moves could happen!
💬 Will gold break $3,000 or face a sharp correction? Drop your thoughts below! 🚀🔥
GBPCAD Will Move Lower! Sell!
Please, check our technical outlook for GBPCAD.
Time Frame: 1D
Current Trend: Bearish
Sentiment: Overbought (based on 7-period RSI)
Forecast: Bearish
The market is approaching a key horizontal level 1.865.
Considering the today's price action, probabilities will be high to see a movement to 1.822.
P.S
We determine oversold/overbought condition with RSI indicator.
When it drops below 30 - the market is considered to be oversold.
When it bounces above 70 - the market is considered to be overbought.
Disclosure: I am part of Trade Nation's Influencer program and receive a monthly fee for using their TradingView charts in my analysis.
Like and subscribe and comment my ideas if you enjoy them!
