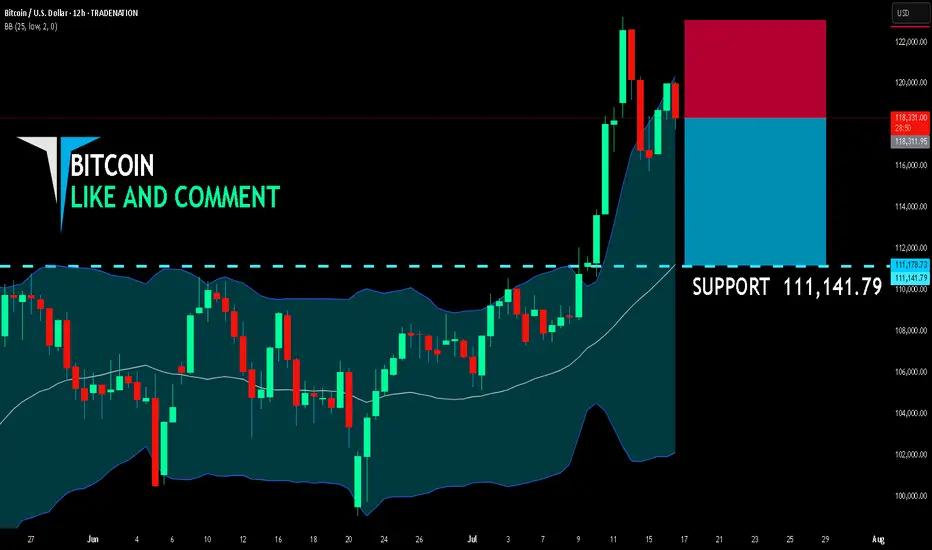
BITCOIN SHORT FROM RESISTANCE
BITCOIN SIGNAL
Trade Direction: short
Entry Level: 118,311.95
Target Level: 111,141.79
Stop Loss: 123,054.98
RISK PROFILE
Risk level: medium
Suggested risk: 1%
Timeframe: 12h
Disclosure: I am part of Trade Nation's Influencer program and receive a monthly fee for using their TradingView charts in my analysis.
✅LIKE AND COMMENT MY IDEAS✅
Trading
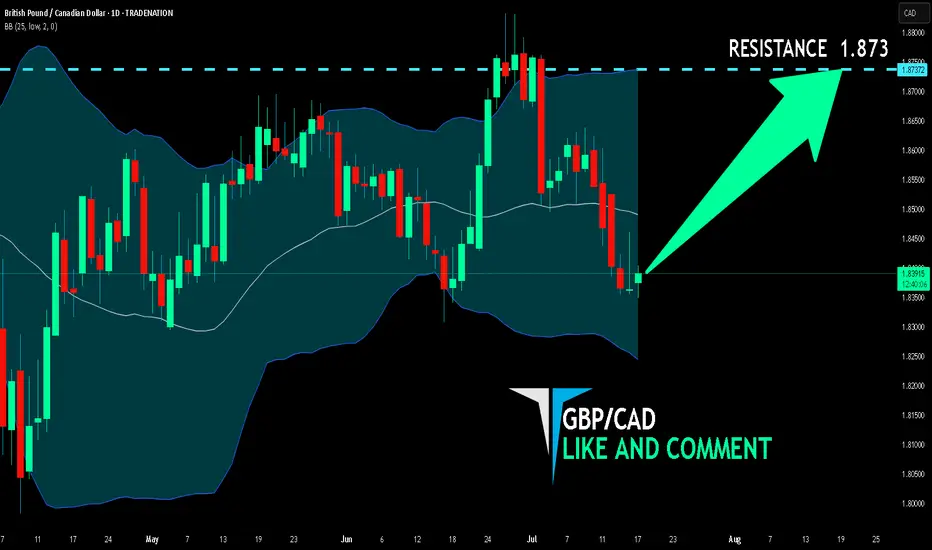
GBP/CAD BULLS ARE GAINING STRENGTH|LONG
Hello, Friends!
We are now examining the GBP/CAD pair and we can see that the pair is going down locally while also being in a downtrend on the 1W TF. But there is also a powerful signal from the BB lower band being nearby indicating that the pair is oversold so we can go long from the support line below and a target at 1.873 level.
Disclosure: I am part of Trade Nation's Influencer program and receive a monthly fee for using their TradingView charts in my analysis.
✅LIKE AND COMMENT MY IDEAS✅
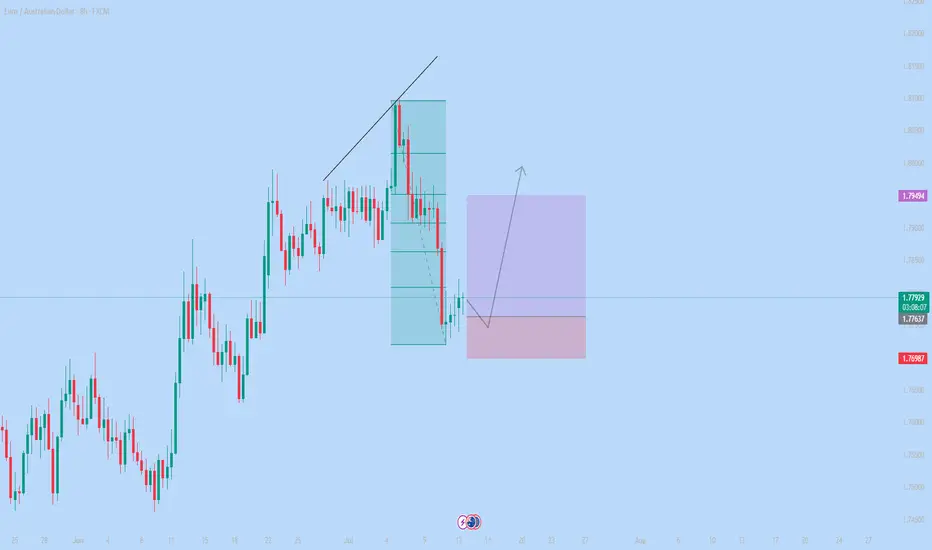
#009: EUR/AUD Long Investment Opportunity
We placed a buy limit order at 1,776, waiting for a bearish spike that would allow us to enter alongside the institutions, not against them.
Why this entry?
🔻 We're waiting for a false breakout at 1,776, a key level where big players are accumulating liquidity with technical stop hunts.
🔐 The SL is below the levels where banking systems have protective orders for the future.
📊 Retailers are still heavily short and aren't exiting, confirming that the upside movement hasn't started yet.
📈 Open interest shows anticipation of an imminent breakout, with progressive loading by large players.
⏳ We're staying out now to avoid being victims of the retracement, but ready to enter on the institutional bearish spike.
A violent expansion toward 1.79, with a directional candlestick that will start as soon as the retail cleanup below 1.776 is completed.
The trade has all the hallmarks of a perfect institutional entry: early positioning, patience, and a defensive stop.
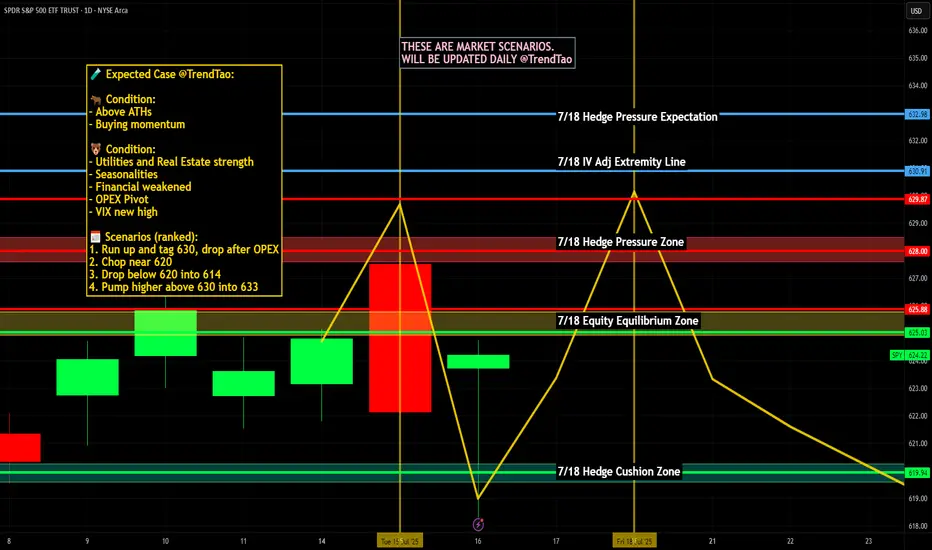
Nightly $SPY / $SPX Scenarios for July 17, 2025🔮 Nightly AMEX:SPY / SP:SPX Scenarios for July 17, 2025 🔮
🌍 Market-Moving News 🌍
🇮🇳 India–U.S. Inflation Divergence Dampens Dollar
India’s June retail inflation tumbled to a six-year low, while U.S. CPI hit its fastest pace since February—driven by tariff effects. This divergence is weakening the U.S. dollar against the rupee, pushing down dollar‑rupee forward premiums
📜 Treasury to Ramp Up T-Bill Issuance
Following the recent debt-ceiling increase, the U.S. Treasury plans to issue over $1 trillion in T-bills over the next 18 months. Money-market funds, flush with cash, are expected to absorb the supply, which could influence short-dated yields
💱 Dollar Eases Amid Fed-Related Volatility
Headline news that President Trump “highly unlikely” to fire Fed Chair Powell, coupled with stable PPI data, calmed markets. The dollar dipped slightly after earlier turmoil, while gold and bonds saw modest gains
📊 Key Data Releases & Events 📊
📅 Thursday, July 17:
(No major U.S. economic releases)
Markets will track T-bill issuance plans, dollar forward dynamics, and statements from the Treasury and Fed regarding debt and rate strategy.
⚠️ Disclaimer:
This is for educational purposes only—not financial advice. Consult a licensed financial advisor before making investment decisions.
📌 #trading #stockmarket #economy #dollar #tbills #inflation #Fed #technicalanalysis
EUR_JPY WILL GO UP|LONG|
✅EUR_JPY is trading along the rising support line
And as the pair is going up now
After the retest of the line
I am expecting the price to keep growing
To retest the supply levels above at 173.166
LONG🚀
✅Like and subscribe to never miss a new idea!✅
Disclosure: I am part of Trade Nation's Influencer program and receive a monthly fee for using their TradingView charts in my analysis.

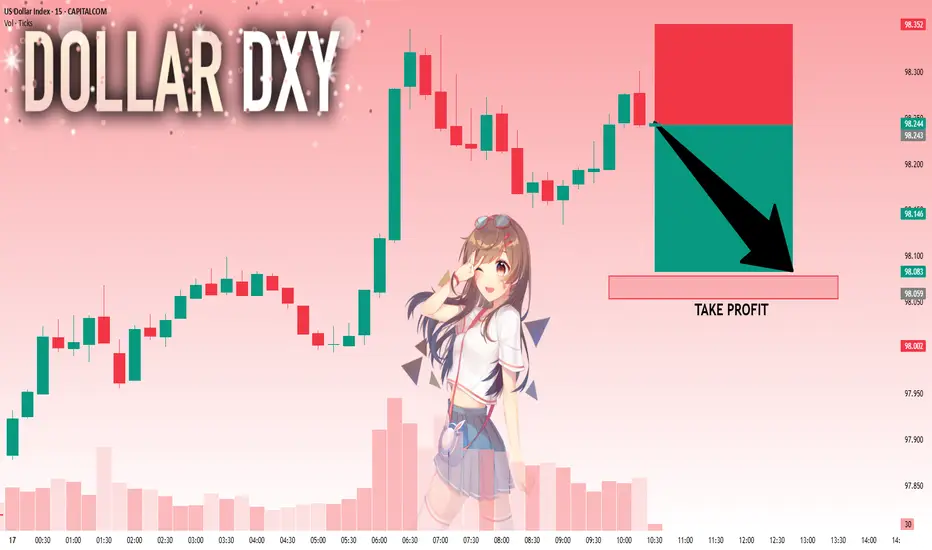
DXY: Next Move Is Down! Short!
My dear friends,
Today we will analyse DXY together☺️
The price is near a wide key level
and the pair is approaching a significant decision level of 98.243 Therefore, a strong bearish reaction here could determine the next move down.We will watch for a confirmation candle, and then target the next key level of 98.078..Recommend Stop-loss is beyond the current level.
❤️Sending you lots of Love and Hugs❤️
EURJPY Is Going Up! Long!
Here is our detailed technical review for EURJPY.
Time Frame: 7h
Current Trend: Bullish
Sentiment: Oversold (based on 7-period RSI)
Forecast: Bullish
The market is approaching a significant support area 172.355.
The underlined horizontal cluster clearly indicates a highly probable bullish movement with target 174.222 level.
P.S
Please, note that an oversold/overbought condition can last for a long time, and therefore being oversold/overbought doesn't mean a price rally will come soon, or at all.
Disclosure: I am part of Trade Nation's Influencer program and receive a monthly fee for using their TradingView charts in my analysis.
Like and subscribe and comment my ideas if you enjoy them!

GBP-CHF Local Short! Sell!
Hello,Traders!
GBP-CHF made a retest of
The wide horizontal resistance
Of 1.0780 and we are already
Seeing a bearish pullback
So as the pair is trading in a
Downtrend we will be expecting
A further bearish move down
Sell!
Comment and subscribe to help us grow!
Check out other forecasts below too!
Disclosure: I am part of Trade Nation's Influencer program and receive a monthly fee for using their TradingView charts in my analysis.

CAD_JPY BULLISH BIAS|LONG|
✅CAD_JPY is trading along
The rising support
And as the pair will soon retest it
I am expecting the price to go up
To retest the supply levels
Above at 108.708
LONG🚀
✅Like and subscribe to never miss a new idea!✅
Disclosure: I am part of Trade Nation's Influencer program and receive a monthly fee for using their TradingView charts in my analysis.

EUR-AUD Strong Uptrend! Buy!
Hello, Traders!
EUR-AUD is trading along
The rising support line in a
Strong uptrend so we we are
Bullish biased and as the pair
Is going down to retest the
Support we will be expecting
A rebound and a move up
Buy!
Comment and subscribe to help us grow!
Check out other forecasts below too!
Disclosure: I am part of Trade Nation's Influencer program and receive a monthly fee for using their TradingView charts in my analysis.

EUR_NZD LONG FROM RISING SUPPORT|
✅EUR_NZD is trading in an uptrend
Along the rising support line
Which makes me bullish biased
And the pair is about to retest the rising support
Thus, a rebound and a move up is expected
With the target of retesting the level above at 1.9544
LONG🚀
✅Like and subscribe to never miss a new idea!✅
Disclosure: I am part of Trade Nation's Influencer program and receive a monthly fee for using their TradingView charts in my analysis.

USD-JPY Will Keep Growing! Buy!
Hello,Traders!
USD-JPY is trading in an
Uptrend along the rising
Support line and the pair
Already made a bullish
Rebound and is consolidating
In a local range so as we
Are bullish biased we will
Be expecting a further
Bullish move up
Buy!
Comment and subscribe to help us grow!
Check out other forecasts below too!
Disclosure: I am part of Trade Nation's Influencer program and receive a monthly fee for using their TradingView charts in my analysis.

NZD-USD Will Go Down! Sell!
Hello,Traders!
NZD-USD already made a retest
Of the horizontal resistance
Of 0.5992 from where we
Are seeing a bearish reaction
And we will be expecting a
Further bearish move down
Sell!
Comment and subscribe to help us grow!
Check out other forecasts below too!
Disclosure: I am part of Trade Nation's Influencer program and receive a monthly fee for using their TradingView charts in my analysis.

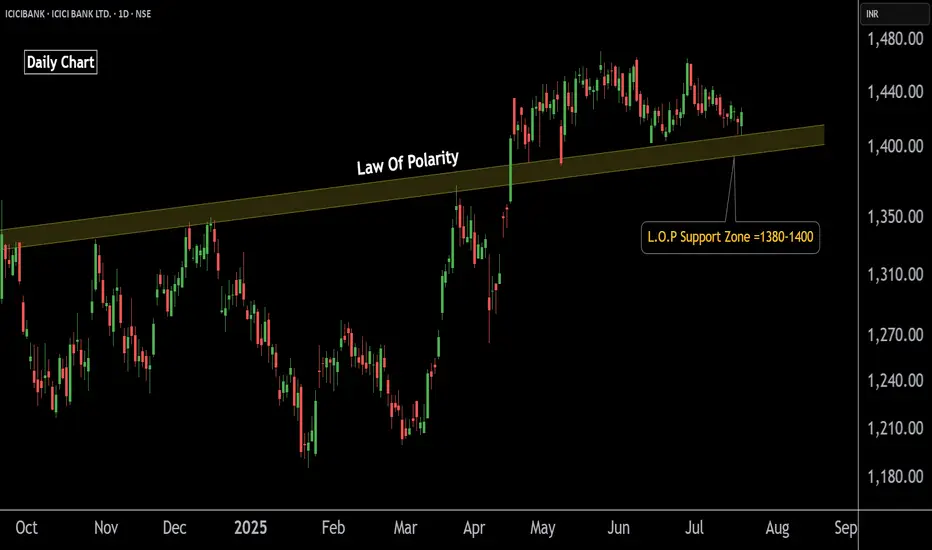
ICICI Bank Poised for Upside – Buy OpportunityThis is the daily chart of ICICIBANK.
ICICIBANK having a good law of polarity at 1380-1400 level .
If this level is sustain then we may see higher prices in ICICIBANK.
Thank You !!
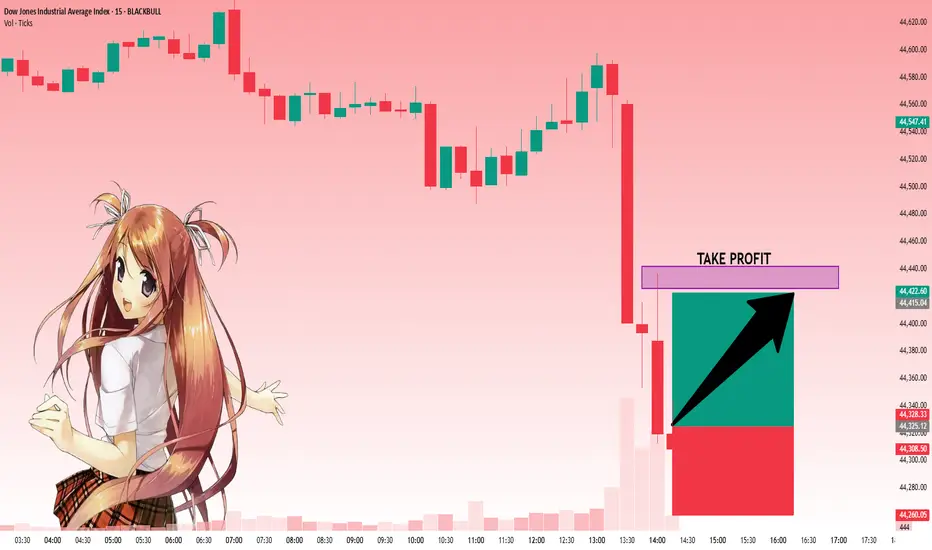
US30: Move Up Expected! Long!
My dear friends,
Today we will analyse US30 together☺️
The price is near a wide key level
and the pair is approaching a significant decision level of 44,325.14 Therefore, a strong bullish reaction here could determine the next move up.We will watch for a confirmation candle, and then target the next key level of 44,425.56.Recommend Stop-loss is beyond the current level.
❤️Sending you lots of Love and Hugs❤️
EURUSD: Bears Are Winning! Short!
My dear friends,
Today we will analyse EURUSD together☺️
The market is at an inflection zone and price has now reached an area around 1.16557 where previous reversals or breakouts have occurred.And a price reaction that we are seeing on multiple timeframes here could signal the next move down so we can enter on confirmation, and target the next key level of 1.16419..Stop-loss is recommended beyond the inflection zone.
❤️Sending you lots of Love and Hugs❤️

AUD-NZD Rebound Expected! Buy!
Hello,Traders!
AUD-NZD is making a retest
Of the horizontal support
Level of 1.0909 and as the
Pair is trading in an uptrend
We will be expecting a
Local bullish rebound
Buy!
Comment and subscribe to help us grow!
Check out other forecasts below too!
Disclosure: I am part of Trade Nation's Influencer program and receive a monthly fee for using their TradingView charts in my analysis.

NZD_USD POTENTIAL SHORT|
✅NZD_USD is going up to retest
A horizontal resistance of 0.5990
Which makes me locally bearish biased
And I think that we will see a pullback
And a move down from the level
Towards the target below at 0.5947
SHORT🔥
✅Like and subscribe to never miss a new idea!✅
Disclosure: I am part of Trade Nation's Influencer program and receive a monthly fee for using their TradingView charts in my analysis.

EURUSD Will Go Down! Short!
Please, check our technical outlook for EURUSD.
Time Frame: 3h
Current Trend: Bearish
Sentiment: Overbought (based on 7-period RSI)
Forecast: Bearish
The price is testing a key resistance 1.161.
Taking into consideration the current market trend & overbought RSI, chances will be high to see a bearish movement to the downside at least to 1.155 level.
P.S
Please, note that an oversold/overbought condition can last for a long time, and therefore being oversold/overbought doesn't mean a price rally will come soon, or at all.
Disclosure: I am part of Trade Nation's Influencer program and receive a monthly fee for using their TradingView charts in my analysis.
Like and subscribe and comment my ideas if you enjoy them!

NZDUSD Will Move Lower! Sell!
Here is our detailed technical review for NZDUSD.
Time Frame: 2h
Current Trend: Bearish
Sentiment: Overbought (based on 7-period RSI)
Forecast: Bearish
The market is trading around a solid horizontal structure 0.594.
The above observations make me that the market will inevitably achieve 0.592 level.
P.S
The term oversold refers to a condition where an asset has traded lower in price and has the potential for a price bounce.
Overbought refers to market scenarios where the instrument is traded considerably higher than its fair value. Overvaluation is caused by market sentiments when there is positive news.
Disclosure: I am part of Trade Nation's Influencer program and receive a monthly fee for using their TradingView charts in my analysis.
Like and subscribe and comment my ideas if you enjoy them!

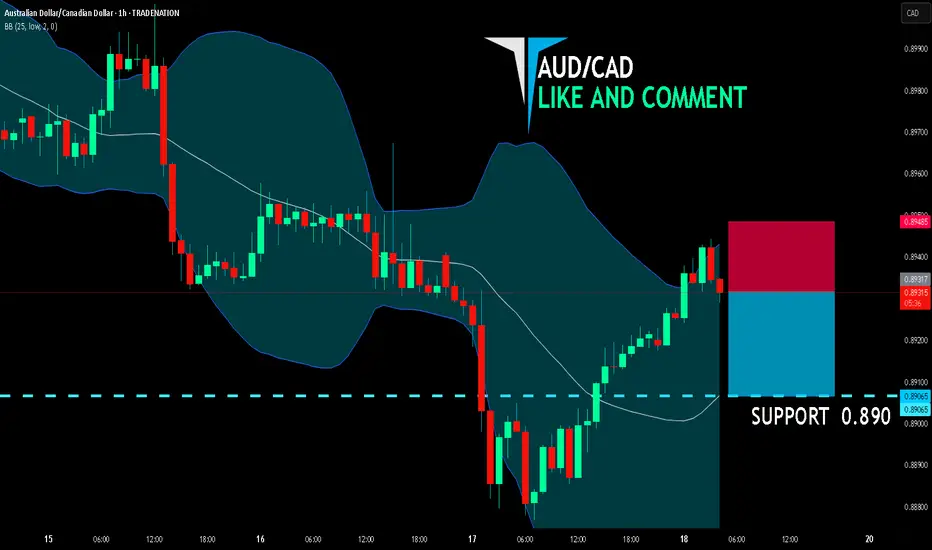
AUD/CAD BEARISH BIAS RIGHT NOW| SHORT
AUD/CAD SIGNAL
Trade Direction: short
Entry Level: 0.893
Target Level: 0.890
Stop Loss: 0.894
RISK PROFILE
Risk level: medium
Suggested risk: 1%
Timeframe: 1h
Disclosure: I am part of Trade Nation's Influencer program and receive a monthly fee for using their TradingView charts in my analysis.
✅LIKE AND COMMENT MY IDEAS✅
EUR-GBP Long From Rising Support! Buy!
Hello,Traders!
EUR-GBP is trading in an
Uptrend along the rising
Support line and the pair
Is going down now so after
The retest we will be
Expecting a bullish rebound
And a move up
Buy!
Comment and subscribe to help us grow!
Check out other forecasts below too!
Disclosure: I am part of Trade Nation's Influencer program and receive a monthly fee for using their TradingView charts in my analysis.

USD_CAD LOCAL SHORT|
✅USD_CAD is going up now
But a strong resistance level is ahead at 1.3800
Thus I am expecting a pullback
And a move down towards the target of 1.3720
SHORT🔥
✅Like and subscribe to never miss a new idea!✅
Disclosure: I am part of Trade Nation's Influencer program and receive a monthly fee for using their TradingView charts in my analysis.
