DXY: Next Move Is Down! Short!
My dear friends,
Today we will analyse DXY together☺️
The market is at an inflection zone and price has now reached an area around 96.362 where previous reversals or breakouts have occurred.And a price reaction that we are seeing on multiple timeframes here could signal the next move down so we can enter on confirmation, and target the next key level of 96.319..Stop-loss is recommended beyond the inflection zone.
❤️Sending you lots of Love and Hugs❤️
Trading

GOLD: Target Is Up! Long!
My dear friends,
Today we will analyse GOLD together☺️
The price is near a wide key level
and the pair is approaching a significant decision level of 3,347.31 Therefore, a strong bullish reaction here could determine the next move up.We will watch for a confirmation candle, and then target the next key level of 3,353,67.Recommend Stop-loss is beyond the current level.
❤️Sending you lots of Love and Hugs❤️

EURUSD: Move Up Expected! Long!
My dear friends,
Today we will analyse EURUSD together☺️
The recent price action suggests a shift in mid-term momentum. A break above the current local range around 1.17930v will confirm the new direction upwards with the target being the next key level of 1.17985 and a reconvened placement of a stop-loss beyond the range.
❤️Sending you lots of Love and Hugs❤️

SILVER: Local Bearish Bias! Short!
My dear friends,
Today we will analyse SILVER together☺️
The in-trend continuation seems likely as the current long-term trend appears to be strong, and price is holding below a key level of 36.897 So a bearish continuation seems plausible, targeting the next low. We should enter on confirmation, and place a stop-loss beyond the recent swing level.
❤️Sending you lots of Love and Hugs❤️

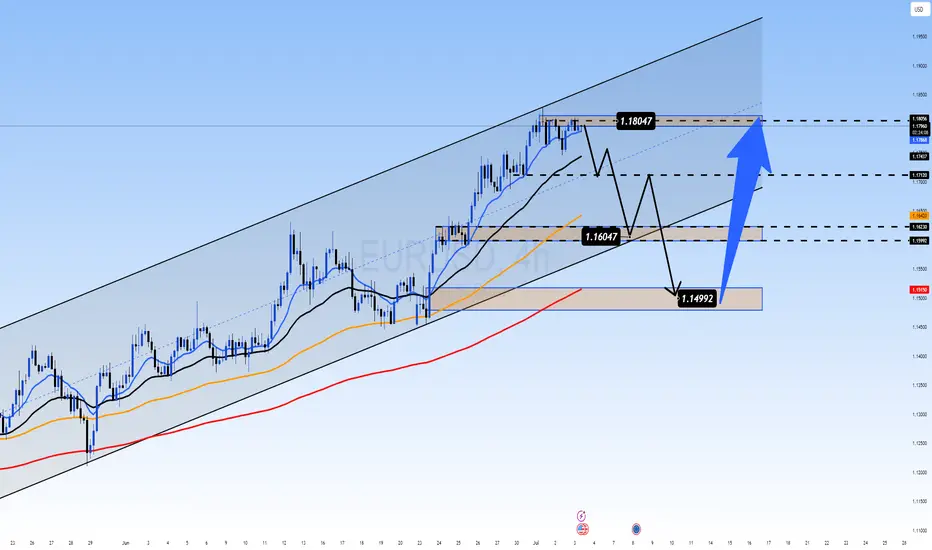
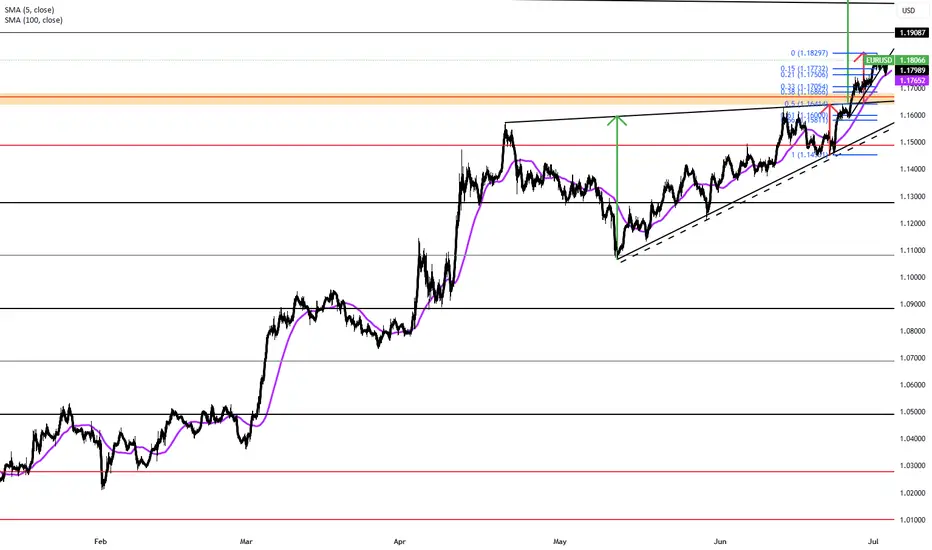
Nearing the Top: A Final Push or Smart Money Liquidity Trap?EUR/USD – Nearing the Top: A Final Push or Smart Money Liquidity Trap?
🌍 MACRO OUTLOOK – EURO CLIMBS WHILE USD TREADS ON UNCERTAIN POLITICAL GROUND:
EUR/USD is trading just below the 1.1700 mark as investors remain cautious about the US dollar's long-term credibility. Growing concerns over the Federal Reserve’s independence — should the “Trump 2.0” scenario unfold — have weighed heavily on USD sentiment across global markets.
Meanwhile, the Euro is gaining support thanks to a relatively hawkish tone from the European Central Bank (ECB). Policymakers appear reluctant to ease policy prematurely, which supports the Euro through expectations of prolonged higher interest rates.
However, with no major catalyst in play yet, traders are watching closely for mid-tier US data and any upcoming statements from ECB officials that might set the tone for the next directional breakout.
📊 TECHNICAL ANALYSIS – H4 TIMEFRAME:
Market Structure: EUR/USD remains in a well-defined ascending price channel. However, the pair is now testing the upper band near the 1.1804 resistance, a key liquidity zone where sellers previously stepped in.
EMA Alignment: Price is trading above the EMA 13/34/89/200 cluster — a strong sign of sustained bullish momentum.
Momentum Indicators:
RSI is hovering near 70 — potential overbought territory.
ADX remains above 25 — confirming trend strength but signaling caution at extended highs.
FVG (Fair Value Gap): A visible unfilled gap between 1.1600 and 1.1640 could act as a magnetic zone for price to revisit before the next impulse move.
🔹 Key Resistance: 1.1804 – 1.1835
🔹 Key Support: 1.1640 – 1.1600 (gap zone)
🔹 Major Demand Zone: 1.1499 – 1.1515
🎯 TRADE PLAN:
Scenario 1 – Buy the Dip (Primary Bias):
Entry: 1.1600 – 1.1640
Stop Loss: 1.1550
Targets: 1.1750 → 1.1800 → 1.1850
Scenario 2 – Buy Deep Pullback:
Entry: 1.1499 – 1.1515
Stop Loss: 1.1450
Targets: 1.1640 → 1.1700
Scenario 3 – Countertrend Sell at Key Resistance (High Risk):
Entry: 1.1804 – 1.1830
Stop Loss: 1.1860
Targets: 1.1720 → 1.1650
📌 Strategic Insight:
EUR/USD may be setting up for either a breakout continuation above 1.1800 or a temporary reversal to sweep liquidity from the lower zones. Momentum favors bulls, but chasing highs without confirmation is risky. Focus on clean retracements and volume-supported entries.
💬 If EUR/USD drops back into the 1.1600 zone, will you load up for another leg higher — or wait for confirmation of trend strength? Share your view in the comments!
Gold Price Analysis July 3GOLD Technical Analysis - D1 Frame
On the D1 frame, the uptrend is still being maintained with momentum towards the price gap zone. During the European session, selling pressure started to appear around the resistance zone of 3365 - showing that this is the area where the sellers are making counter-moves.
On the chart, the gold price is accumulating and forming a triangle pattern, indicating the possibility of a strong movement phase.
If the price breaks the upper border of the triangle (above the 3363 zone), it will likely open up an opportunity to approach the next resistance at 3388.
On the contrary, if it breaks the lower border (below the 3330 zone), the correction trend may be triggered, heading towards deeper support zones.
Important Zones:
Resistance: 3363 – 3388
Support: 3330 – 3311 – 3297 – 3277
Trading Strategy:
BUY Breakout: When price breaks above 3363
SELL Breakout: When price breaks below 3330

Exact Entry Levels & Profit Potential (July 3, 2025)🎯 Market Structure Breakdown – Exact Entry Levels & Profit Potential (July 3, 2025)
📊 In today’s session, I revisit the market for the second time – and you’ll see why I’m ruling out some setups altogether. There’s value in looking twice. What did I miss earlier? It's all in the structure.
I break down price action step by step, highlight precise entry zones, and show where the real potential for movement lies. Clean levels, no guessing.
⚠️ Note: I don’t trade the first 10 seconds – all orders are placed after 9:30:10 and I'm looking for entries only until 11:30:00.
👉 Check out the full breakdown and stay ahead of the game.
NASDAQ:AMZN
NYSE:ANET
NASDAQ:AVGO
NYSE:BA
NASDAQ:COIN
NASDAQ:CZR
NYSE:DELL
NASDAQ:GOOG
NASDAQ:MSFT
NASDAQ:AMD
NASDAQ:RKLB
NASDAQ:SBUX
NASDAQ:SMCI
NYSE:VRT
NASDAQ:NVDA

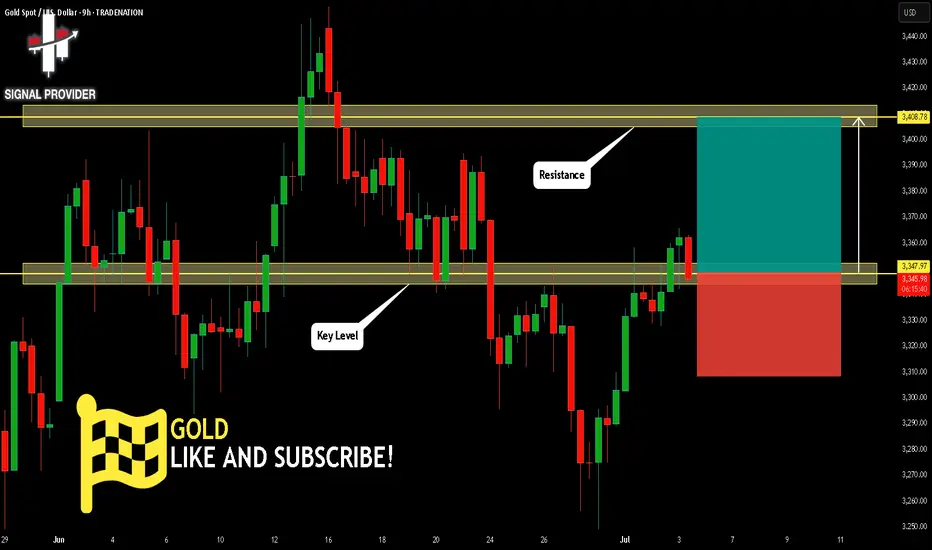
GOLD Will Move Higher! Long!
Here is our detailed technical review for GOLD.
Time Frame: 9h
Current Trend: Bullish
Sentiment: Oversold (based on 7-period RSI)
Forecast: Bullish
The market is approaching a significant support area 3,347.97.
The underlined horizontal cluster clearly indicates a highly probable bullish movement with target 3,408.78 level.
P.S
The term oversold refers to a condition where an asset has traded lower in price and has the potential for a price bounce.
Overbought refers to market scenarios where the instrument is traded considerably higher than its fair value. Overvaluation is caused by market sentiments when there is positive news.
Disclosure: I am part of Trade Nation's Influencer program and receive a monthly fee for using their TradingView charts in my analysis.
Like and subscribe and comment my ideas if you enjoy them!
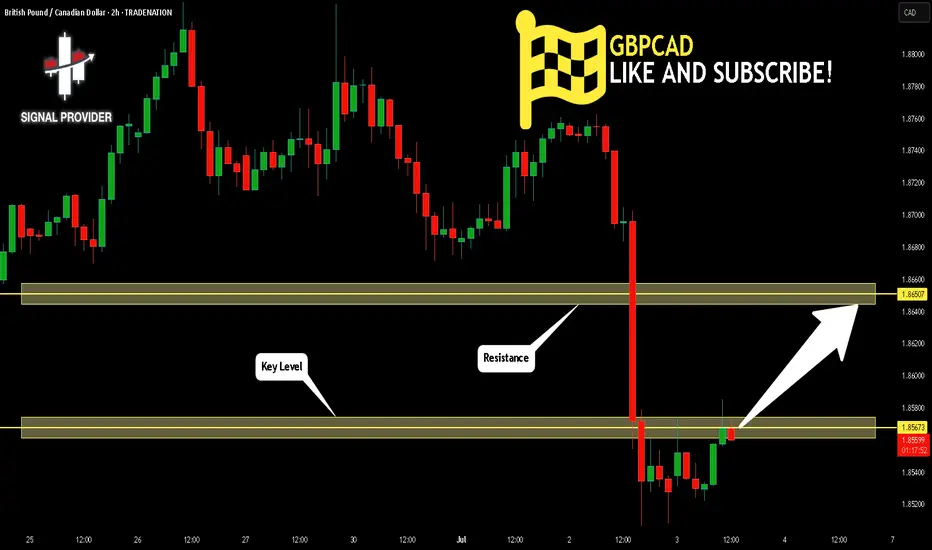
GBPCAD Is Going Up! Long!
Here is our detailed technical review for GBPCAD.
Time Frame: 2h
Current Trend: Bullish
Sentiment: Oversold (based on 7-period RSI)
Forecast: Bullish
The market is trading around a solid horizontal structure 1.856.
The above observations make me that the market will inevitably achieve 1.865 level.
P.S
Please, note that an oversold/overbought condition can last for a long time, and therefore being oversold/overbought doesn't mean a price rally will come soon, or at all.
Disclosure: I am part of Trade Nation's Influencer program and receive a monthly fee for using their TradingView charts in my analysis.
Like and subscribe and comment my ideas if you enjoy them!
USOIL BEARS ARE GAINING STRENGTH|SHORT
USOIL SIGNAL
Trade Direction: short
Entry Level: 66.89
Target Level: 61.90
Stop Loss: 70.21
RISK PROFILE
Risk level: medium
Suggested risk: 1%
Timeframe: 8h
Disclosure: I am part of Trade Nation's Influencer program and receive a monthly fee for using their TradingView charts in my analysis.
✅LIKE AND COMMENT MY IDEAS✅

GBPCAD: Your Trading Plan Explained 🇬🇧🇨🇦
GBPCAD is coiling on an important daily support cluster.
To trade that with a confirmation, pay attention to
an inside bar pattern on a 4H.
1.8579 is the level of an upper boundary of its range.
Its breakout and a 4H candle close above will provide
a strong bullish signal.
A bullish movement will be expected to 1.865 level then.
❤️Please, support my work with like, thank you!❤️
I am part of Trade Nation's Influencer program and receive a monthly fee for using their TradingView charts in my analysis.

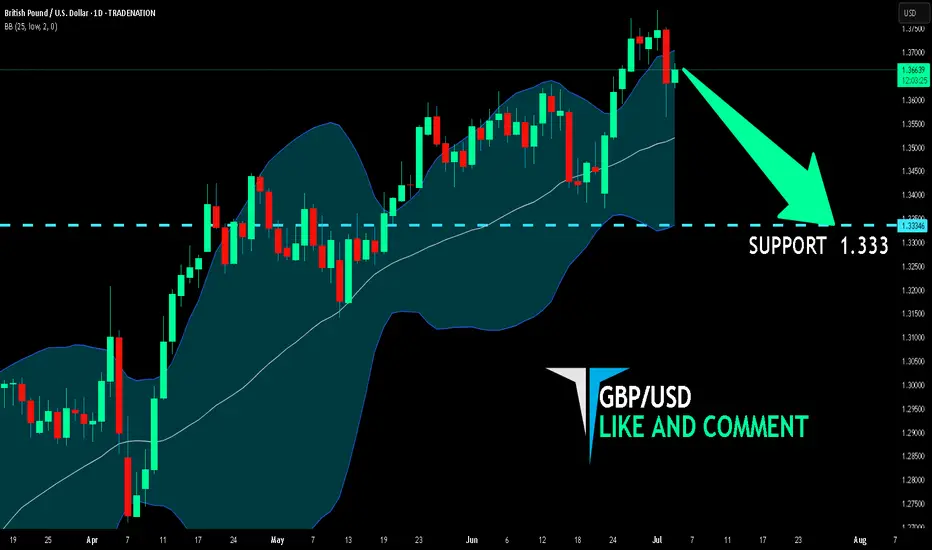
GBP/USD BEARISH BIAS RIGHT NOW| SHORT
Hello, Friends!
GBP/USD pair is in the downtrend because previous week’s candle is red, while the price is obviously rising on the 1D timeframe. And after the retest of the resistance line above I believe we will see a move down towards the target below at 1.333 because the pair is overbought due to its proximity to the upper BB band and a bearish correction is likely.
Disclosure: I am part of Trade Nation's Influencer program and receive a monthly fee for using their TradingView charts in my analysis.
✅LIKE AND COMMENT MY IDEAS✅
USDJPY; Heikin Ashi Trade IdeaOANDA:USDJPY
In this video, I’ll be sharing my analysis of USDJPY, using FXAN's proprietary algo indicators with my unique Heikin Ashi strategy. I’ll walk you through the reasoning behind my trade setup and highlight key areas where I’m anticipating potential opportunities.
I’m always happy to receive any feedback.
Like, share and comment! ❤️
Thank you for watching my videos! 🙏

EUR/USD Steady Near 1.1800 as Fed Cut Bets RiseEUR/USD held steady for a second session near 1.1800 in early Thursday trading. The pair could gain momentum as the US dollar weakens on rising expectations of a Fed rate cut after ADP data disappointed.
June’s ADP Employment Change showed a surprise 33,000 drop, its first decline in over two years, well below forecasts of 95,000. May’s figure was also revised down to a 29,000 gain.
Attention now turns to the upcoming US Nonfarm Payrolls, Average Hourly Earnings, ISM Services PMI, and S&P Global US PMI.
Key levels: Resistance at 1.1830; support at 1.1730.
CRUDE OIL (WTI): Consolidation is Over
Crude Oil was consolidating for 6 trading days in a row
after a test of a key daily support.
The yesterday's Crude Oil Inventories data made the market bullish
and the price successfully violated a minor resistance of a sideways movement.
We can expect that the market will grow more.
Next resistance - 69.27
❤️Please, support my work with like, thank you!❤️

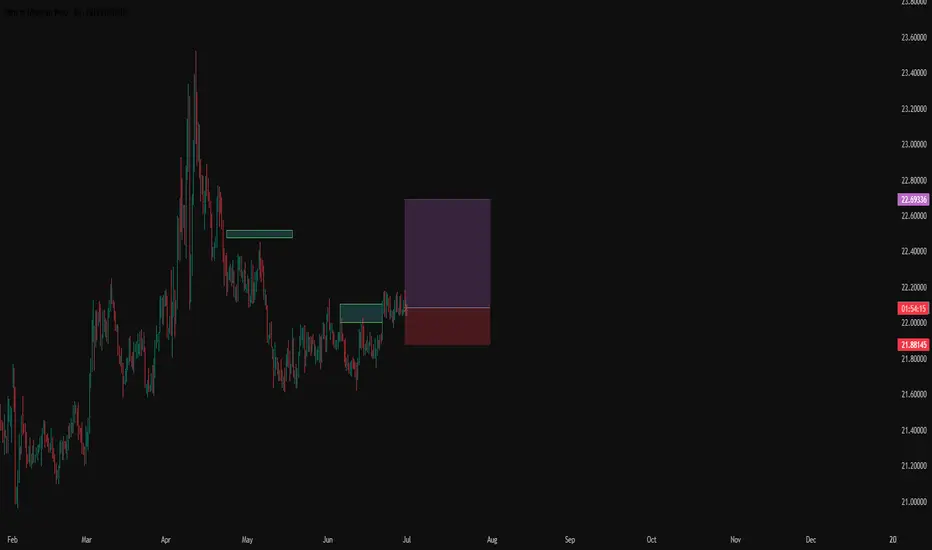
#007: LONG EUR/MXN Investment OpportunityHi, I'm Andrea Russo and today I want to talk to you about this long investment opportunity on EUR/MXN.
After a careful analysis of institutional flows, market sentiment and macroeconomic dynamics between Europe and Mexico, I have identified a potential medium-term long opportunity on this currency pair, often overlooked by retail traders but closely followed by professional operators for its hybrid technical-fundamental structure. I would like to thank in advance the Official Partner Broker PEPPERSTONE who supported us in creating this technical analysis.
🔍 Technical and strategic context
In recent days, EUR/MXN has shown typical institutional accumulation behavior: prolonged congestion on key levels, progressive decrease in volatility, increase in volume anomalies on bearish spikes and presence of clear defenses on strategic support areas.
All this while retail positioning remains strongly unbalanced short, with over 75% of retail operators selling this pair in the current area. Historically, when such extreme levels of imbalance are reached, the likelihood of an institutional-driven reversal increases significantly.
🧠 Expected Behavior and Institutional Dynamics
Large financial institutions – including global banks and hedge funds – never enter “on cue”: they enter when the market is ready for them to win. This often happens after retail has positioned itself heavily against the upcoming move, and that is exactly what we are seeing these hours.
EUR/MXN is a high-yielding pair: the Mexican peso often benefits from favorable carry trades, but is also highly exposed to geopolitical tensions (such as the current US-Iran turmoil) and the overall direction of the US dollar and the euro. In this environment, with a stable euro and rising systemic risk, the natural flow tends to move away from the Mexican peso, making long EUR/MXN particularly attractive.
🎯 Operational positioning and objectives
My entry occurred on a well-defined compression zone, with a protected technical stop loss and a target calculated on structure, volumes and previous similar breakouts. The target is an area around 22.73, where institutional profit taking is likely to arrive.
It should be noted that the entire current structure is built on protection zones generated by passive orders: we know that in EUR/MXN these levels have historically caused strong rebounds when reached.
📊 Conclusion
This trade is not simply a directional bet. It is the thoughtful execution of a model based on the behavior of large operators, market psychology and advanced analysis of capital flows. It is not about "predicting the future", but positioning yourself at the same time as the strong hands do, exploiting their own rules.
My goal is to operate like a hedge fund does, and in this trade on EUR/MXN I see all the conditions for this to happen.
Sell to Buy ModelTho the sell hit sl but still went according to plan. Still Bullish and holding this buy for NFP happening tomorrow

EUR_GBP BULLISH BIAS|LONG|
✅EUR_GBP broke the key
Structure level of 0.8620
While trading in an local uptrend
Which makes me bullish
And I think that after the retest
Of the broken level is complete
A rebound and bullish continuation will follow
LONG🚀
✅Like and subscribe to never miss a new idea!✅
Disclosure: I am part of Trade Nation's Influencer program and receive a monthly fee for using their TradingView charts in my analysis.

AUD-USD Very Strong Uptrend! Buy!
Hello,Traders!
AUD-USD is trading in a
Very strong uptrend and
The pair broke a key horizontal
Level around 0.6540 which
Is now a support and we
Are already seeing a rebound
So we are bullish biased
And we will be expecting
A further move up
Buy!
Comment and subscribe to help us grow!
Check out other forecasts below too!
Disclosure: I am part of Trade Nation's Influencer program and receive a monthly fee for using their TradingView charts in my analysis.

Nightly $SPY / $SPX Scenarios for July 3, 2025🔮 Nightly AMEX:SPY / SP:SPX Scenarios for July 3, 2025 🔮
🌍 Market-Moving News 🌍
📉 U.S. Private Payrolls Surround Weakness
The ADP report showed a drop of 33,000 private-sector jobs in June, the first decline in over two years, reflecting businesses holding back hiring amid trade uncertainty. However, layoffs remain low, signaling no acute stress yet
📊 Markets Braced for NFP Caution
Markets are wary ahead of this morning’s Non‑Farm Payroll (NFP) release—currently projected at +115,000 jobs and 4.3% unemployment—based on indications of labor-market cooling from weak ADP numbers
💵 Canadian Dollar Strengthens
The loonie jumped 0.4% as investors adjust expectations for broader central-bank dovishness, driven by the weak U.S. jobs signals and optimism over a revived U.S.–Canada trade dialogue
📊 Key Data Releases 📊
📅 Thursday, July 3:
8:30 AM ET – Non‑Farm Payrolls (June):
Forecast: +115,000; Previous: +139,000 (May). Watching for signs of sustained job-growth slowdown.
8:30 AM ET – Unemployment Rate:
Forecast: 4.3%, up from 4.2% in May. A rise may increase odds of rate cuts.
8:30 AM ET – Average Hourly Earnings (MoM):
Forecast: +0.3%; prior: +0.4%. Cooling wages would ease inflation pressures.
8:30 AM ET – Initial & Continuing Jobless Claims:
Track week-to-week stability or worsening of labor-market conditions.
9:45 AM ET – Services PMI (June, flash):
Monitor for signs of slowing in U.S. service-sector activity.
10:00 AM ET – ISM Non-Manufacturing PMI (June, flash):
Forecast: 50.8. A reading below 50 suggests contraction in services.
⚠️ Disclaimer:
For informational and educational purposes only. It does not constitute financial advice. Consult a licensed financial advisor before making investment decisions.
📌 #trading #stockmarket #economy #jobs #Fed #labor #technicalanalysis

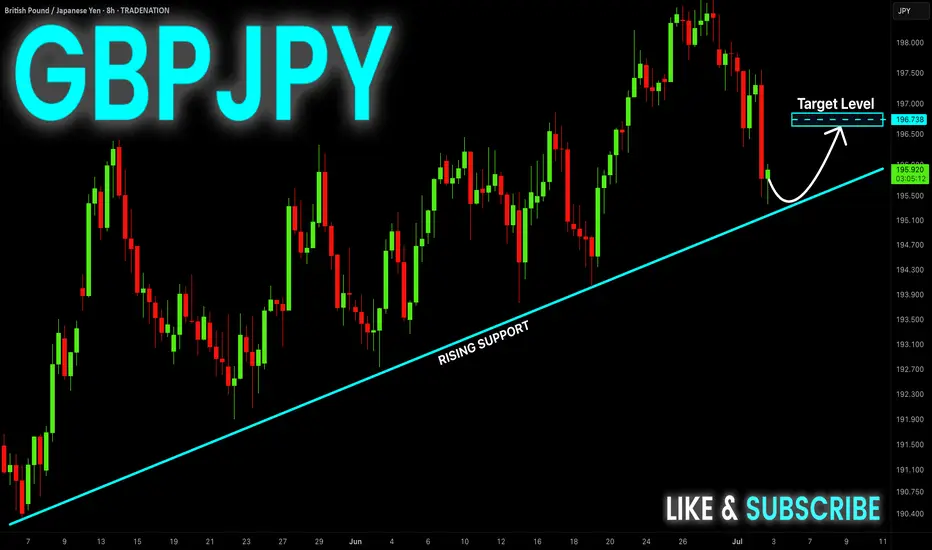
GBP-JPY Correction Ahead! Buy!
Hello,Traders!
GBP-JPY will soon make
A retest of the rising support
Line and as we are bullish
Biased we will be expecting
A local bullish correction
Buy!
Comment and subscribe to help us grow!
Check out other forecasts below too!
Disclosure: I am part of Trade Nation's Influencer program and receive a monthly fee for using their TradingView charts in my analysis.
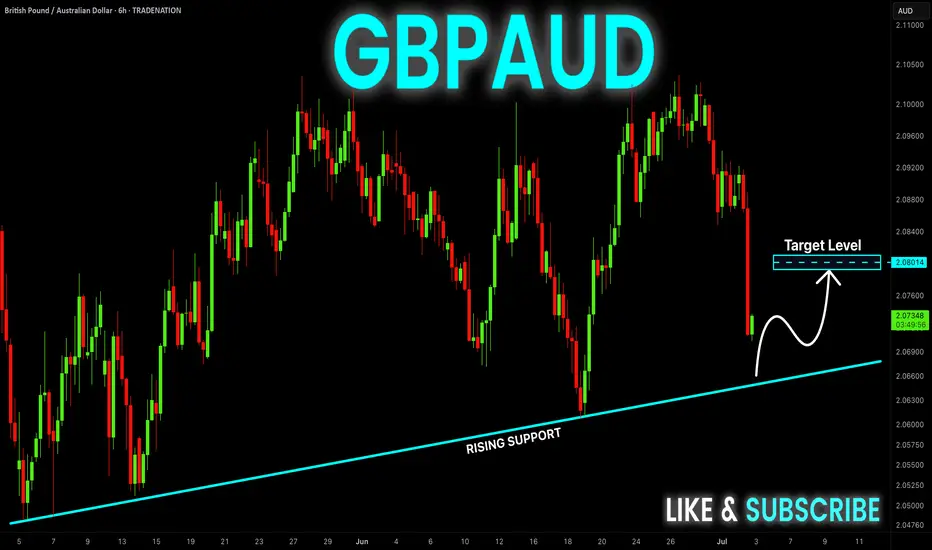
GBP-AUD Rising Support Ahead! Buy!
Hello,Traders!
GBP-AUD made a sharp
And sudden move down
And the pair is oversold
So after it retest the rising
Support line we will be
Expecting a local bullish
Correction and a move up
Buy!
Comment and subscribe to help us grow!
Check out other forecasts below too!
Disclosure: I am part of Trade Nation's Influencer program and receive a monthly fee for using their TradingView charts in my analysis.
$AMSC - Small Cap Semi with 100% Upside!NASDAQ:AMSC - Could be the next $NVTS...👀
✅ Cup&Handle breakout
✅ Bullish H5 Indictor
✅ Bullish Flow
✅ Volume shelf launch
Only a 1.7B Market cap too! 😱
