EURUSD: Will Go Down! Short!
My dear friends,
Today we will analyse EURUSD together☺️
The recent price action suggests a shift in mid-term momentum. A break below the current local range around 1.17225 will confirm the new direction downwards with the target being the next key level of 1.17114.and a reconvened placement of a stop-loss beyond the range.
❤️Sending you lots of Love and Hugs❤️
Trading

GOLD: The Market Is Looking Down! Short!
My dear friends,
Today we will analyse GOLD together☺️
The in-trend continuation seems likely as the current long-term trend appears to be strong, and price is holding below a key level of 3,295.36 So a bearish continuation seems plausible, targeting the next low. We should enter on confirmation, and place a stop-loss beyond the recent swing level.
❤️Sending you lots of Love and Hugs❤️

NATURAL GAS (NATGASUSD): Bullish Outlook Explained
Natural Gas is trading in a mid-term bullish trend on a daily.
The price updates higher highs and higher lows after each
test of a rising support line.
Its last test made the market form a strong rejection first
and a bullish engulfing candle then.
The market may continue growing and reach at least 3.7 resistance soon.
❤️Please, support my work with like, thank you!❤️

GBP/CAD (Two Trade Recaps) EUR/NZD Long and GBP/JPY LongEUR/NZD Long
Minimum entry requirements:
- If tight non-structured 15 min continuation forms, 5 min risk entry within it if the continuation is structured on the 5 min chart or reduced risk entry on the break of it.
- If tight structured 15 min continuation forms, reduced risk entry on the break of it or 15 min risk entry within it.
- If tight non-structured 1H continuation forms, 15 min risk entry within it if the continuation is structured on the 15 min chart or reduced risk entry on the break of it.
- If tight structured 1H continuation forms, 1H risk entry within it or reduced risk entry on the break of it.
GBP/JPY Long
Minimum entry requirements:
- Tap into area of value.
- 1H impulse up above area of value.
- If tight non-structured 15 min continuation follows, 5 min risk entry within it if the continuation is structured on the 5 min chart or reduced risk entry on the break of it.
- If tight structured 15 min continuation follows, reduced risk entry on the break of it or 15 min risk entry within it.

MarketBreakdown | EURUSD, GBPUSD, USDJPY, USDCHF
Here are the updates & outlook for multiple instruments in my watch list.
1️⃣ #EURUSD weekly time frame 🇪🇺🇺🇸
The pair is unstoppable.
The market violated a significant weekly resistance cluster last week.
It opens more growth potential after a pullback.
2️⃣ #GBPUSD weekly time frame 🇬🇧🇺🇸
In comparison to EURUSD, GBPUSD is now approaching a major
resistance area. I think that we can expect a retracement from that.
3️⃣ #USDJPY daily time frame 🇺🇸🇯🇵
The market continues a correctional movement lower.
The closest strong support that I see is based on a rising trend line.
I think that buying interest may spark again after its text.
4️⃣ #USDCHF daily time frame 🇺🇸🇨🇭
The price updated a historic low on Friday.
The next strong support that I see is based on a falling trend line.
We can expect a pullback from that.
Do you agree with my market breakdown?
❤️Please, support my work with like, thank you!❤️
I am part of Trade Nation's Influencer program and receive a monthly fee for using their TradingView charts in my analysis.

S&P500 INDEX (US500): New ATH & More Growth
S&P500 index updated the all-time high on Friday.
The market successfully broke and closed above an underlined resistance.
More growth is coming and the index is going to reach 6280 level soon.
❤️Please, support my work with like, thank you!❤️

30/06 WILL WE SEE A RECOVERY ON THE LAST DAY OF THE MONTH? ↗️GOLD PLAN – 30/06: WILL WE SEE A RECOVERY ON THE LAST DAY OF THE MONTH? ☄️
✅ Macro Context – Focus on USD Debt and Political Pressure
Today marks the final trading day of June, and the U.S. faces a $6 trillion debt maturity from Covid-era borrowings, which may impact USD liquidity and market sentiment.
During the Asian session, gold experienced a sharp drop to the 32xx area before bouncing back and is now hovering near last week's close.
While the medium-term structure remains bearish, short-term signals suggest a potential reversal and recovery.
✅Political Catalyst:
→ Trump is pressuring the Federal Reserve to cut interest rates to 1%-2%, stating he won’t appoint anyone unwilling to ease policy.
→ This raises expectations of future rate cuts, which could support gold prices in the near term.
✅ Technical Outlook – Multi-timeframe Structure
On the higher timeframes, gold continues to correct lower.
However, short-term candles are showing recovery momentum, with buyers absorbing around the 327x zone.
Today’s strategy: prioritize short-term BUY setups aligned with the recovery wave.
✔️Key Resistance & Support Levels
🔺Resistance: 3283 – 3291 – 3301 – 3322
🔻Support: 3277 – 3271 – 3259 – 3247
🔖Trade Scenarios
✅Buy Scalping
🔺Entry: 3272 – 3274
🔹SL: 3268
✔️TP: 3282 – 3288 – 3298
✅Buy Zone
🔺Entry: 3249 – 3251
🔹SL: 3244
✔️TP: 3265 – 3282 – 3295 – 3310
💠Sell Scalping
🔺Entry: 3298 – 3300
🔹SL: 3304
✔️TP: 3292 – 3282 – 3270
💠Sell Zone
🔺Entry: 3327 – 3329
🔹SL: 3333
✔️TP: 3322 – 3310 – 3298 – 3282
⚡️ Final Note
As this is the month-end session, expect possible volatility driven by USD flows and institutional rebalancing.

Weekly $SPY / $SPX Scenarios for June 30 – July 3, 2025🔮 Weekly AMEX:SPY / SP:SPX Scenarios for June 30 – July 3, 2025 🔮
🌍 Market-Moving News 🌍
📈 US Stocks Rally to Record Highs
Following a volatile first half, U.S. equities surged into record territory in late June on a combination of easing Middle East tensions, cooling inflation data, and the 90-day tariff pause
💵 Dollar Weakens on Fed and Trade Uncertainty
The U.S. dollar fell to a 3½-year low, pressured by persistent speculations over President Trump replacing Fed Chair Powell and extending rate-cut expectations, as well as progress in U.S.-Canada trade talks
🇨🇦 U.S.–Canada Trade Talks Lift Sentiment
Canada temporarily repealed its digital services tax to facilitate talks seeking a broader trade agreement by July 21, boosting U.S. equity futures
🛢️ Oil Prices Stabilize
After spiking on geopolitical fears, oil traders settled between $65–78/bbl amid supply relief following ceasefire developments and easing Middle East risks
⚠️ July Risks Loom
The coming week will spotlight:
July 4 deadline for Trump’s tax bill
Expiry of the tariff pause on July 9
U.S. Nonfarm Payrolls on July 3
Each poses potential for increased volatility if outcomes disappoint
📊 Key Data Releases & Events 📊
📅 Monday, June 30
9:45 AM ET – Chicago PMI (June): Gauge of Midwestern factory activity
📅 Tuesday, July 1
U.S. markets open, watch trade developments
📅 Wednesday, July 2
Global PMI readings released
📅 Thursday, July 3 (Early close ahead of Independence Day)
8:30 AM ET – Nonfarm Payrolls (June)
8:30 AM ET – Unemployment Rate (June)
8:30 AM ET – Average Hourly Earnings (June)
These labor metrics will be critical for Fed rate outlooking
⚠️ Disclaimer:
This information is for educational and informational purposes only and should not be construed as financial advice. Always consult a licensed financial advisor before making investment decisions.
📌 #trading #stockmarket #economy #jobs #Fed #oil #trade #technicalanalysis

XAUUSD 4hour TF - June 29th, 2025XAUUSD 4hour Neutral Idea
Monthly - Bullish
Weekly - Bullish
Daily - Bullish
4hour - Bearish
Gold has been on the rally of a century for a while and isn’t showing too many signs of slowing down long term. For now we do have a couple opportunities I can bring to your attention.
4hour bearish continuation - For this to happen we would like to see price action come back to our pocket of confluence near the 3,320.000 level followed by bearish conviction. If this happens look to target lower toward major support levels like 3,225.500.
4hour trend reversal - If we are to see a reversal of the 4hour trend we would need to see price action pop back above the 3,320.000 resistance area. Look for strong bullish conviction above this level and target higher toward appropriate levels of resistance.

EURJPY 4hour TF - June 29th, 2025EURJPY 4hour Bullish Idea
Monthly - Bullish
Weekly - Bullish
Daily - Bullish
4hour - Bullish
EJ has been in a bullish trend on all timeframes and doesn’t really show any signs of stopping. Currently we are right near major monthly resistance around 171.000. It is likely we will see price action push into this zone but we want to identify a potential trade beforehand.
Here are two potential scenarios for this week on EJ
Bullish Continuation - We are a bit close to the 171.000 monthly zone so we would like to see price action come back to our 168.500 4hour support zone before targeting higher.
Trend Reversal - If we see price action fall below 168.500 we want to see bearish conviction and rejection from that same zone. If this happens we can start to consider short scenarios and target lower support levels like 166.250.

EUR_AUD LOCAL SHORT|
✅EUR_AUD is going up now
But a strong resistance level is ahead at 1.8018
Thus I am expecting a pullback
And a move down towards the target of 1.7900
SHORT🔥
✅Like and subscribe to never miss a new idea!✅
Disclosure: I am part of Trade Nation's Influencer program and receive a monthly fee for using their TradingView charts in my analysis.

USDJPY Daily TF - June 29th, 2025USDJPY Daily Neutral Idea
Monthly - Bullish
Weekly - Bearish
Daily - Bearish
I’m looking at the Daily time frame here as this is the only clear picture for price action in terms of trends. The 4hour looks like price action can’t make a decision so we will wait for price action to get closer to some major zones.
Bearish Continuation - Ideally, we want to see price action touch 147.500 again followed by convincing bearish rejection. Look to target lower toward major support levels if this happens.
Aside from this potential setup we don’t have much to look at here on UJ.

AUDJPY 4hour TF - June 29th, 2025AUDJPY 4hour Neutral Idea
Monthly - Bullish
Weekly - Bearish
Dailly - Bearish
4hour - Ranging
AJ is currently sitting at a major daily resistance area around 94.500. We have to wait for price action to make a move and show some conviction before we can become confident in a setup.
Lucky us, price action is usually easy to follow when waiting for a break of a range. The way I see it, we have two great options.
Bullish Breakout - In the scenario where we see price action break above the 94.500 zone we will look for long setups. Ideally, we spot some clear higher lows above 94.500 with strong bullish conviction. Look to target higher resistance levels like 96.500.
Bearish Continuation - If we see this resistance level at 94.500 continue to hold we could see a daily bearish continuation happen. Look for strong bearish candles rejecting the current zone followed by clear lower highs. We’re targeting lower if that happens to around the 92.000 area.

AUDUSD 4hour TF - June 29th, 2025AUDUSD 4hour Neutral idea
Monthly - Bearish
Weekly - Bearish
Dailly - Bullish
4hour - Bullish
AU has been in this subtle bullish channel since late April 2025, just above major monthly support at 0.63250 area.
We also have some conflicting trends and we need to see some conviction before we can comfortably follow price action. We do have some alignment with a bearish USD but at the moment we have two options:
Bullish Continuation - This is the most likely scenario based on what we’re seeing and where price action is. Ideally, we see some rejection from our 4hour 0.65000 support area followed by bullish conviction. If this happens look for price action to touch or break the top of this channel and continue bullish for the week ahead.
Reversal back into channel - If we fail to see bullish presence we could see price action fall back into the channel. The key indication of this would be a break below our 0.65000 support area followed by a retest and bearish conviction.

DXY 4hour TF - June 29th, 2025DXY 6/29/25
DXY Bearish Idea
All significant timeframes (monthly,weekly,daily 4hr) appear bearish for now.
Last week on June 25th, 2025 we saw price action break through our 98.000 zone confirming more bearish movement. This week we have two likely options that we will wait for confirmation on.
Bearish Continuation - Ideally we keep with the trend and look for lower highs below 98.000 for further confirmation. If we can spot rejection from this zone it is likely we will see DXY continue bearish for the week ahead.
Reversal - This is less likely but still possible. Price action could punch back through the 98.000 resistance and begin retesting previous highs. If this happens look for candlestick confirmation above 98.000 and expect a more bullish DXY for the week ahead.

ETHUSD: Strong Bearish Sentiment! Short!
My dear friends,
Today we will analyse ETHUSD together☺️
The market is at an inflection zone and price has now reached an area around 2,437.2 where previous reversals or breakouts have occurred.And a price reaction that we are seeing on multiple timeframes here could signal the next move down so we can enter on confirmation, and target the next key level of 2,426.5..Stop-loss is recommended beyond the inflection zone.
❤️Sending you lots of Love and Hugs❤️

BTCUSD: Bulls Are Winning! Long!
My dear friends,
Today we will analyse BTCUSD together☺️
The price is near a wide key level
and the pair is approaching a significant decision level of 107,630.73 Therefore, a strong bullish reaction here could determine the next move up.We will watch for a confirmation candle, and then target the next key level of 108,207.06.Recommend Stop-loss is beyond the current level.
❤️Sending you lots of Love and Hugs❤️

SPY Technical Analysis! SELL!
My dear followers,
I analysed this chart on SPY and concluded the following:
The market is trading on 614.85 pivot level.
Bias - Bearish
Technical Indicators: Both Super Trend & Pivot HL indicate a highly probable Bearish continuation.
Target - 586.37
Safe Stop Loss - 631.68
About Used Indicators:
A super-trend indicator is plotted on either above or below the closing price to signal a buy or sell. The indicator changes color, based on whether or not you should be buying. If the super-trend indicator moves below the closing price, the indicator turns green, and it signals an entry point or points to buy.
Disclosure: I am part of Trade Nation's Influencer program and receive a monthly fee for using their TradingView charts in my analysis.
———————————
WISH YOU ALL LUCK

USOIL The Target Is UP! BUY!
My dear friends,
USOIL looks like it will make a good move, and here are the details:
The market is trading on 65.03 pivot level.
Bias - Bullish
Technical Indicators: Supper Trend generates a clear long) signal while Pivot Point HL is currently determining the overall Bullish trend of the market.
Goal - 68.89
Recommended Stop Loss - 63.01
About Used Indicators:
Pivot points are a great way to identify areas of support and resistance, but they work best when combined with other kinds of technical analysis
Disclosure: I am part of Trade Nation's Influencer program and receive a monthly fee for using their TradingView charts in my analysis.
———————————
WISH YOU ALL LUCK

SILVER Sellers In Panic! BUY!
My dear friends,
Please, find my technical outlook for SILVER below:
The price is coiling around a solid key level - 35.993
Bias -Bullish
Technical Indicators: Pivot Points Low anticipates a potential price reversal.
Super trend shows a clear buy, giving a perfect indicators' convergence.
Goal - 36.378
About Used Indicators:
The pivot point itself is simply the average of the high, low and closing prices from the previous trading day.
Disclosure: I am part of Trade Nation's Influencer program and receive a monthly fee for using their TradingView charts in my analysis.
———————————
WISH YOU ALL LUCK

GOLD WEEKLY CHART MID/LONG TERM ROUTE MAPHey Everyone,
Follow up on our Weekly Goldturn channel outlook.
Last week’s action delivered the rejection at the channel top, right in line with expectations. Importantly, we did not get an EMA5 lock confirmation, reinforcing the rejection. We still have the previous weekly candle body close above 3387, leaving the gap at 3482 active and exposed overhead.
The early rejection saw a swift retrace into the 3281 Goldturn axis support, where price is currently attempting to stabilise. This is a pivotal level. From here, we are watching two potential paths unfold:
1. Bounce Scenario: If 3281 holds and buyers step in, we’ll look for a gradual climb within the channel, testing key in between levels. EMA5 cross and lock confirmation will be key for directional bias. A reclaim and continuation higher keeps the 3482 gap firmly in play as a target.
2. Breakdown Scenario: If 3281 gives way, we have a body close gap to the channel mid-line, which becomes the next key level for potential support and Goldturn reaction. A move into this area could offer another structured long opportunity, aligned with the overall bullish framework.
Despite the rejection at the highs, the broader channel structure remains intact, and the longer term outlook still favours a measured move up level by level, using Goldturn levels and EMA5 as our compass.
Key Focus:
Support: 3281 → Channel Half-line (if broken)
Resistance: 3387 → 3482 (gap target)
We remain patient and continue reacting to clean structure backed opportunities.
Mr Gold
GoldViewFX

US500 Will Go Up! Long!
Take a look at our analysis for US500.
Time Frame: 1D
Current Trend: Bullish
Sentiment: Oversold (based on 7-period RSI)
Forecast: Bullish
The market is testing a major horizontal structure 6,165.52.
Taking into consideration the structure & trend analysis, I believe that the market will reach 6,451.04 level soon.
P.S
The term oversold refers to a condition where an asset has traded lower in price and has the potential for a price bounce.
Overbought refers to market scenarios where the instrument is traded considerably higher than its fair value. Overvaluation is caused by market sentiments when there is positive news.
Disclosure: I am part of Trade Nation's Influencer program and receive a monthly fee for using their TradingView charts in my analysis.
Like and subscribe and comment my ideas if you enjoy them!

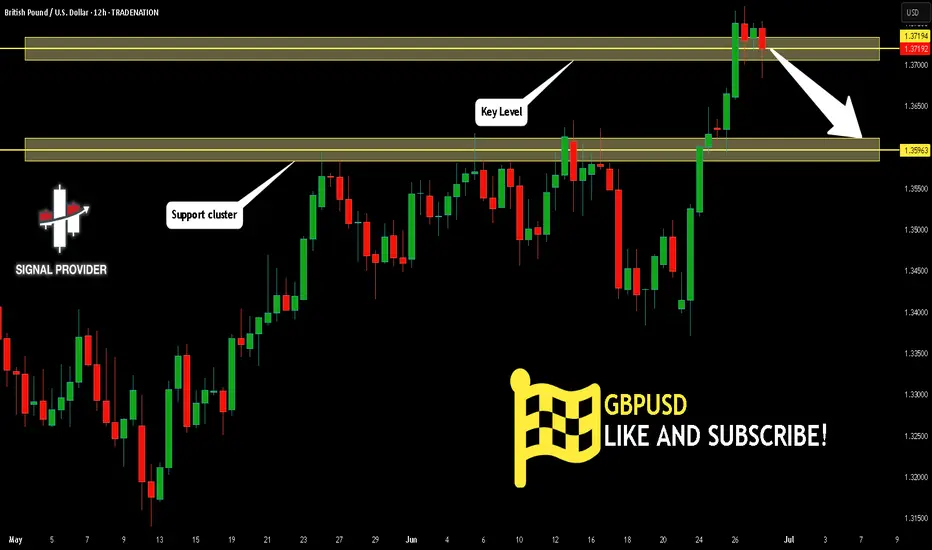
GBPUSD Will Move Lower! Short!
Please, check our technical outlook for GBPUSD.
Time Frame: 12h
Current Trend: Bearish
Sentiment: Overbought (based on 7-period RSI)
Forecast: Bearish
The market is approaching a key horizontal level 1.371.
Considering the today's price action, probabilities will be high to see a movement to 1.359.
P.S
We determine oversold/overbought condition with RSI indicator.
When it drops below 30 - the market is considered to be oversold.
When it bounces above 70 - the market is considered to be overbought.
Disclosure: I am part of Trade Nation's Influencer program and receive a monthly fee for using their TradingView charts in my analysis.
Like and subscribe and comment my ideas if you enjoy them!