NI225: Move Down Expected! Short!
My dear friends,
Today we will analyse NI225 together☺️
The market is at an inflection zone and price has now reached an area around 40,150.79 where previous reversals or breakouts have occurred.And a price reaction that we are seeing on multiple timeframes here could signal the next move down so we can enter on confirmation, and target the next key level of 39,753.50..Stop-loss is recommended beyond the inflection zone.
❤️Sending you lots of Love and Hugs❤️
Trading

EURGBP: Bullish Move Ahead! 🇪🇺🇬🇧
EURGBP violated a consolidation range on Friday.
It is an important sign of strength of the buyers and I expect a bullish continuation
next week.
Goal - 0.856
❤️Please, support my work with like, thank you!❤️
I am part of Trade Nation's Influencer program and receive a monthly fee for using their TradingView charts in my analysis.

XAUUSD D1 Forecast: Gold at Pivotal 325x Support What's Next for the Yellow Metal?
Today, we're zooming out to examine the broader picture for Gold (XAUUSD) on the Daily (D1) timeframe. Our latest analysis indicates that Gold has encountered a very strong, critical support level around the 325x region. This is a pivotal point that could significantly influence Gold's medium to long-term direction!
🌍 Macroeconomic Landscape: The Underlying Forces Influencing Gold
While we've observed a degree of USD weakness stemming from speculations around the Federal Reserve (such as the rumours regarding Jerome Powell's replacement) and expectations of interest rate cuts, these factors haven't fully countered Gold's recent decline on the daily chart. Furthermore, the sustained ceasefire between Israel and Iran continues to temper Gold's appeal as a safe-haven asset.
Nevertheless, the current price action at the robust 325x support level presents a significant technical signal. The impact of forthcoming US macroeconomic data (particularly the PCE Price Index on Friday) and speeches from FOMC members will be crucial in confirming or negating our projected movements for Gold. Should positive news for Gold align with this support holding, it could act as a potent catalyst.
📊 XAUUSD D1 Technical Analysis: Projecting Gold's Next Move
Given that Gold has reached strong support at 325x, we can anticipate the following scenarios:
Bounce from 325x (Potential Upside Phase):
If the 325x area (which reinforces the 3264.400 support from image_e9d325.png) holds firm, we expect a strong reaction and an upward move for Gold.
The initial target for this bounce would be the 332x region, aligning with resistance levels 3313.737 - 3330.483 from our previous analysis. On a broader timeframe (as illustrated in image_83845c.png), this corresponds to the resistance zone around 3326.022. This 332x area might represent a continuation pattern, suggesting it could be a corrective rally before the resumption of the larger trend.
Resumption of Downtrend (After Reaching 332x):
Once Gold reaches and tests the 332x zone (3313.737 - 3330.483 / 3326.022) and exhibits bearish confirmation signals (e.g., a strong bearish engulfing candle, a pin bar, or a clear top formation), we anticipate a resumption of the downward movement.
The next major target for this decline would be the 317x area, which correlates well with the strong support at 3173.052 on the larger timeframe (as depicted in image_83845c.png).
🎯 XAUUSD D1 Trading Plan: Your Long-Term Strategy Ahead!
Considering the current D1 analysis, here's our actionable plan:
1. BUY PHASE (Bounce from Support):
Entry: Observe price reaction in the 325x - 326x zone (specifically 3264.400). Only consider buying if there are clear bullish confirmations (e.g., a confirmed bullish pattern on the daily or 4-hour candle, a strong bounce from the zone with significant volume).
SL (Stop Loss): Position just below the 325x support zone (e.g., 3245-3240, depending on confirmation).
TP (Take Profit): 3280 - 3284 - 3290 - 3295 - 3300 - 3305 - 3310 - 3313.737 - 3320 - 3326.022 (key 332x zone). This will be our primary target for the potential bounce.
2. SELL PHASE (Downtrend Resumption):
Entry: Once the price reaches and tests the 332x zone (3313.737 - 3330.483 / 3326.022) and shows bearish confirmation signals (e.g., a strong bearish engulfing, pin bar, or clear top formation).
SL (Stop Loss): Position slightly above the 332x zone (e.g., 3335-3340).
TP (Take Profit): 3326 - 3320 - 3316 - 3310 - 3305 - 3300 - 3295 - 3290 - 3280 - 3200 - 3173.052 (final 317x target).

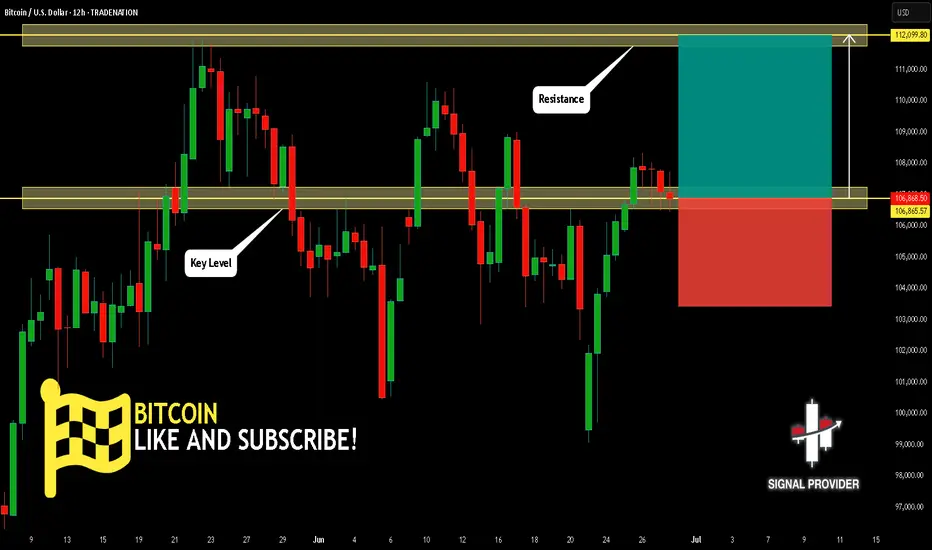
BITCOIN Is Bullish! Buy!
Here is our detailed technical review for BITCOIN.
Time Frame: 12h
Current Trend: Bullish
Sentiment: Oversold (based on 7-period RSI)
Forecast: Bullish
The market is approaching a significant support area 106,865.57.
The underlined horizontal cluster clearly indicates a highly probable bullish movement with target 112,099.80 level.
P.S
Overbought describes a period of time where there has been a significant and consistent upward move in price over a period of time without much pullback.
Disclosure: I am part of Trade Nation's Influencer program and receive a monthly fee for using their TradingView charts in my analysis.
Like and subscribe and comment my ideas if you enjoy them!
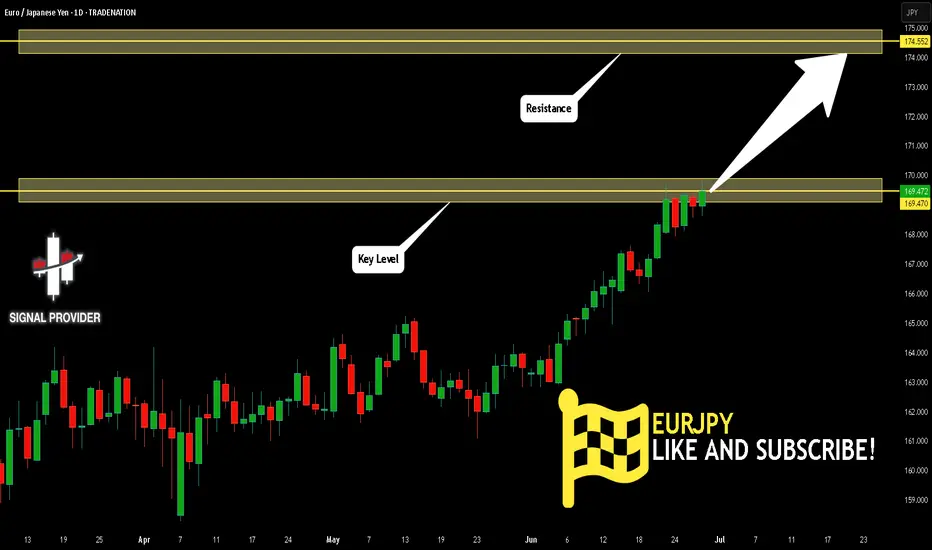
EURJPY Is Very Bullish! Long!
Take a look at our analysis for EURJPY.
Time Frame: 1D
Current Trend: Bullish
Sentiment: Oversold (based on 7-period RSI)
Forecast: Bullish
The market is on a crucial zone of demand 169.470.
The oversold market condition in a combination with key structure gives us a relatively strong bullish signal with goal 174.552 level.
P.S
Please, note that an oversold/overbought condition can last for a long time, and therefore being oversold/overbought doesn't mean a price rally will come soon, or at all.
Disclosure: I am part of Trade Nation's Influencer program and receive a monthly fee for using their TradingView charts in my analysis.
Like and subscribe and comment my ideas if you enjoy them!
GBPCHF Is Going Up! Buy!
Please, check our technical outlook for GBPCHF.
Time Frame: 2h
Current Trend: Bullish
Sentiment: Oversold (based on 7-period RSI)
Forecast: Bullish
The price is testing a key support 1.095.
Current market trend & oversold RSI makes me think that buyers will push the price. I will anticipate a bullish movement at least to 1.098 level.
P.S
The term oversold refers to a condition where an asset has traded lower in price and has the potential for a price bounce.
Overbought refers to market scenarios where the instrument is traded considerably higher than its fair value. Overvaluation is caused by market sentiments when there is positive news.
Disclosure: I am part of Trade Nation's Influencer program and receive a monthly fee for using their TradingView charts in my analysis.
Like and subscribe and comment my ideas if you enjoy them!

US100 BEARISH BIAS RIGHT NOW| SHORT
US100 SIGNAL
Trade Direction: short
Entry Level: 22,518.7
Target Level: 21,870.2
Stop Loss: 22,949.8
RISK PROFILE
Risk level: medium
Suggested risk: 1%
Timeframe: 9h
Disclosure: I am part of Trade Nation's Influencer program and receive a monthly fee for using their TradingView charts in my analysis.
✅LIKE AND COMMENT MY IDEAS✅

EUR/AUD BEST PLACE TO SELL FROM|SHORT
Hello, Friends!
We are going short on the EUR/AUD with the target of 1.772 level, because the pair is overbought and will soon hit the resistance line above. We deduced the overbought condition from the price being near to the upper BB band. However, we should use low risk here because the 1W TF is green and gives us a counter-signal.
Disclosure: I am part of Trade Nation's Influencer program and receive a monthly fee for using their TradingView charts in my analysis.
✅LIKE AND COMMENT MY IDEAS✅

EUR/CAD BEARS ARE STRONG HERE|SHORT
Hello, Friends!
We are now examining the EUR/CAD pair and we can see that the pair is going up locally while also being in a uptrend on the 1W TF. But there is also a powerful signal from the BB upper band being nearby, indicating that the pair is overbought so we can go short from the resistance line above and a target at 1.588 level.
Disclosure: I am part of Trade Nation's Influencer program and receive a monthly fee for using their TradingView charts in my analysis.
✅LIKE AND COMMENT MY IDEAS✅

GBP-CHF Rebound Ahead! Buy!
Hello,Traders!
GBP-CHF is hovering above
The wide horizontal demand
Level around 1.0926 from
Where we are already
Seeing a bullish rebound
So a further local bullish
Move up is to be expected
Buy!
Comment and subscribe to help us grow!
Check out other forecasts below too!
Disclosure: I am part of Trade Nation's Influencer program and receive a monthly fee for using their TradingView charts in my analysis.

AUDNZD The Target Is DOWN! SELL!
My dear followers,
I analysed this chart on AUDNZD and concluded the following:
The market is trading on 1.0803 pivot level.
Bias - Bearish
Technical Indicators: Both Super Trend & Pivot HL indicate a highly probable Bearish continuation.
Target - 1.0792
About Used Indicators:
A super-trend indicator is plotted on either above or below the closing price to signal a buy or sell. The indicator changes color, based on whether or not you should be buying. If the super-trend indicator moves below the closing price, the indicator turns green, and it signals an entry point or points to buy.
Disclosure: I am part of Trade Nation's Influencer program and receive a monthly fee for using their TradingView charts in my analysis.
———————————
WISH YOU ALL LUCK

EURUSD Will Collapse! SELL!
My dear subscribers,
My technical analysis for EURUSD is below:
The price is coiling around a solid key level - 1.1716
Bias - Bearish
Technical Indicators: Pivot Points Low anticipates a potential price reversal.
Super trend shows a clear sell, giving a perfect indicators' convergence.
Goal - 1.1644
About Used Indicators:
By the very nature of the supertrend indicator, it offers firm support and resistance levels for traders to enter and exit trades. Additionally, it also provides signals for setting stop losses
Disclosure: I am part of Trade Nation's Influencer program and receive a monthly fee for using their TradingView charts in my analysis.
———————————
WISH YOU ALL LUCK

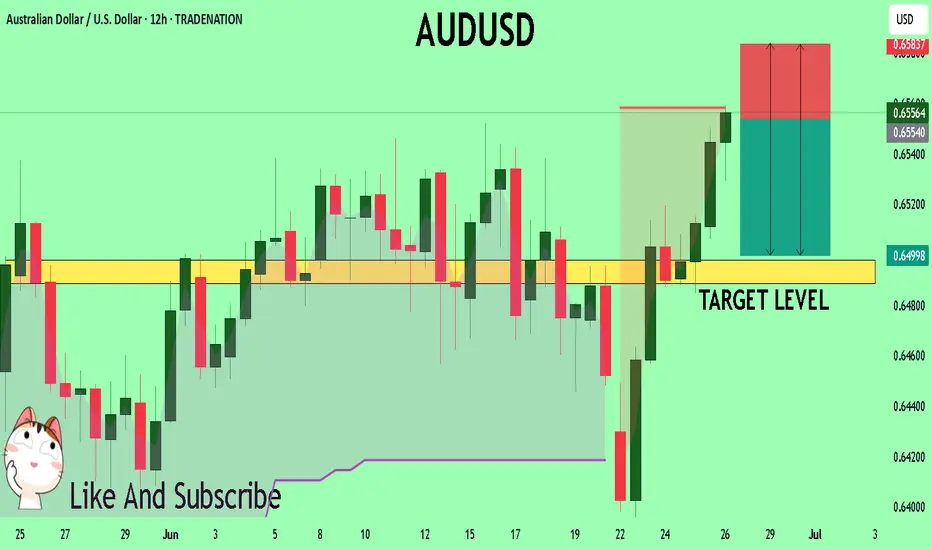
AUDUSD Set To Fall! SELL!
My dear followers,
This is my opinion on the AUDUSD next move:
The asset is approaching an important pivot point 0.6555
Bias - Bearish
Safe Stop Loss - 0.6583
Technical Indicators: Supper Trend generates a clear short signal while Pivot Point HL is currently determining the overall Bearish trend of the market.
Goal - 0.6497
About Used Indicators:
For more efficient signals, super-trend is used in combination with other indicators like Pivot Points.
Disclosure: I am part of Trade Nation's Influencer program and receive a monthly fee for using their TradingView charts in my analysis.
———————————
WISH YOU ALL LUCK
XAUUSD Daily Update: Gold Enters "Strong Bearish MomentumXAUUSD Daily Update: Gold Enters "Strong Bearish Momentum" – Where Are the Opportunities?
Hello TradingView Community!
Hot news from the Gold (XAUUSD) market today! We've just closely analyzed the Daily Chart and spotted a crucial signal: Gold's downward momentum is extremely strong and clear! This indicates that the short-term trend may have shifted, or selling pressure is currently overwhelming other supporting factors.
🌍 Current Macroeconomic Context (A Multi-faceted View):
Previously, we discussed how a weaker USD might support Gold. Indeed, concerns about the Fed's independence (due to rumors of Powell's replacement) and expectations of Fed rate cuts have pushed the USD lower, typically a positive for Gold.
However, the market isn't driven by just one factor. The sustained ceasefire between Israel and Iran is reducing Gold's safe-haven demand. It appears that, at present, factors like decreased safe-haven demand and potentially strong technical breakdowns are prevailing, creating significant selling pressure on the daily timeframe. We also need to emphasize that the market remains very cautious about confirming a bottom for Gold, and we are still awaiting crucial US economic data (especially PCE on Friday) and FOMC speeches.
➡️ In summary: While a weaker USD theoretically supports Gold, the price action on the daily chart clearly shows bears are dominating. We must respect this signal and adjust our strategy accordingly.
📊 XAUUSD Technical Analysis (Focus on Daily Chart - Strong Bearish Momentum!):
Based on the strong bearish signal from the Daily timeframe and key price levels from the chart (image_e9d325.png):
Primary Trend on Daily: Clearly strong bearish momentum. Large, consecutive bearish candles breaking previous support zones indicate overwhelming selling pressure.
Resistance Zones (Potential SELL Opportunities - where price might retrace before falling further):
3313.737 - 3315: This is the nearest and most important resistance area. If the price retraces here, it could present an opportunity to sell.
3321.466 - 3330.483: A stronger resistance zone, if price retraces deeper.
3341.947: Extremely strong resistance, unlikely to be reached in this context unless there's a major trend-reversing news event.
Support Zones (BUY Opportunities - extremely cautious, only for Scalp or clear reversal signals):
3294.414: Immediate support, but could be easily broken if bearish momentum persists.
3276.122: The next support area if the price continues to fall.
3264.400: This is a very strong support and a potential downside target if bearish momentum holds. Consider BUYs here only if price hits this level and shows clear reversal patterns on smaller timeframes.
🎯 Updated XAUUSD Trading Plan (Prioritizing SELLs):
Given the strong bearish momentum on the Daily chart, we will prioritize active SELL entries and approach BUY scalps with extreme caution, only at very strong support levels or with clear reversal confirmations.
1. ACTIVE SELL TRADES (Priority):
SELL ZONE 1 (Selling at near resistance):
Entry: 3313 - 3315 (If price retraces to this area and shows bearish rejection candle patterns on H1/H4)
SL: 3320 (Just above the nearest resistance)
TP: 3310 - 3305 - 3300 - 3295 - 3290 - 3280 - 3276.122 (Next target according to the chart) - 3264.400 (Final target if strong bearish momentum continues)
SELL ZONE 2 (Selling at stronger resistance - if deeper retracement):
Entry: 3331 - 3333 (If price retraces deeper and shows reversal signals)
SL: 3337
TP: 3326 - 3320 - 3316 - 3310 - 3305 - 3300 - 3294.414
2. CAUTIOUS BUY TRADES (Only for Scalp/Clear Reversal Signals):
BUY ZONE (BUY SCALP AT STRONG SUPPORT):
Entry: 3266 - 3264 (Only buy if price hits this zone and shows clear reversal signals on M15/M30, such as reversal candle patterns, RSI divergence, etc.)
SL: 3260 (Very tight, acknowledging higher risk)
TP: 3270 - 3276.122 - 3280 - 3284 - 3290 (Aim for short TPs, no expectation of prolonged uptrend in strong bearish conditions)
INTERMEDIATE BUY SCALP:
Entry: 3284 - 3282 (If price has broken down through here and retraces, wait for confirmation)
SL: 3278
TP: 3288 - 3292 - 3296 - 3300 (Short-term targets only)
⚠️ Crucial Factors to Monitor Closely Today:
Price Action at Resistance/Support Levels: How price reacts at these key marks will dictate the next move.
US Macro Data (especially PCE on Friday): Any surprising news can rapidly reverse the current trend.
FOMC Speeches: Can induce significant volatility in USD and Gold.
Geopolitical Situation: Although currently optimistic, any unexpected developments could reignite safe-haven demand.

US30: Local Bearish Bias! Short!
My dear friends,
Today we will analyse GOLD together☺️
The price is near a wide key level
and the pair is approaching a significant decision level of 43,673.57 Therefore, a strong bearish reaction here could determine the next move down.We will watch for a confirmation candle, and then target the next key level of 43,576.88..Recommend Stop-loss is beyond the current level.
❤️Sending you lots of Love and Hugs❤️

EURUSD: Strong Growth Ahead! Long!
My dear friends,
Today we will analyse EURUSD together☺️
The recent price action suggests a shift in mid-term momentum. A break above the current local range around 1.17284 will confirm the new direction upwards with the target being the next key level of 1.17538 and a reconvened placement of a stop-loss beyond the range.
❤️Sending you lots of Love and Hugs❤️

GOLD: Will Go Up! Long!
My dear friends,
Today we will analyse GOLD together☺️
The in-trend continuation seems likely as the current long-term trend appears to be strong, and price is holding above a key level of 3,274.66 So a bullish continuation seems plausible, targeting the next high. We should enter on confirmation, and place a stop-loss beyond the recent swing level.
❤️Sending you lots of Love and Hugs❤️

AUDNZD On The Rise! BUY!
My dear followers,
This is my opinion on the AUDNZD next move:
The asset is approaching an important pivot point 1.0782
Bias - Bullish
Technical Indicators: Supper Trend generates a clear long signal while Pivot Point HL is currently determining the overall Bullish trend of the market.
Goal - 1.0797
About Used Indicators:
For more efficient signals, super-trend is used in combination with other indicators like Pivot Points.
Disclosure: I am part of Trade Nation's Influencer program and receive a monthly fee for using their TradingView charts in my analysis.
———————————
WISH YOU ALL LUCK

EURCAD My Opinion! SELL!
My dear friends,
Please, find my technical outlook for EURCAD below:
The instrument tests an important psychological level 1.6006
Bias - Bearish
Technical Indicators: Supper Trend gives a precise Bearish signal, while Pivot Point HL predicts price changes and potential reversals in the market.
Target - 1.5978
About Used Indicators:
Super-trend indicator is more useful in trending markets where there are clear uptrends and downtrends in price.
Disclosure: I am part of Trade Nation's Influencer program and receive a monthly fee for using their TradingView charts in my analysis.
———————————
WISH YOU ALL LUCK

SILVER: The Market Is Looking Down! Short!
My dear friends,
Today we will analyse SILVER together☺️
The market is at an inflection zone and price has now reached an area around 35.998 where previous reversals or breakouts have occurred.And a price reaction that we are seeing on multiple timeframes here could signal the next move down so we can enter on confirmation, and target the next key level of 35.727..Stop-loss is recommended beyond the inflection zone.
❤️Sending you lots of Love and Hugs❤️

GOLD Trading Opportunity! BUY!
My dear subscribers,
GOLD looks like it will make a good move, and here are the details:
The market is trading on 3270.6 pivot level.
Bias - Bullish
My Stop Loss - 3260.7
Technical Indicators: Both Super Trend & Pivot HL indicate a highly probable Bullish continuation.
Target - 3289.4
About Used Indicators:
The average true range (ATR) plays an important role in 'Supertrend' as the indicator uses ATR to calculate its value. The ATR indicator signals the degree of price volatility.
Disclosure: I am part of Trade Nation's Influencer program and receive a monthly fee for using their TradingView charts in my analysis.
———————————
WISH YOU ALL LUCK

USD_CHF BEARISH BREAKOUT|SHORT|
✅USD_CHF broke the key structure level of 0.8050
While trading in a strong downtrend
Which makes me bearish
And I think that after the retest of the broken level is complete
A bearish continuation will follow
SHORT🔥
✅Like and subscribe to never miss a new idea!✅
Disclosure: I am part of Trade Nation's Influencer program and receive a monthly fee for using their TradingView charts in my analysis.

DOW JONES Will Keep Growing! Buy!
Hello,Traders!
US30 is trading in an
Uptrend and the index broke
The key horizontal level
Around 43,200 and the
Breakout is confirmed so
We are bullish biased
And we will be expecting a
Further bullish move up
Buy!
Comment and subscribe to help us grow!
Check out other forecasts below too!
Disclosure: I am part of Trade Nation's Influencer program and receive a monthly fee for using their TradingView charts in my analysis.
