11/11/2020 #EURUSD Short term bullish but selling not over yetYesterday's doji daily close point to possible upside. But imo, downside risk not over yet.
Now price above my blue zone. Resistance at 1.18448, 1.1876. 1.19080 will offer low risk sell level.
Below 1.1810, look for 1.1802 to break for 1.17878-90 to trade. 1.17688 and 1.1750 are the lower supports with 1.1722 capping the lows.
Tradinganalysis


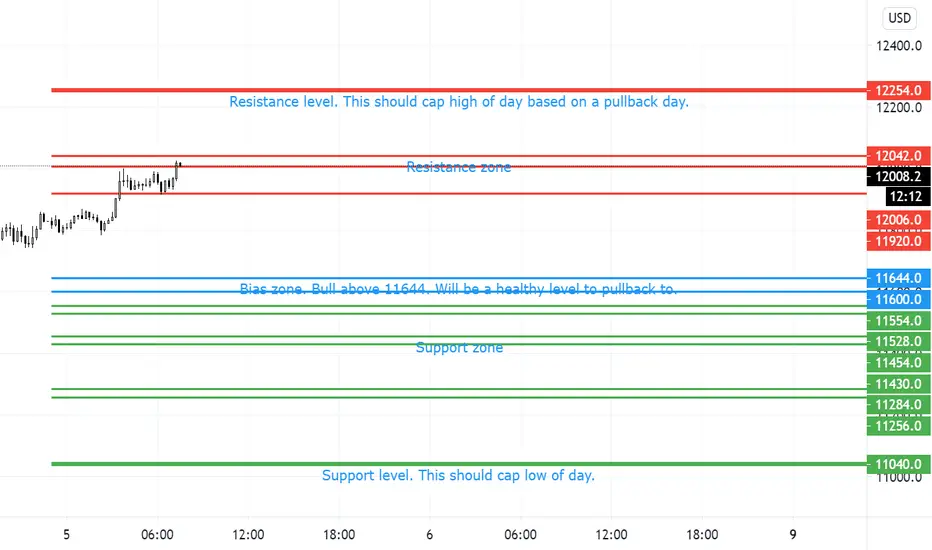
05/11/2020 #NDX Trend is up. Will we get a pullback?According to my system, price is bullish on monthly, weekly and daily.
Bullish above 11600-40. If 11920 breaks, can try short to 11640, else better play safe.
Below 11600, downward support are at 11528-54, 11430-54 and 11256-84. Should market somehow sell off (idk why), 11040 should offer low risk buy level
02/11/2020 #NDX #NQ_F Bullish for TodaySimilarly to SPX, cautiously bullish above 11015.
Immediate resistance is at 11117 (where price is at now). Acceptance above this, we should see 11254-80, where I expect a pullback if we get there. This zone should cap high of day, thus providing low risk sell zone.
If 10987 breaks, look for 10925-42 for support. Below support are 10781-803. In the event of strong sell, 10607-20 will provide low risk buy level

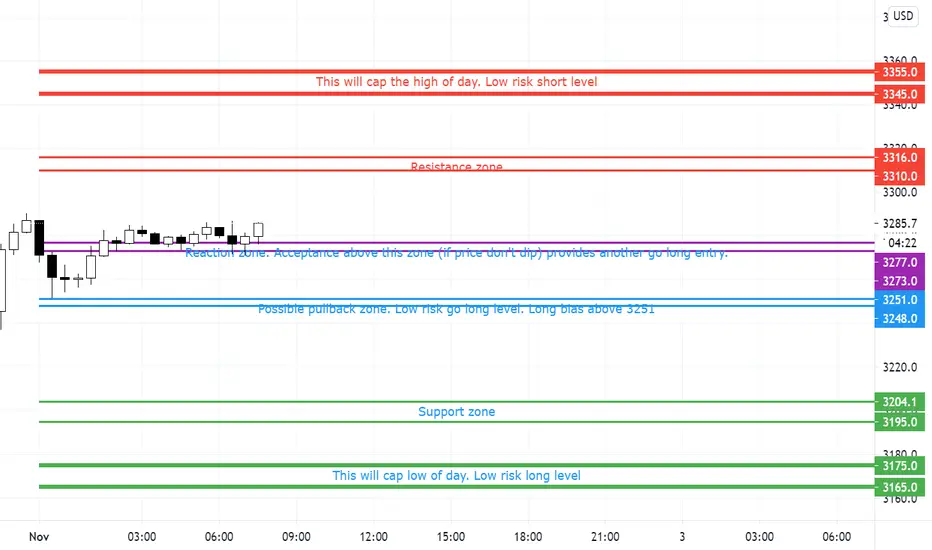
02/11/2020 #SPX Possible Up DayOn monthly, weekly, daily, #SPX is on a downtrend based on my system.
But price action wise, with Friday's doji close, we look to go higher.
This post is later than my usual, some opportunity might be lost already. Price already pullback to 3251 which was my long/short zone. 3273-77 is the other reaction zone to go long, and price is currently above.
Upside resistance will be at 3310-16. 3345-3355 is strong resistance, and it should cap high of day.
In the event 3248 breaks, unlikely today IMO, 3195-3204 will be support. 3165-3175 is strong support, and should cap low of day.

30/10/2020 #SPX Cautiously BullishI tweeted on 22 Oct when SPX is at 3422, we will see a down before end of year to 3140, 3062, 2888.
I called a possible pullback yesterday (29/10) in #NDX. Pullback occurred. When everyone is bullish, news out. Market tanked 300 pts - just at the hit of my R zone (see my other #TradingView post). So where next?
I am bearish longer term but intraday, we MIGHT see price go up today. Yesterday's daily candle was a doji. Price action wise, going up 1st looks more likely. It is not easy to call another up day when a pullback has already happened. But I shall.
3267-73 is support zone. Going long here with a tight stop below 67 offers good R:R, targets are 3295, 3323, 3331, 3355. If some news cause some rally, 3363 should cap high of day. Low risk sell level.
If you are conservative, close above 3295 will provide confirmation for a up day.
If 67 breaks, target 3249, 3212.5. 3185 should offer strong support to cap down move.


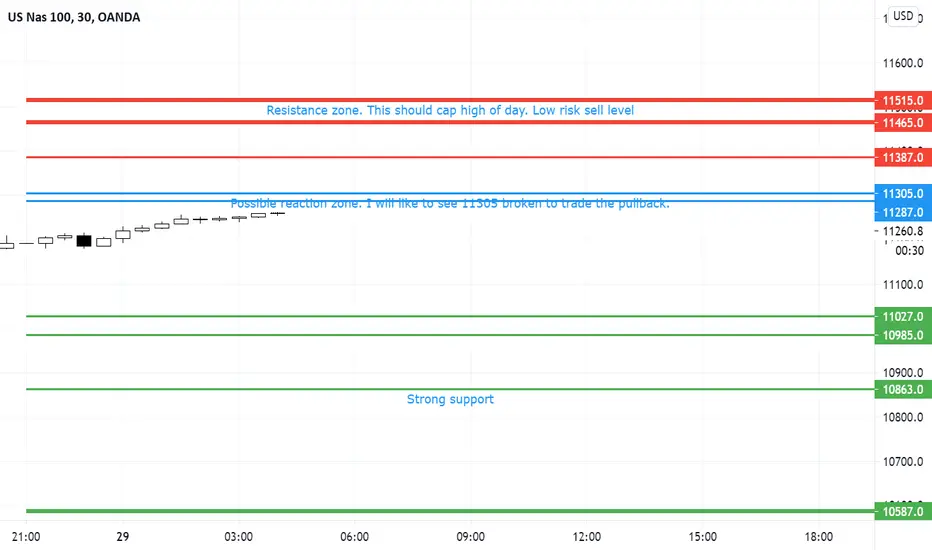
29/10/2020 #NDX Massive sell but good for a pullbackIn my previous #NDX levels given on 22 Oct, my heading was #NDX trying to find a bottom. I hope you heed the advice. All my levels played out perfectly.
We had a massive sell yesterday. It will continue but I sense a pullback first. How deep it might be, I don't know but path of least resistance is still down imo. So play both sides.
Price has moved up slowly since open, around 70pts. If you aren't long yet, do note 11287-305 is my reaction zone. Possible reaction (rejection) for further down, targeting 11027, 10985, 10863. In the event of massive sell and 10587 trade, it will be a low risk buy level. If we do reach the lower levels, I sense there will be buying pressure to try to bring it up.
I will only trade the long if 11305 breaks, targeting 11387, 11465. 11465-11515 is a zone of lots of resistance. I expect rejection from there.

29/10/2020 #EURUSD Obviously bearish but patience is keyYesterday EURUSD tanked quite a bit. If you have been following my tweet, you should be warned. 500 pip movement I see coming, given during last weekend.
Yesterday's very bearish candle signal more downside coming. But I sense (yes sense) that we should have a pullback 1st (price did stall yday later in the session)
Thus you can either play the pullback(go long) or wait for pullback to happen to short or of cos, if it doesn't pullback, to trade the breakout.
Price now ranging in my orange zone for past 6 hours.
If 1.1741 breaks, look to target 1.1711, 1.1677. In the event of heavy selling and 1.1637-47 trades, look for rebound to go long.
If you want to trade the pullback, 1.1773-87 will be a zone with possible reaction to go short, targeting the below levels.
1.1813 should cap high of day. Almost unlikely it will trade, as it will give a bullish engulfing candle on a bearish candle yesterday. I will definitely go short there.
If you want to trade the pullback, probably on break of 1.1755 with stops at low (1.1741). Upside is little - 30pips imo


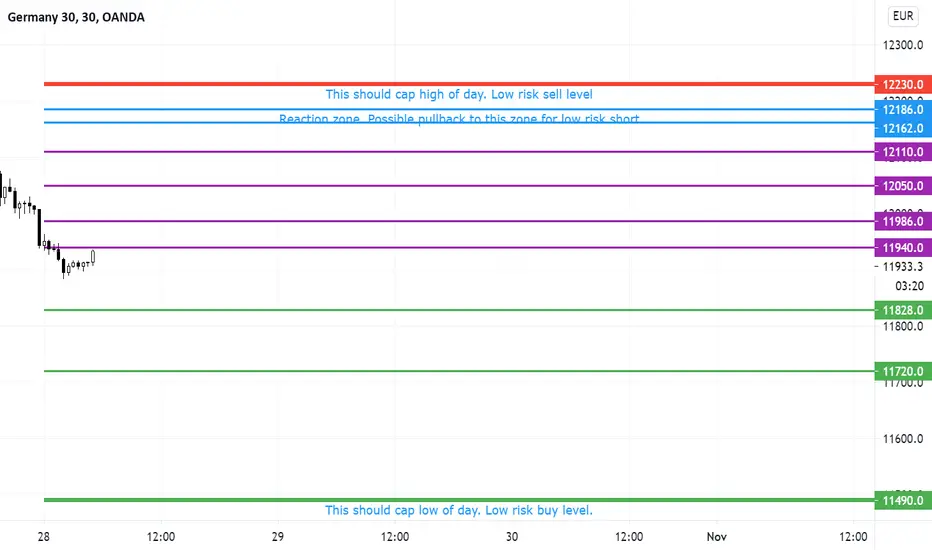
28/10/2020 #DAX30 Looking for more sell but open to pullbackLots of selling yesterday (27 Oct) for #DAX30 #FDAX, closing at the lows.
Selling pressure still on but there might be possibility of pullback. A lot of room to play for the pullback.
12162-86 will present a low risk short zone with purple lines 11940, 11986, 12050, 12110 resistance along the way.
If 12162-86 does not hold, 12230 should cap high of day.
Below targets are 11828, 11720. In the event of panic selling, 11490 should cap low of day - low risk buy level.
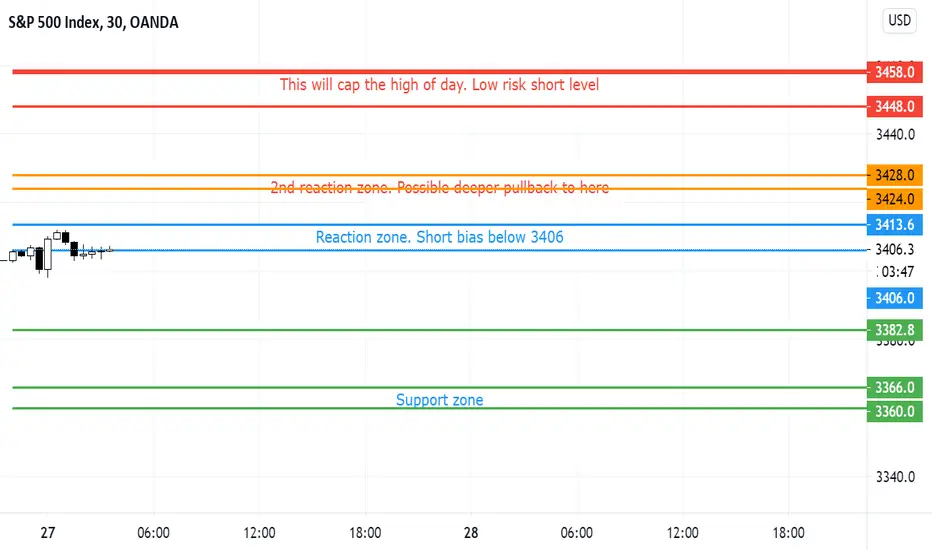
27/10/2020 SPX ES_F Let the sell continueMy post yesterday was titled "Let the crash begin?"
Probably will be more apt without the ?
We had a 100pts downmove then a pullback of 50pts. I still see further down; as I tweeted yesterday, no news is bad news.
Blue zone is usually my buy/sell level.But given the large movement yesterday, I actually put in an orange zone.
Be short below 3406 target 3382.8,3360-66 and even 3318. 3272, if we somehow reach there, will offer low risk buy level.
Do nothing between 3413.6 and 3424. If price pullback to this deeper levell, 3424-28 is the level to hold. If rejected, lower targets as mentioned above will be in play.
I will only want to look for longs above 3428, targetting 3448. 3458 should cap high of day - low risk sell level.
27/10/2020 EURUSD - where next?EURUSD has been ranging for the past 4 days, rather wide swings.
For now, EURUSD looks support above 1.1806 but I cannot ignore the possibility of further down move if 1.1806 breaks. Lower support at 1.1780-88, 1.1764-68, 1.1748. 1.1734 should cap low of day, presenting low risk buy level.
If 1.1824 break, we might see 1.1842, 1.1876. 1.1898 should cap high of day, low risk short level.


XAUUSD RARE BUY OPPORTUNITYLeave a like to support the idea and follow us for more free signals analysis
#gold #goldsignal #forex #forextrader #trading #forextrading #money #forexsignals #trader #forexlifestyle #investment #entrepreneur #investing #binaryoptions #fx #invest #forexmarket #forexlife #stock #success #investor #daytrader #stockmarket #forexsignal #bhfyp #trade #wallstreet #daytrading #financialfreedom #forexprofit #finance #motivation #millionaire #wealth #forexeducation #gold #forextrade #makemoney #profit #luxury #eurusd #forexanalysis #technicalanalysis #forexmentor #cash #pips #makemoneyonline #broker #lifestyle
#forexsignals #forexprofit #forexmoney #forexsignalservice #money #trader #tradingforex #forextraining #investing ##goldtrading #forex #trading #forextrader #gold #forextrading #tradinggold #tradingforex #tradingemas #trader #xauusd #forexsignals #investasi #investasiemas #traderindonesia #broker #forexlifestyle #belajartrading #gkinvestindonesia #goldtrade #forexsignal #goldtrader #xauusdgold #goldsignals #profittrading #tradingsaham #xauusdtrader #forextrade #xauusdsignal #bhfyp

BTC/USDTin my analysis this time i detect swing. The limits to watch out for are at the level of 10874 and the lower limit of 10664.
for now BTC is stable at 11K. for my target 13K.
and I believe BTC will set new records.
Support By
#JuniorOnline
#BabyScrypt


EURNZD Elliott WaveInteresting ABC minor degree forming. We currently are in Minor C and I am expecting a pullback in minute {ii}. It would be a very interesting RRR trade.
If you have further questions please message me, I am happy to help!

XAUUSD Gold is starting wave 5 of Elliot in daily time frame
after wave4 and break triangle in it gold start wave 5
resistance \support
1975
1995
2037
2050
2076
2140
...................................
St 1948/ 1915/ 1903
