7215 resistance now becomes supportWhilst its still volatile, the bulls have managed to break above the 7215 resistance level overnight on the TVC:UKX . That should in theory now become support and as long as the bulls can defend this level then a rise towards the next key resistance area at 7325 is possible. The S&P 1.10% has defined the drop to 2610 yesterday and testing 2650 again. Ball is firmly in the bulls court. A break lower below 7215 leads back towards 7100.
Tradinganalysis

The longer the consolidation is, The bigger is breakout Elf/btc has been consolidation for a while now, and as everybody knows the longer the consolidation is the bigger is the breakout.
Where do you think Elf will go?
The green dotted lines is targets, Blue is strong support.
Lets wait and see, i expect it to breakout in 2 days.
Leave a comment and tell me what u think about it.
Happy hodl!

WHERE IS THE CUP & HANDLE NOW ???? FROM- FEB 22ND to MAR 3RDA lot of traders posted on march 3rd : " CUP & HANDLE CONFIRMED" !!
Where is it now???
Well, market does not care about some picture that some guy invented.
I think Market is not a picture, but a movement.
This is why, "THE MOVING WATER" was born, my strategy, and does not care about these trading pictures.
What do you think?

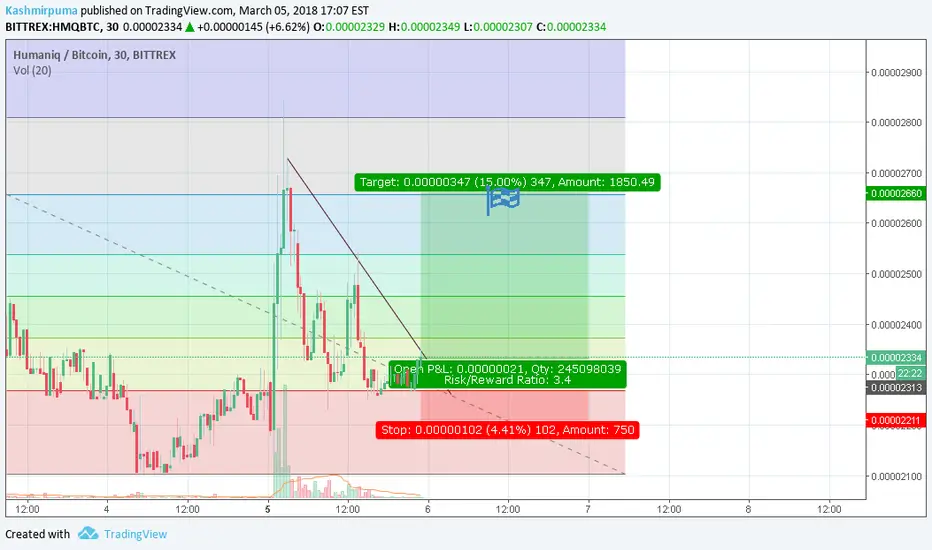
HMQ Long short term opportunityLooks like a typical breakout there, keep prepeared volume is HIGH ATM good news.
Good Ideas for IOTUSD too...!!Pretty much like DSHUSD, we see a beautifull 61,8% FIb after break the counter trend. Good profits upcoming..!!

LTCUSD - Road to RecoveryWe had noticed that so far the 200 Exponential Moving Average has been well respected for ETH and LTC so far.
In addition, the bearish trend line has finally been broken, signaling a trend reversal.
Key levels to start accumulating Litecoin: US$215 and US$165.
Good luck.

CFI - Cofound.IT Forecast Strong Downward support will keep the price stableand move the coin towards upside to test its resistance.
good buying volume can play a massive role in breaking the upside resistance level. I see strong support to stop it from keep fallen further and Hence would recommend buying at current levels.
Company has good management and vision for this Coin to soar in the coming weeks/quarters.

Patientory Forecast (PTOY)Patientory is a healthcare company that focuses on healthcare Data exchange between
Companies, Clients and doctors. Technical forecast is neutral short term but bullish
long term with an uptrend formation. Short to medium term quick upside is in place.
If the current levels hold ground than we can see good Upside Success Ration 4:1

AVT- AVENTUS forecastAVT- Technical Forecast, Good medium to long term hold.
has strong support at current levels and can sustain the sell off.
Price should rebound after the market cool's off.


FTFT Short Positions & FibonacciI expect some short term price boosts for "Future FinTech Group" but not too many. For the past 5 years, it has had downtrends for price. The past 3 month was only filled with some upward trends as a minor recovery. For long term positions, given their digital presence and infrastructure I would say it can still be too risky beyond mid 2018. They can potentially go higher up for a long term, but that would be entirely only speculative. Right now for short bursts, it is investible but still highly risky as a stock position. This is especially true when you compare it to everything else in my portfolio.

ETC (THE sleeping Whale)!!The sleeping whale will soon rise and everybody will be watching it rise.
So better get on the ride and get your positions set.
we see this to reach a level in a year , where no one would have expected for short term hold till A
And if you are holding for long term just expect it to grow to a great level.
Happy Trading:)

OMG getting ready for POSITIVE movement!!!!Days are coming for OMG.
With the new releases of CASPER and more. OMG is Looking to set into the crypto market for good and like wise the prices for it will be also promising and a good hold for long term too.
But if you are into a small term hold it will soon make ATH.
Happy Trading:)


Stellar Trading OpportunityIt looks like the market reached the bottom. We see that 0.024 support level could stop falling market. If the market bounces from it, this new swing low will be higher that the previous one. It will be good confirmation of possible upward movement.

XRP to the moon!!!!For a long time we are seeing XRP.
but now as overall we are seeing a head and shoulder pattern and now hearing the company's new vision and aims for future.
we are hoping for the new high in xrp soon.

EURNZDABC corrective pattern, expecting price to fall and retest trendline and if its a real ABC corrective pattern price will break below trendline.

Bitcoin BREAKING 4500.Great day today! Bitcoin has broken 4500 with good volume, which means it is a strong move.
We are breaking out of this consolidation pattern that we've been in since August 14.
Entry: Above 4500
Target: 5000 *very nice target, it is a round number that people will pay attention to, AND it is both the 261.8 retracement of June/July AND August consolidation levels. When levels line up like that, it's a big deal
Stop: below 4500
So keep to your stop and if it breaks below 4500, we'll probably see lower prices, but right now the move looks powerful.
I think we are going to head quickly to 5000, where we will probably see some profit taking and maybe another consolidation.
-----------
!! PM me with any questions about my analysis !!
MY TRADING METHOD:
I keep my analysis simple. Good analysis always is.
I use Price Patterns, Moving Averages, and RSI for my analysis.
I use the 1 day for trend analysis and 60 minute for trade entry
For my Targets I use Fibonacci projections + measured moves
Successful trading means proper risk sizing and trading small so you can stay in the game.

Bitcoin Cash, When will THIS MONSTER break?Amazing chart here on the BCHUSD Bitcoin Cash 60 minute
IF this thing breaks, it's going to BREAK BIG.
After that incredible run on 17, 18, 19 August, we've consolidated in this descending triangle pattern.
It's a bullish continuation pattern that should resolve itself in the direction of the trend: UP
But right now, it really could break either way. We don't see any overwhelming signs of strength or weakness.
BEARISH: Price breaks support at 580. We have tested that level several times. If we break support, then it's a crash down to 480 or 400 (former support levels)
BULLISH: We see the price bending up and finally breaking out of this triangle formation. Breaking 630 or so would be a good sign.
So right now, I wouldn't go long or short Bitcoin Cash BCHUSD because it's just a coin-flip 50/50 shot.
But I will keep you posted when I see some Bullish developments.
AGain, if this MONSTER breaks, it's going to BREAK BIG. I do not want to miss this one to the upside. We saw how crazy it blew up last time. It has exposure and the volume can come in to really make this thing rock and roll..
---
!! PM me with any questions about my analysis !!
MY TRADING METHOD:
I keep my analysis simple. Good analysis always is.
I use Price Patterns, Moving Averages, and RSI for my analysis.
I use the 1 day for trend analysis and 60 minute for trade entry
For my Targets I use Fibonacci projections + measured moves
Successful trading means proper risk sizing and trading small so you can stay in the game.

Steem Bounce Expected Price 0.00025BTC 20 Aug 2017An upwards bounce is expected on Steem.
Whether this will be just a rally or a change in structure it's too early to say.
Sean Vengan
Professional Cryptocurrency Trader and Trading Educator

Where is The Gold Price Going? XAUUSD Analysis by GBMWatch the full video analysis here: www.youtube.com
So the big question many of my clients have been asking is, where is the gold price going? Well contrary to popular belief, I believe that we may see a strong move to the downside before we see gains in the price again.
There has been a structure break to the downside on the daily time frame, after a 3 wave completion:
There has been a repeat of this on the 4hr chart:
I entered the short on a smaller 1hr flag break and have set a target based on the initial impulse of the current 3 wave move on the daily time frame. At that level I will wait for confirmation of either a continuation to the downside or a trend change.
You can watch the full video analysis here: www.youtube.com
Happy trading!

VeriCoin Trade AnalysisThis coin has caught my eye because I have been seeing lots of volume spikes. Will make for good entries and exits in this uptrend

