ALTCOIN SEASON This is a graph showing the relationship between Ethereum and Bitcoin . I think it is a good time to accumulate altcoins, but I believe that another drop will come and then we will start stronger. Certainly these are good times to invest, of course high risk and high return.
Show me your opinion by put comment below and if you like feel free to follow me!
Tradinganalysis

GoldViewFX - END OF WEEK UPDATEHey Everyone,
We competed our targets on the 1H chart and navigated the movement down, buying dips from strategic levels, like our swing range to catch the perfect bounces. We now close off the week with our 4H chart update.
We can see price broke out of the channel and tested the retracement range we highlighted on the chart last Sunday. We stated a cross and lock below 1927 Goldturn inline with the retracement range will open the swing range at 1911.
We then had the cross and lock confirmation below 1927 confirming 1911 swing range. This was hit perfectly allowing us to catch the bounce, as the swing range on the 4h gave the perfect bounce to the next Goldturn at 1917.
Both our 1H chart and 4H chart ideas were perfectly mapped out to track and trade level to level with pre-confirmation setups, allowing plenty of time to get in or get out.
As always, have a great weekend with families and friends and we will come back Sunday with our multi timeframe analysis and updated targets for the coming week.
Please don't forget to like, comment and follow to support us, we really appreciate it!
GoldViewFX
XAUUSD TOP AUTHOR

BluetonaFX - EURUSD Potential Trendline Break OpportunityHi Traders!
We have a potential trendline break opportunity on the EURUSD 1H chart.
The price action is indicating a bearish move due to the lower highs and lower lows. The market is also below our 20-day EMA.
The confirmation for entry will be a trendline break and a close below the trendline to target 1.09746. If we get this, we must stay below our 20 EMA; if we break above the 20 EMA, then the bearish bias may change.
Please do not forget to like, comment, and follow, as your support greatly helps.
Thank you for your support.
BluetonaFX

GoldViewFX - Gearing up for a breakout!Hey Everyone,
Another great day of trading for us catching the bounce up form 1956 Goldturn to 1962 Goldturn for a clean catch.
As stated yesterday we will see gaps form both ways due to the volatility expected this week and FOMC gear up. We have 1973 Gap and now also 1949 Retracement range, although we had a close retracement challenge already before another nice push up, working perfectly inline with our plans to buy dips.
We will continue with our plans to buy dips and track the movement level to level, as
our long term projection still remains Bullish. However, we have a high volatility week on the forex calendar and FOMC, so expect swings and gaps both ways. STAY SAFE!
BULLISH TARGETS
1962 - DONE
EMA5 CROSS AND LOCK ABOVE 1962 WILL OPEN THE FOLLOWING BULLISH TARGETS
1973
1979
AND POTENTIALLY 1983
BEARISH TARGETS
1956 - DONE
EMA5 CROSS AND LOCK BELOW 1956 WILL OPEN THE RETRACEMENT RANGE
EMA5 CROSS AND LOCK BELOW 1944 WILL OPEN THE SWING RANGE
SWING RANGE
1923 - 1916
As always, we will keep you all updated with regular updates throughout the week and how we manage the active ideas and setups. Please don't forget to like, comment and follow to support us, we really appreciate it!
GoldViewFX
XAUUSD TOP AUTHOR

20072023 - #USDJPYMarket made another trend day - 120 pips to the psychological 140 level before pulling back. As mentioned since Monday, , we are looking for upside to 140.3 and even 141.5, that is almost 300 pips from the lows.
Plan for today: Price is now basing above PZ. Hold above 139.40 and 141.5 could be in sight this week.
If market goes down first, 138.5 will be a good level to look for longs for a move to 140.3. Will update more in the group.

18072023 - #USDJPYYesterday market made a dip before going higher.
Market is much sideways now as it is nested within the zones.
Still on track for my 140.3 target IMO. Look to buy the dips with 138.4 as a low risk entry

18072023 - #EURUSDEURUSD just made a up move to resistance but seemed to fail. Looking for breakdown for a move to PZ and if break, further downside as indicated. Exact entry and exit will be shared in the group.

📉🌊 Potential Falling Wedge Pattern Formation on $WAVES ChartBINANCE:WAVESUSDT $FallingWedge $PatternFormation $TradingView
Greetings, fellow traders! 👋 I'd like to share an intriguing chart pattern I've identified on the BINANCE:WAVESUSDT chart. It appears that a potential falling wedge pattern is forming, suggesting a possible bullish reversal in the near future. Let's delve into the details!
1️⃣ Falling Wedge Formation: The BINANCE:WAVESUSDT chart displays a sequence of lower highs and lower lows, converging within two trend lines. This pattern closely resembles a falling wedge, characterized by a contracting range. Falling wedges often signify a bullish reversal.
2️⃣ Volume Analysis: Volume analysis is crucial for pattern confirmation. Ideally, we would expect to see diminishing volume as the wedge develops, followed by a surge in volume upon breakout. This could indicate increased buying interest that may potentially propel the price higher.
3️⃣ Resistance and Support Levels: It is essential to monitor the upper resistance trend line and lower support trend line. A breakout above the resistance line, accompanied by notable volume, might suggest a bullish breakout. Conversely, a breakdown below the support line could invalidate the pattern.
4️⃣ Price Target and Stop Loss: Should the falling wedge pattern confirm, a common technique to estimate the potential target is to measure the widest part of the wedge and project it from the breakout point. Regarding stop loss placement, it is often advisable to position it below the support line to mitigate potential losses.
Nevertheless, it is important to remember that technical patterns should be used in conjunction with other forms of analysis, such as fundamental research and market sentiment, to make well-informed trading decisions.
To summarize, the BINANCE:WAVESUSDT chart is currently exhibiting a potential falling wedge pattern, indicating a possible bullish reversal on the horizon. Nonetheless, confirmation through a breakout above the upper resistance trend line and a surge in volume is essential. Traders are advised to exercise caution and implement appropriate risk management strategies.
What are your thoughts on this pattern? Share your insights below! Remember to conduct your own analysis and consult with financial professionals before making any investment decisions.
#WAVES #FallingWedge #PatternFormation #BullishReversal #TradingAnalysis #TechnicalAnalysis #Cryptocurrency #TradingView

Potential Falling Wedge Pattern Formation on $SUSHI/USDT Chart#SUSHI #DEFI #FallingWedge #PatternFormation #TradingView
Hello traders! 👋 I wanted to share an interesting chart observation I made on the $SUSHI/ AMEX:DEFI pair. It appears that a potential falling wedge pattern is forming, which could indicate a bullish reversal in the near future. Let's dive into the details!
1️⃣ Falling Wedge Formation: The price action on the $SUSHI/ AMEX:DEFI chart shows a series of lower highs and lower lows, converging between two trend lines. This pattern is commonly known as a falling wedge, characterized by a contracting range. Falling wedges are often considered bullish reversal patterns.
2️⃣ Volume Analysis: Volume plays a crucial role in confirming patterns. Ideally, we would like to see declining volume as the wedge develops, followed by an increase in volume upon breakout. This could indicate a strong buying interest that could potentially propel the price higher.
3️⃣ Resistance and Support Levels: The upper resistance trend line and lower support trend line are important areas to monitor. A break above the resistance line, accompanied by a surge in volume, may suggest a bullish breakout. Conversely, a breakdown below the support line could invalidate the pattern.
4️⃣ Price Target and Stop Loss: If the falling wedge pattern confirms, a common technique to estimate the potential target is to measure the distance between the widest part of the wedge and add it to the breakout point. As for stop loss placement, it is often set below the support line to limit potential losses.
Keep in mind that technical patterns are not foolproof and should be combined with other forms of analysis, such as fundamental research and market sentiment, before making trading decisions.
To summarize, the $SUSHI/ AMEX:DEFI pair is exhibiting a potential falling wedge pattern, which suggests a bullish reversal might be on the horizon. However, confirmation is required through a breakout above the upper resistance trend line and a surge in volume. Traders should exercise caution and consider utilizing proper risk management strategies.
What are your thoughts on this pattern? Share your insights below! Remember to do your own analysis and consult with financial professionals before making any investment decisions.
#SUSHI #DEFI #FallingWedge #PatternFormation #BullishReversal #TradingAnalysis #TechnicalAnalysis #Cryptocurrency #TradingView

05072023 - #EURUSDYesterday I was looking at some downside in EURUSD though the manner for that is not so clear. I was looking at either a move up (as price is above PZ) to first resistance for a short down or if PZ breaks, for a move down to weekly BZ. In the end the latter case happened as price broke lower, re-test the highs and lows was at the 1.0878 level I gave. On the other GBPISD was strong all the way with BZ holding it for a move higher.
So what is it for today? I am going to cover EURUSD only and not GBPUSD. This is just based on the view that we COULD see a break lower in EURUSD (though I have no strong views of DXY).
Price is now within the PZ and below BZ. I have provided two possible paths for a move lower; either short on break of PZ or if it moves up from here first, a rejection off 1.09 or so for a move lower.

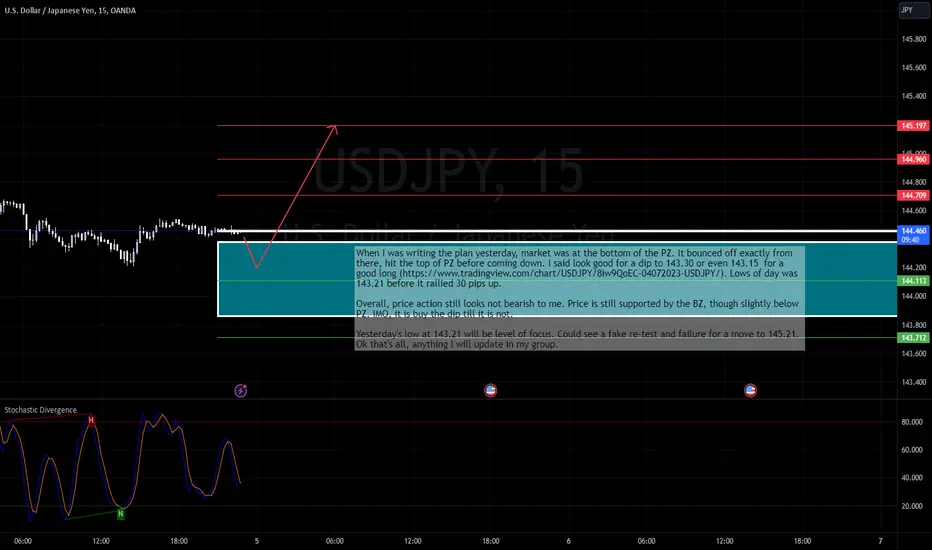
05072023 - #USDJPYWhen I was writing the plan yesterday, market was at the bottom of the PZ. It bounced off exactly from there, hit the top of PZ before coming down. I said look good for a dip to 143.30 or even 143.15 for a good long (). Lows of day was 143.21 before it rallied 30 pips up.
Overall, price action still looks not bearish to me. Price is still supported by the BZ, though slightly below PZ. IMO, it is buy the dip till it is not.
Yesterday's low at 143.21 will be level of focus. Could see a fake re-test and failure for a move to 145.21. Ok that's all, anything I will update in my group.
04072023 - #GBPUSDYesterday, GBPUSD almost followed the path I gave. We longed from the buy level, it hit the resistance for a good 60pips where I said will see a sell and it came down another 40 pips.
Anyway what is it for today? I said it looks bullish for EURUSD, but yet I am also bullish DXY. Yet, from the time I posted the EURUSD plan to this GBPUSD plan, DXY is strong (EURUSD at the bottom of the PZ for a possible move lower) while GBPUSD is below its PZ and at its BZ. TBH, IMO, a break below 1.2681 is a good short to test yesterday's low at 1.2655 or so and watch for a possible failed test and another bounce up.

04072023 - #USDJPY Plan worked perfectly yesterday (), as price ranged within my PZ, broke out to 1st resistance, made a double top before crashing down on news to where? To my buy zone as stated in yesterday's plan perfectly (144-144.10 I said, USDJPY hit 143.98) and moved up 70 pips.
What's for today? IMO price still looks supported. Price is now nesting within the PZ, possible move up from here to target 145.08 and 145.31; if not a dip first to 144.30 and even 144.15 for a good long.

03072023 - #GBPUSDSimilar to USDJPY, let's look at the monthly and weekly candles since these have just closed. Monthly candle wise we can see a very bullish candle, but at the same time, market hit a strong resistance of mine last month and pulled back, and is forming what could be a bearish divergence on monthly (which is a very strong signal). Weekly wise, similar bearish divergence on weekly, and market did sell off last week, only for a late week rally to close the week with what looked like a doji. Also price is tagging the top of the Bollinger Band. Does doji means we will have an up week this week?
Ok daily price action, based on Friday's bullish close seem to indicate further upside and I think we can also see what could be a bull flag for another leg up. That is, UNLESS, the high is already given on Friday. That is, market will sell down today below OP. Also, look the zones given in the chart; we can see that price is sorta still in an uptrend with all the zones below supporting. But probably a main thing to look for any reversal is the daily BZ. Below BZ and OP (1.2683), market could move go down with the highs in place. Having said so much, so what's my point?
Overall, I think there are signs of a reversal down coming, but that would require further confirmation. For now, how I will possibly trade today would be, currently price is above the PZ. Price looked to have based, can try a long to target Friday's high. Also look for possible failure and try a short at 1.27170 for a move to 1.2700 and 1.2662 where we should see a bounce. If market trades to 1.2775, look for a short for a move to 1.2717. That's what I see for now, anything else I will update in the group.

30062023 - #USDJPYUSDJPY, I said we see a move to first resistance and sell down. I was right for the first part but wrong on the second; market nicely came down to PZ, then rallied to first resistance, sold back down to PZ for a good 50 pips and held there for hours before the US data resulted in another rally up. The levels itself are enough to make you money.
But anyway, so what is it for today? On daily, no signs of weakness (yes there was no weakness for days). So, am not surprised if market give another green day. We probably need some risk off to strengthen yen but it is not so now.
From the chart, can see PZ supporting it; likely move to 145.10 and 145.36, else look for longs after a dip to 144.32. Overall, again, IMO, shorting USDJPY is more of looking for weakness in USD than strength in JPY. Thus going long, say GBPUSD might be a better trade (assuming JPY weakness).

29062023 - #EURUSDI was looking for a dip for a move higher for EURUSD. The 1.0940 gave a good 20 pips up move but it tested the high and failed and came down, before recovering half way to end the day. This morning, now, EURUSD is continuing the down move at a key level + PZ level. Price is bearish below the two zones with a possible move to test yesterday's low 1.0896 and 1.0886 with DXY possibly going to 102.76-86.
Watch for a possible bullish divergence in EURUSD for a reversal. 1.0886 is a strong support thus expect strong reaction there.

29062023 - #USDJPYi gave you the move from 143.80 to 144.60 yesterday on almost 0 MAE. ()
HOD was 144.61 and market pulled back, although only slightly. TBH price action is bullish, how to fade this? But 144.60 is an important resistance. I would say I am not bullish JPY but looking for DXY bearishness. Look for break of 144.30 for a move to 143.95 and even 143.40

28062023 - #USDJPYYesterday, I drew a triangle () and price was within my PZ. I said price to go down but almost immediately flipped my view to go long from the PZ which worked out perfectly as that was the bottom, giving a 3R trade. PZ proved to be a powerful zone as market made a second dip but was just bought up. 143.72 holds, 144.62 is target. A possible trade here is long 143.88, 25 pips stop, target 144.60, 70 pips profit.
Anyway what is it for today? Price action is still looking bullish but there will be BOJ speech later which could make things volatile. Price is currently within the PZ. Basing here would launch another up move to target 144.60. Probably the only concern is how yen is gaining strength against other currencies (only USDJPY is up now). But overall, the stand is clear

27062023 - #USDJPYUSDJPY nicely followed the path I gave yesterday () , dip down from PZ to the BZ and came back up. I was short AUDJPY which played out well, but today it seemed that DXY will have a down day.
USDJPY is still in a consolidation in a triangle type formation. But I am looking for a down in USDJPY thus on break of the PZ, expect further downside to 143.06 and 142.90 then 132.60, where we should see a bounce.

SeaHarvest is ready to float to R12.00The price has broken above the downtrend.
There is a crucial level that was tested, and it might be where the buyers and Smart Money have filled their orders.
Every other indicator is showing downside, but remember indicators are based on past momentum NOT the future.
So we can expect the price to rally up before the next drop. But I'll let you know.
21>7 - Bearish
RSI<50 - Bearish
Target short term R12.00
ABOUT THE COMPANY
SeaHarvest Group is a South African fishing and food processing company listed on the Johannesburg Stock Exchange (JSE) under the ticker symbol SHG.
The company was founded in 1964 and is headquartered in Cape Town, South Africa.
SeaHarvest specializes in the harvesting, processing, and marketing of a wide range of seafood products, including hake, prawns, squid, and value-added frozen seafood meals.
Hake is the primary species for SeaHarvest, and the company is one of the largest hake fishing and processing companies in South Africa. South AFricans are very lucky to have Hake at your disposal. In Europe it's difficult to find.
SeaHarvest operates a fleet of vessels that engage in both inshore and deep-sea fishing to ensure a sustainable supply of seafood.
The company's fishing operations primarily target hake, a popular white fish species known for its mild flavor and versatility in cooking.
SeaHarvest operates state-of-the-art seafood processing facilities that adhere to strict quality and food safety standards.
The company's product range includes frozen whole fish, fillets, portions, seafood mixes, and coated products, catering to both retail and foodservice sectors.

26062023 - #DAXLast Friday, market sold off after Thursday's somewhat bearish close. It sold perfectly to support before an equally fast recovery. Market closed near the mid point.
Weekly chart looks bearish with price below weekly BZ. Also, looking at how the monthly candle at this point of time, my thought was that if price trades below May's low, that could trigger downside. But at the same time, we also had the Russia news over the week end which probably seem to indicate a gap down but no it did not.
Having said so much, we should see further downside today. But let's see what premarket brings. Price is now basing above PZ, thus short term wise, could see a move to 15890 and even 15924 first before a rejection; looking for a move to 15710 or so, where we look for any long opportunities. If market did not trigger the above 2 levels, look for a move below 15824, test and rejection for the move lower.

26062023 - #USDJPYOn Friday, I said PZ hold, 143.84 is next (). Despite the negative news, this was what happened exactly and market traded up 100pips from PZ and then it pulled back.
This morning, price tested the highs, but broke down to bottom of PZ perfectly before bouncing to top of PZ now. Short term price action is slightly bearish. Watching rejection of USDJPY at 143.54 top of BZ for a move to 143.26 and on further break to 142.90 for this pullback move.

21062023 - #GBPUSDGBP is weaker than EUR and yesterday we see that price was hovering just at PZ and not able to go higher before the move down and eventually a recovery. EURGBP IMO is looking good for further upside.
But anyway for GBPUSD, price action does point to further downside; with price capped by PZ now, looking for another revisit of yesterday's low at 1.2720 and even 1.2646. We have UK CPI data later so be careful. If my view on EURGBP is correct, then yes, the news could be a trigger for the move down (GBP to weaken).
