📈📉How Market Cycles Work | Bull & Bear Market 🐿
All the financial markets are cyclical :
after a sharp and strong bullish trend always comes a severe bearish rally.
After panic & massive selloffs, the market tends to recover and awakens optimism closing a vicious circle.
Watching carefully how the price acts during these cycles, an observer can identify the recurring stages .
#1 Accumulation
The accumulation stage starts once the market finds its bottom.
Bearish pressure weakens and the market starts trading in sideways.
While the crowd remains cautious, smart money like banks and hedge funds start buying the asset considering that to be undervalued.
It leads to occasional moderate spikes of a price.
Being the best time to buy the market, the accumulation stage is the hardest to spot correctly. Global pessimism and disbelief make the investor scared to buy the asset.
#2 - 3 Public Participation & Excess Stage
The accumulation stage and the actions of smart money make the crowd buy the asset steadily. Pushing the market to new highs and generating sufficient profits, the crowd brings more and more liquidity into the market.
Bullish trend is universally confirmed.
The optimism steadily transforms into euphoria and the asset quickly becomes overvalued. Greed starts to dominate the crowd. Record highs are reached and no one doubts further growth.
#4 Distribution
At some moment the market stops growing. Even though everyone is very confident in a bullish continuation, the market naturally refuses to grow.
Moreover, the market starts to slow down and volatility drops steadily.
The market starts ranging and trade in sideways.
Smart money starts selling their positions steadily to a greedy crowd.
#5 Bearish Trend
With an absence of growth, more and more market participants start selling the asset. Optimism steadily vanishes and pessimism comes into play.
Contemplating negative figures, the crowd starts to panic, making the market fall sharply.
The outlook is dark and no one believes in recovery.
Then the market suddenly starts slowing down and the cycle repeats.
Watch how the price acts, learn the price action & master the market cycles to benefit from any of them.
❤️ Please, if you enjoyed this article, like it and share your feedback in a comment section. Thank you! ❤️
Tradingbasics

Eurjpy 20 08 2021Eurjpy The price does not react to the support level and is pressed towards it under the pressure of sellers. I'm waiting for a breakdown of local support and a price decline to the level of 127.2

Eurusd 20 08 2021Eurusd The Eurodollar has retraced slightly from the lower border of the channel and is trading between the support and resistance of 1.17.
I expect a deeper rollback, therefore, if the price goes beyond the level and consolidates above 1.17, then we can expect an increase to the resistance of 1.175
———

Improve Forex TradingWhen I was learning how to trade and when I was watching and reading different trading educators, these words naturally pissed me off. What the hell are you talking about? What confirmation?
It was a full-blown mystery...🤯
Then, once I started to mature in trading and trade full-time, I became an author on TradingView.
Posting my forecasts and trading setups, I frequently mentioned the confirmation.
And now the newbies that are reading me and learning from me are pissed off...🤬
That is so funny I guess.
But the truth is that the confirmation must become a fundamental part of your trading strategy. It is your key to successful trading.
What exactly is the confirmation?
It depends on many many different things, in this article I will discuss with you the 4 main types of confirmation and give you detailed examples.
1️⃣ - PRICE ACTION CONFIRMATION
That is actually what I prefer.
Analyzing different markets and searching for decent trading opportunities often times we find some peculiar instruments to watch.
Identifying the market trend and key levels we find the potential spots to trade from.
But do we just open the trade once the "ZONE" is spotted?
I wish it could be that simple...
Trading just the zone, without additional clues brings very negative figures. We definitely need something else.
Price action & candlestick patterns can be those clues.
Accurate reflection of the current local market sentiment makes the patterns a very reliable confirmation.
Dodji's, pin bars, double tops/bottoms ...
Proven by history, the skill of identification & reading the patterns will pay off quickly.
Being in some sense the language of the market, the patterns are the fundamental part of my trading strategy.
2️⃣ - FIBONACCI LEVELS
Fibonacci levels are a very popular technical tool. Being applied properly it helps the trader to confirm or, alternatively, disqualify the identified "ZONE".
With multiple different methods like confluence trading, fibs are applied in hedge funds and various banking institutions.
The main problem with the fibs, however, is complexity and a high degree of subjectivity. Meeting different traders and watching different posts on TradingView I noticed that all traders tend to have their own vision. There is no universal system to apply here, a proper fib.confirmation technique can be built only with long-lasting backtesting and practicing.
3️⃣ - FUNDAMENTAL NEWS
The figures in the economic calendar, news, tweets. Actual fundamental news can become your best confirmation tool.
However, the main obstacle right here is the promptness, validity and reliability of the data that you get.
The information shouldn't be delayed and it must be objectively true.
The search for such a source is by itself is a very time-consuming and labor-intensive business not even mentioning its potential costs.
And that is not all. Knowing how to make sense of that data, its proper perception, and understanding requires a solid economical and financial background and experience.
At the end of the day, becoming an expert in fundamental analysis , the trader can easily sort the trading zones and trade only the ones that are confirmed by a decent fundamental trigger.
4️⃣ - TECHNICAL INDICATORS
I believe all the traders apply some indicators. From a simple moving average to some complex composite algorithms, indicators play a very important role in trading.
Being 100% objective and providing up-to-date real numbers and figures, they are our allies in a battle against subjectivity.
For many traders, the various signals from indicators are considered to be accurate and reliable confirmations.
Many algotrading solutions are operating simply relying on such signals and being able to bring consistent profits proves the power of technical indicators.
What confirmation type should you rely on?🧐
I guess the main rule right here is that the confirmation must MAKE SENSE to you. You should feel the logic behind that. It must make you confident in your action, even in case of the occasional losses, it must keep you calm and humble.
Let me know in a comment section what confirmation do you prefer!
SETTING UP YOUR CHART ON TRADING VIEW | BEGINNER'S GUIDE 👨🏫📈
Prepare your chart for price action trading.
Learn to make your chart clean and naked.
Make your candles bright & vivid.
Take away the distracting elements.
❤️Please, support this idea with a like and comment!❤️

📈📉How Market Cycles Work | Bull & Bear Market 🐿
All the financial markets are cyclical :
after a sharp and strong bullish trend always comes a severe bearish rally.
After panic & massive selloffs, the market tends to recover and awakens optimism closing a vicious circle.
Watching carefully how the price acts during these cycles, an observer can identify the recurring stages .
#1 Accumulation
The accumulation stage starts once the market finds its bottom.
Bearish pressure weakens and the market starts trading in sideways.
While the crowd remains cautious, smart money like banks and hedge funds start buying the asset considering that to be undervalued.
It leads to occasional moderate spikes of a price.
Being the best time to buy the market, the accumulation stage is the hardest to spot correctly. Global pessimism and disbelief make the investor scared to buy the asset.
#2 - 3 Public Participation & Excess Stage
The accumulation stage and the actions of smart money make the crowd buy the asset steadily. Pushing the market to new highs and generating sufficient profits, the crowd brings more and more liquidity into the market.
Bullish trend is universally confirmed.
The optimism steadily transforms into euphoria and the asset quickly becomes overvalued. Greed starts to dominate the crowd. Record highs are reached and no one doubts further growth.
#4 Distribution
At some moment the market stops growing. Even though everyone is very confident in a bullish continuation, the market naturally refuses to grow.
Moreover, the market starts to slow down and volatility drops steadily.
The market starts ranging and trade in sideways.
Smart money starts selling their positions steadily to a greedy crowd.
#5 Bearish Trend
With an absence of growth, more and more market participants start selling the asset. Optimism steadily vanishes and pessimism comes into play.
Contemplating negative figures, the crowd starts to panic, making the market fall sharply.
The outlook is dark and no one believes in recovery.
Then the market suddenly starts slowing down and the cycle repeats.
Watch how the price acts, learn the price action & master the market cycles to benefit from any of them.
❤️ Please, if you enjoyed this article, like it and share your feedback in a comment section. Thank you! ❤️

IMPROVE YOUR TRADING | 4 TYPES OF TRADE CONFIRMATION ✅👌
"Look for a confirmation!"
"Wait for a confirmation!"
When I was learning how to trade and when I was watching and reading different trading educators, these words naturally pissed me off. What the hell are you talking about? What confirmation?
It was a full-blown mystery...🤯
Then, once I started to mature in trading and trade full-time, I became an author on TradingView.
Posting my forecasts and trading setups, I frequently mentioned the confirmation.
And now the newbies that are reading me and learning from me are pissed off...🤬
That is so funny I guess.
But the truth is that the confirmation must become a fundamental part of your trading strategy. It is your key to successful trading.
What exactly is the confirmation?
It depends on many many different things, in this article I will discuss with you the 4 main types of confirmation and give you detailed examples.
1️⃣ - PRICE ACTION CONFIRMATION
That is actually what I prefer.
Analyzing different markets and searching for decent trading opportunities often times we find some peculiar instruments to watch.
Identifying the market trend and key levels we find the potential spots to trade from.
But do we just open the trade once the "ZONE" is spotted?
I wish it could be that simple...
Trading just the zone, without additional clues brings very negative figures. We definitely need something else.
Price action & candlestick patterns can be those clues.
Accurate reflection of the current local market sentiment makes the patterns a very reliable confirmation.
Dodji's, pin bars, double tops/bottoms ...
Proven by history, the skill of identification & reading the patterns will pay off quickly.
Being in some sense the language of the market, the patterns are the fundamental part of my trading strategy.
2️⃣ - FIBONACCI LEVELS
Fibonacci levels are a very popular technical tool. Being applied properly it helps the trader to confirm or, alternatively, disqualify the identified "ZONE".
With multiple different methods like confluence trading, fibs are applied in hedge funds and various banking institutions.
The main problem with the fibs, however, is complexity and a high degree of subjectivity. Meeting different traders and watching different posts on TradingView I noticed that all traders tend to have their own vision. There is no universal system to apply here, a proper fib.confirmation technique can be built only with long-lasting backtesting and practicing.
3️⃣ - FUNDAMENTAL NEWS
The figures in the economic calendar, news, tweets. Actual fundamental news can become your best confirmation tool.
However, the main obstacle right here is the promptness, validity and reliability of the data that you get.
The information shouldn't be delayed and it must be objectively true.
The search for such a source is by itself is a very time-consuming and labor-intensive business not even mentioning its potential costs.
And that is not all. Knowing how to make sense of that data, its proper perception, and understanding requires a solid economical and financial background and experience.
At the end of the day, becoming an expert in fundamental analysis, the trader can easily sort the trading zones and trade only the ones that are confirmed by a decent fundamental trigger.
4️⃣ - TECHNICAL INDICATORS
I believe all the traders apply some indicators. From a simple moving average to some complex composite algorithms, indicators play a very important role in trading.
Being 100% objective and providing up-to-date real numbers and figures, they are our allies in a battle against subjectivity.
For many traders, the various signals from indicators are considered to be accurate and reliable confirmations.
Many algotrading solutions are operating simply relying on such signals and being able to bring consistent profits proves the power of technical indicators.
What confirmation type should you rely on?🧐
I guess the main rule right here is that the confirmation must MAKE SENSE to you. You should feel the logic behind that. It must make you confident in your action, even in case of the occasional losses, it must keep you calm and humble.
Let me know in a comment section what confirmation do you prefer!
💝Please, support my work with like and comment!
Thank you for reading.

IMPROVE YOUR TRADING | 4 TYPES OF TRADE CONFIRMATION ✅👌
"Look for a confirmation!"
"Wait for a confirmation!"
When I was learning how to trade and when I was watching and reading different trading educators, these words naturally pissed me off. What the hell are you talking about? What confirmation?
It was a full-blown mystery...🤯
Then, once I started to mature in trading and trade full-time, I became an author on TradingView.
Posting my forecasts and trading setups, I frequently mentioned the confirmation.
And now the newbies that are reading me and learning from me are pissed off...🤬
That is so funny I guess.
But the truth is that the confirmation must become a fundamental part of your trading strategy. It is your key to successful trading.
What exactly is the confirmation?
It depends on many many different things, in this article I will discuss with you the 4 main types of confirmation and give you detailed examples.
1️⃣ - PRICE ACTION CONFIRMATION
That is actually what I prefer.
Analyzing different markets and searching for decent trading opportunities often times we find some peculiar instruments to watch.
Identifying the market trend and key levels we find the potential spots to trade from.
But do we just open the trade once the "ZONE" is spotted?
I wish it could be that simple...
Trading just the zone, without additional clues brings very negative figures. We definitely need something else.
Price action & candlestick patterns can be those clues.
Accurate reflection of the current local market sentiment makes the patterns a very reliable confirmation.
Dodji's, pin bars, double tops/bottoms ...
Proven by history, the skill of identification & reading the patterns will pay off quickly.
Being in some sense the language of the market, the patterns are the fundamental part of my trading strategy.
2️⃣ - FIBONACCI LEVELS
Fibonacci levels are a very popular technical tool. Being applied properly it helps the trader to confirm or, alternatively, disqualify the identified "ZONE".
With multiple different methods like confluence trading, fibs are applied in hedge funds and various banking institutions.
The main problem with the fibs, however, is complexity and a high degree of subjectivity. Meeting different traders and watching different posts on TradingView I noticed that all traders tend to have their own vision. There is no universal system to apply here, a proper fib.confirmation technique can be built only with long-lasting backtesting and practicing.
3️⃣ - FUNDAMENTAL NEWS
The figures in the economic calendar, news, tweets. Actual fundamental news can become your best confirmation tool.
However, the main obstacle right here is the promptness, validity and reliability of the data that you get.
The information shouldn't be delayed and it must be objectively true.
The search for such a source is by itself is a very time-consuming and labor-intensive business not even mentioning its potential costs.
And that is not all. Knowing how to make sense of that data, its proper perception, and understanding requires a solid economical and financial background and experience.
At the end of the day, becoming an expert in fundamental analysis , the trader can easily sort the trading zones and trade only the ones that are confirmed by a decent fundamental trigger.
4️⃣ - TECHNICAL INDICATORS
I believe all the traders apply some indicators. From a simple moving average to some complex composite algorithms, indicators play a very important role in trading.
Being 100% objective and providing up-to-date real numbers and figures, they are our allies in a battle against subjectivity.
For many traders, the various signals from indicators are considered to be accurate and reliable confirmations.
Many algotrading solutions are operating simply relying on such signals and being able to bring consistent profits proves the power of technical indicators.
What confirmation type should you rely on?🧐
I guess the main rule right here is that the confirmation must MAKE SENSE to you. You should feel the logic behind that. It must make you confident in your action, even in case of the occasional losses, it must keep you calm and humble.
Let me know in a comment section what confirmation do you prefer!
💝Please, support my work with like and comment!
Thank you for reading.

8 WAYS TO IMPROVE YOUR TRADING | Tips From Experienced Trader 🤓
In my years in trading, I’ve been approached by the new and semi-experienced traders for help and advice, and that's how it's supposed to be. Those that «have become» help those aspiring ones.
Then I thought that tens of thousands of people are joining tradingview every day, and most of them are beginners and inexperienced traders, So I decided to share some knowledge here with you today. Condensed wisdom of years in trading. 🦉
You see, trading is unique in that it is accessible to people of all walks of life. Your previous education, social status, and other barriers, that might prevent you from entering some industries are completely absent in trading. The only tool you need is your brain, as trading is essentially an exercise in pattern recognition and our cognition is based on pattern recognition and the endless chain of association.🧠
So the CORE is your ability to learn and recognize patterns, and everything else gets added like pearls on the string. Master these KEY points below, and the Gods of trading might smile at you!
✏️🗒️ MAKE A TRADING PLAN - Develop a strategy!
This bit seems obvious, yet so many traders arrive to this idea only after losing their first account. Don’t be like that, and you will lose your first account much slower. Research all the main strategies that are out there, and dive deep into the one you found appealing(for any reason). This step might take a year or even more, yet, trust me, this will be time well spent. I would advise simple multi-timeframe top-down technical analysis. I might be biased, as that’s the strategy I use myself, but learning it will give you the basics that you will NEED ANYWAY, whichever strategy you will end up using later. Also, I would choose it because it is intuitive and simple to use. You will be able to identify key levels on the chart after a week of staring at the charts and then work your way up, polishing entries, adding indicators if you like.
🔁 Review your plan after every trading session!
After you started trading, even on a demo, DO YOUR HOMEWORK, or else all the trading that you do is in vain, and you will NEVER LEARN. Start your day by reviewing the previous day’s trades, as you will have a fresh perspective that isn’t clouded by emotions of the moment. This WORKS WONDERS! Have a diary with trades, write down your thought process of how you arrived at the particular trade. Then write down your assessment of the next day nearby. Several months' worth of a journal like that is a GOLD MINE, where you can mine data, looking at what works, what does not, etc…
⚠️ DON’T RISK MORE THAN YOU CAN AFFORD TO LOSE - Protect your positions!
USE STOP LOSS and place it the moment you entered the trade. Don’t let your mind play tricks on you. As your inner voice will tell you «Why SL? I will close that trade manually, If I see that I was wrong» Nah, you won’t. You are kidding yourself. So DO use SL, don’t give your money to the market makers!
💯 Don’t risk more than 5% of the account!
Now that we know we need to use SL, I strongly advise you to never risk more than 5% of your account in one trade. In fact, I do not risk more than 1% per each trade myself. Use a lot calculator to help you determine how much you are risking in dollar value per trade. It is a bit boring, but will save you a ton of money!
And who said trading needs to be fun, huh? You are a grownup and it's your job!
😌 BE DISCRETE AND DISCIPLINED -Once you have the system, don’t overthink it!
After you mastered your system, backtested it on multiple pairs and begin trading on demo, stop worrying about whether the strategy is good or bad. You chose it, it showed results on the backtest, now get out and test it on the market. Time will show if your choice was correct.
📜 Follow the rules and reflect on the results later!
Once the system is chosen, make the rules that are as simple and clear as possible so that you could approach each trade with a ready-made algorithm. This will take a lot of stress off your mind.
💢 CONTROL YOUR EMOTIONS - Too much anger or excitement alike hurt your trading!
Having a strict algorithm helps massively, and when trading you need to learn to abstract yourself from the monetary values on the screen. These are just numbers, and you are playing a game of probability, so there will be winning and losing streaks. Learn to treat both with indifference.
🌁 Play it cool!
Trading is a battle of wills. Whoever has the hardest balls wins. So be cool!
⌛️ BE PATIENT - Keep your eyes on the big picture!
When even considering trading as a potential career, please accept the simple fact that there will be losses, a lot of them, all the time. You will NOT be making money for quite some time. Accept it as part of the game and it will be much easier for you physiologically. If you come with the make easy money fast mindset, you will lose!
🏅 Winning takes time!
I’ll stress it again, learning trading will take a lot of time, and there are some hard times ahead of you, so prepare for this beforehand, and no, you are NOT unique or special, so you will have to go through the same trial and error ordeal as others. There are no shortcuts.
✔️ ACCEPT YOUR LOSSES AND MOVE ON - Remember that you are in this for the long haul!
When feeling down because each trade this week was a losing one, imagine yourself free from the location, from your job, from all the constraints that usual people have, and remind yourself, that that’s exactly what you are working towards, because the moment you can make stable returns, you can multiply your income by a factor of x10 overnight. It might be a factor of an x100, it just depends on how big your balls are. So whenever you want to quit, think of what life could have been like if you persisted!
🚫 A loss is a part of the learning process!
You will lose multiple accounts. There is no way around it! This is your way of learning, and no one has created a different one so far. You might be as good as a God on demo, but the moment you enter the real world emotions kick in and you will have to learn a lot again. So when entering trading, be prepared to pay the market a fair price for educating you. And remember that the reward is much greater still!
📰 READ THE NEWS - Current events can affect the markets!
This one is certainly not for beginners! If you start doing that from the start, it will be too much info for you and you will get lost in the constant swirl of hot air that surrounds the markets. But once your strategy is good enough and you are beginning to be profitable, you might want to start paying attention to the key events and dates that might have an effect on your trading. I never actively trade fundamentals myself, but who said that you shouldn't?
🤏 Keep in mind big political events that can cause big moves!
This! If the FOMC meeting is tomorrow, you better close all your positions today, because whatever analysis you made might get invalidated by what the FED minutes bring to the market. We are playing probabilities that we can predict based on past experience, but whoever is trying to predict the FED and the market's reaction to it is fooling themselves, so once such a whale enters the room our ability to predict rationally vanished, thus we need not trade that day at all. And the FOMC is just an obvious example. Important statistical data such as CPI, jobs, etc might affect the pair you are trying to trade, and you better know about it. As a famous trader’s saying goes «Not being in the Market Is a position too»
🆕 UPDATE YOUR TECHNOLOGY - Slow internet connection or an old computer might make you miss your trade!
There is a side note yet do not neglect your workstation. Don't let it be dirty or messy, and make sure your equipment, i.e. a computer or a smartphone work properly. Missing a trade because of a bug is SUCH a pain! You don’t want that, right?
📈And not trading update charts is even worse as some level breakouts can happen in seconds.
That one is less relevant today thanks to tradingview charts being awesome, yet always make sure that the data on the chart is given to you without a delay. Trading a setup that ain’t there anymore is not good…
🦉📚 These are the «words of wisdom» that came to my head today, and I really hope I helped some of you get back on track, or begin your path as a trader with a slightly better understanding of what is ahead of you.
❗️ JUST REMEMBER: IT IS POSSIBLE! But it will take time, money, and effort, so brace yourselves, and may the odds be always in your favor!
💖Adios, Amigos! Give me a like and comment, if you agree with what I said!💖

How to Assess Your Trading Performance|Consistency & Perspective
Hey traders,
👨🏻💻I am trading forex for more than 8 years.
During the last 5 years, I am actively posting my analysis & trades on TradingView.
Growing my audience, it was very peculiar for me to contemplate the reaction of my followers to my trading performance.
(by the way, we must say thanks to tradingview where the posting system does not allow to delete the posted trades so that each and every author is easily backtestable).
👩👩👧👧👨👨👧👧Those who follow me at least a half a year know that occasionally I have winning streaks when 9 out of 10 of my forecasts play out nicely. Sometimes, however, I face the drawdowns and catch a sequence of losing trades.
And sometimes the performance is mixed with the probabilities being on my side slightly.
🥇While the reaction to winning streaks is quite predictable:
I am praised by the members and get nice tips.
The reaction to losing streaks is worth discussing in detail.
It turned out that quite a huge portion of a trading community has a completely wrong understanding of a trading nature.
🤬The single loss is considered by them to be a failure, a mistake.
Facing the sequence of losses, they quickly become negatively biased to the person that they have just recently praised.
With the continuation of a drawdown, they blame the analyst and launch a barrage of criticism towards him.
🔍Then they are in a search again. They are looking for a trader that will be constantly right. Catching the new one during a winning streak, the cycle repeats.
At some moment such people become disappointed in trading and drop this business...
❗️Losses, losing streaks and negative days/weeks/months are inevitable. If you want to become a full-time trader, you must be prepared for the fact that trading won't give you a stable income.
Your equity curve will be in constant fluctuation.
Your goal in this game is simply to lose less than you make.
You must become disciplined enough to keep following the rules of your trading strategy no matter what.
You must learn to be consistent in your actions.
You should learn to perceive losing trades not as a failure but simply as the moment when the market takes its share.
Feeding you, giving you the opportunity to make money out of thin air,
the market definitely has a right to claim its dividends from you.
⭐️Change your mindset, learn to lose and the magic thing will happen.
❤️Please, support this idea with a like and comment!❤️

YOUR PROFIT FORMULA | Three Essential Ingredients 🤔💭💫
Hey traders, We must admit that it is phenomenally difficult to become a consistently profitable trader.
This journey requires years of practicing and training, constant losses, and nervous breakdowns.
If you are a struggling trader, if you are still looking for your way to succeed in this game, here is the formula that will help you to chase consistent profits.
💰Consistent profits = 📝Trading Strategy + 🤬Emotions + 📈Market Sentiment
Let's discuss each element separately.
📝Trading Strategy:
To be in profit in a long run requires an understanding of what do you actually trade.
You must have strict and objective entry conditions.
You must rely on the objective & verifiable rules for the execution of market analysis.
You must have a plan to follow.
A plan that is backtested and proved its efficiency.
🤬Emotions:
Even the best trading plan, the most accurate trading strategy can be easily beaten by emotions.
Emotional decisions such as revenge trading and early position close
can easily blow the account of any size in a blink of an eye.
The most disappointing thing to note right here is the fact that you can be taught how to execute technical analysis but you can not be taught to control your emotions.
Your main enemy here is yourself and being in a constant battle with your greed and fear it is very easy to go broke.
Only by being humble, disciplined and patient, you can successfully apply a trading strategy.
📈Market Sentiment:
Mastering your emotions and having studied a trading strategy, it looks like it is finally the time to make money.
However, occasionally the market tends to be irrational.
Being chaotic and unpredictable, sometimes the market neglects every technical and fundamental rule.
Crisis, euphoria: the reasons can be different.
The fact is that such things happen.
And it is your duty to learn to deal with unfavorable market conditions.
💰To become a consistently profitable trader, you must become the master of these three elements.
Only then the doors to freedom and independence will be opened to you.
❤️Please, support this idea with a like and comment!❤️

History of Forex | From Ancient to the Modern Day
We have come a long way from the previously practiced barter system to the modern-day system of trading currency. Following is a brief summary of the evolution of currency and how it gave rise to Forex Trading.
Here are the main stages that are illustrated on the chart:
1️⃣The Ancient system of Trading - Trading with Gold
As early as 6th century BC, the first gold coins were produced, and they acted as a currency because they had critical characteristics like portability, durability, divisibility, uniformity, limited supply and acceptability.
2️⃣Bank Notes Originated - Deposited Gold in banks in exchange for banknotes
3️⃣Role of Geography - Various banks of different regions printed different currencies
Gold Standard - Currency pegged to gold
In the 1800s countries adopted the gold standard. The gold standard guaranteed that the government would redeem any amount of paper money for its value in gold. This worked fine until World War I where European countries had to suspend the gold standard to print more money to pay for the war.
4️⃣Bretton Woods System - Currency pegged to USD
The first major transformation of the foreign exchange market, the Bretton Woods System, occurred toward the end of World War II.
The Bretton Woods Accord was established to create a stable environment by which global economies could restore themselves. It attempted this by creating an adjustable pegged foreign exchange market. An adjustable pegged exchange rate is an exchange rate policy whereby a currency is fixed to another currency. In this case, foreign countries would 'fix' their exchange rate to the US Dollar.
5️⃣Birth of Floating Currency - Currency that is not pegged to any assets or other currencies is known as a 'floating currency'.
And what will be next?
Very hard to say but blockchain technologies will make the system change again.
❤️Please, support this educational post with a like and lovely comment❤️

Learn How to Trade Double Bottom Formation | Full Guide 📚
Hey traders,
If you are learning price action trading, you definitely must know a double bottom pattern.
Double bottom is a reversal pattern.
It is applied to spot early market reversal clues and catch the initiation of a new bullish trend.
Preconditions for a double bottom:
1️⃣ The market must trade in a bearish trend.
2️⃣ After a formation of the last lower high, the price must set equal low.
3️⃣ The price must return back to the last lower high level.
✅Once these conditions are met the pattern is considered to be completed.
The formation of the pattern is considered to be a ⚠️WARNING sign.
Even though many traders buy the pattern once it is completed,
for me it is not enough.
❗️Remember that the price can easily start to consolidate and form a horizontal channel for example.
The trigger that we will look for is the breakout (candle close above) the last lower high level (based on a wick and its highest candle close) - the neckline.
Being broken to the upside, the market sets a new higher high.
It signifies a violation of a current bearish trend.
⬆️Attempting to catch an initiation of a bullish trend, we will buy the market with a buy limit order on a retest of a broken neckline.
❌Safest stop will lie below the lows of the pattern.
💰Your reward must be at least 1.5 of your risk.
Following these simple rules, you will be impressed by how accurate this pattern is!
❤️Please, support this idea with a like and comment!❤️

PSYCHOLOGY OF A TRADER | MASTER EMOTIONS & MASTER THE MARKET
The market is driven by people.
The crowds are always behind strong market rallies.
What the majority fails to recognize is the fact, that being chaotics in its nature, the markets are always trading in predictable patterns.
Believe it or now, but the market participants are driven by the same emotional impulses. It does not really depend on how wealthy is the person.
With the core motive being to make a ton of money with a little risk possible, we can derive a universal archetype.
Every asset, every financial instrument has an element of a "potential value". Being 100% subjective, an attempt to calculate the future value drives the market.
Depending on the current expectation of the crowd and its emotions it is necessary for a professional trader to learn to play with its behavior.
With many years of constant observations, the cyclic psychological curve was derived to explain the relationships between our emotions and market cycles.
On the chart, I have drawn 9 main stages of trader's psychology:
😶INDIFFERENCE - No opportunities are spotted, searching for the right pick.
🙂OPTIMISM – Positive outlook leading us to buy a certain asset
😃EXCITEMENT – Being initially right in our pick, we feel excited as bulls push the market to the new highs
The moment of happiness and feeling of being "a true investor"
🤑GREED – Being thrilled we start to ignore warning signs and add more and more cash to the market believing that the market will never stop.
😕ANXIETY – The market starts taking our gains back. Being biased and nihilistic we keep holding the position, thinking that it is just a pullback.
😩PANIC – Tremor. We are frozen. Emotions are draining our power. We are clueless and helpless. We totally lose the sense of control.
😭DEPRESSION – Position is closed. Money is lost. Considering trading & investment industry to be a scam.
🤔HOPE – The dawn. The market returns back to its normal state. Aspiration & desire to start again.
😆RELIEF – Again we start to believe in our strength. We return and the cycle repeats.
Do you recognize yourself in these stages?
Please, support our work with like and comment. It really helps.

PSYCHOLOGY OF A TRADER | MASTER EMOTIONS & MASTER THE MARKET
The market is driven by people.
The crowds are always behind strong market rallies.
What the majority fails to recognize is the fact, that being chaotics in its nature, the markets are always trading in predictable patterns .
Believe it or now, but the market participants are driven by the same emotional impulses . It does not really depend on how wealthy is the person.
With the core motive being to make a ton of money with a little risk possible, we can derive a universal archetype .
Every asset, every financial instrument has an element of a "potential value" . Being 100% subjective, an attempt to calculate the future value drives the market.
Depending on the current expectation of the crowd and its emotions it is necessary for a professional trader to learn to play with its behavior.
With many years of constant observations, the cyclic psychological curve was derived to explain the relationships between our emotions and market cycles.
On the chart, I have drawn 9 main stages of trader's psychology:
😶 INDIFFERENCE - No opportunities are spotted, searching for the right pick.
🙂 OPTIMISM – Positive outlook leading us to buy a certain asset
😃 EXCITEMENT – Being initially right in our pick, we feel excited as bulls push the market to the new highs
The moment of happiness and feeling of being "a true investor"
🤑 GREED – Being thrilled we start to ignore warning signs and add more and more cash to the market believing that the market will never stop.
😕 ANXIETY – The market starts taking our gains back. Being biased and nihilistic we keep holding the position, thinking that it is just a pullback.
😩 PANIC – Tremor. We are frozen. Emotions are draining our power. We are clueless and helpless. We totally lose the sense of control.
😭 DEPRESSION – Position is closed. Money is lost. Considering trading & investment industry to be a scam.
🤔 HOPE – The dawn. The market returns back to its normal state. Aspiration & desire to start again.
😆 RELIEF – Again we start to believe in our strength. We return and the cycle repeats.
Do you recognize yourself in these stages?
Please, support our work with like and comment. It really helps.

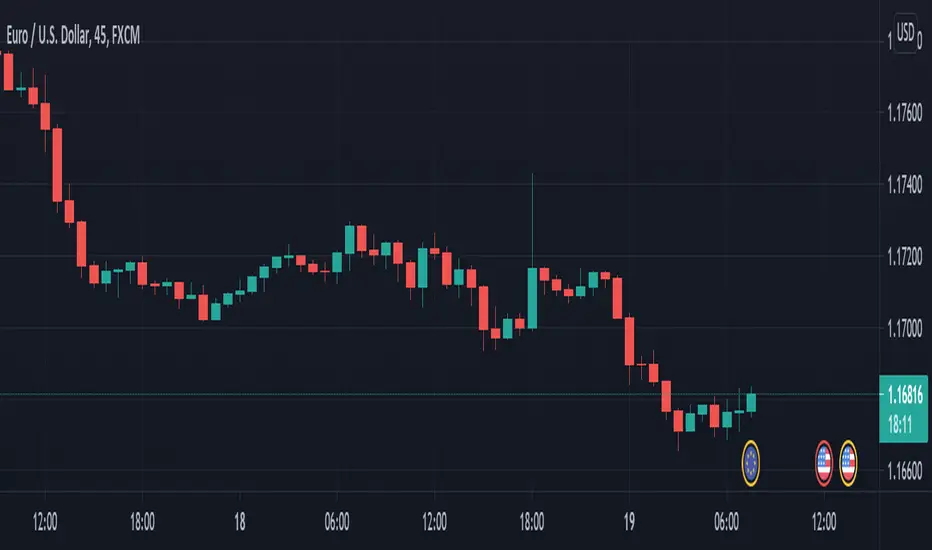
SPOTTING EARLY TREND REVERSAL | EURUSD
Hey traders,
As you know, I am very bearish biased on EURUSD.
On a daily, the price respected a major key level and also broke a rising wedge pattern to the downside.
On intraday time frames, with classic price action rules, we can easily spot a trend reversal :
The price was trading in a bullish trend .
The uptrend was confirmed by a sequence of higher highs and higher lows .
1.2267 is a local structure high .
After a retracement to a new higher low the price set a lower high (a very important bearish clue).
Then the price violates a previous higher low level to the downside setting a new lower low .
With a sequence of two lower lows and lower high, we can confirm a bullish trend violation and initiation of a new bearish trend on 8H chart.
Now we are waiting for the completion of a retracement leg in a zone between current spot prices and the level of a previous lower high
and a consequent bearish continuation.
❤️ Please, support this idea with a like and comment! ❤️
⬇️ Subscribe to my social networks! ⬇️
