Candlestick Rejection Strategy!
What it is?
Candlestick rejection strategy is a pure price action swing trading strategy. It makes use of the concept of price rejection or candlestick rejection patterns to invalidate counter-trend momentum for a trade continuation.
By applying such candlestick rejection strategy onto swing trading, it allows trades to capture spots at which market prices are at rest during retracements before rejoining back the existing dominant trend.
How to use?
Some trade recommendation for such candlestick rejection strategy is to use it as a candlestick rejection pattern on counter-trend moves. This means that we pick candlestick rejection pattern only for the sake of searching for breakout continuation with the dominant trend at counter trend waves.Entry can be made after the breakout occurs at the high or low of The Mother Bar and stop loss order can be placed at the opposing breakout side's high or low.
Further trade help can also be incorporated to help increase the trade's probability of success. For instance, it can be used together with other technical tools such as dynamic moving averages and Fibonacci retracement tool. Some may even want to consolidate other trading strategies to further increase trade’s probability of success.
Thank you for reading, we hope you enjoyed our educational effort!
Tradingbasics

Learn How to Trade | Why to Analyse Multiple Time Frames 📚
Hey traders,
In this educational video, we will discuss why Top-Down Analysis
is so important and how to apply it in practice.
The video includes important theory and real market examples.
❤️Please, support this video with like and comment!❤️

WHAT IS DRAWDOWN | 3 Types Of Drawdown Explained 📚
Hey traders,
In my videos, I frequently use the term "drawdown".
Many of you asked me to explain the meaning of that term and share some examples.
The account drawdown is the highest observed loss from the highest
value of the deposit to the lowest value of the deposit at
a certain period of time.
Imagine you started to trade with 10,000$ account.
At the end of the year, your account size reached 15,000$.
However, at some point through the year the deposit value dropped to 6,000$. It was the absolute minimum for the one-year period.
At some point, your net loss was -4,000$ or 40% of your account balance.
The account drawdown is 40%.
❗️Knowing the account drawdown is very important for the risk assessment of the trading strategy. Usually, 50% and bigger drawdown signifies an extremely high risk.
There are 3 types of drawdown to know.
Current drawdown - a temporary drawdown associated
with the negative total value of opened trading position(s)
at present.
Once you start trading with 10,000$ deposit, you open several trading positions. Being opened, with the constant price movements, your potential gains fluctuates from positive to negative.
For examples, with 3 active trades: EURUSD (-500$ at present); GBPUSD (+200$ at present); GOLD (-100$ at present) your current account drawdown is -400$ or 4% of your deposit.
Fixed drawdown - the negative value of the closed trading
position(s) at present for a certain period of time.
While some of your trades remain active, some are already closed.
Imagine the same deposit - 10,000$.
On Monday you opened 6 trades, 2 still remain active and 4 are already closed. Your total loss from your closed trades is -500$. Your fixed Monday's drawdown is 5%.
Maximum Drawdown - the maximum observed loss from
the highest value of the deposit before a new maximum
is reached.
Starting to trade with 10,000$ you are already trading for 5 years.
Your account were growing rapidly and at some moment it reached 25,000$. Then the recession started. You faced a dramatic loss of 12,500$ before you started to recover.
That was the maximum observed loss for the period.
Your maximum account drawdown was 50%.
❗️Different types of drawdown give a lot of insights about a trading strategy. Its proper assessment will help to spot a high risk strategy and to find a conservative one.
Constantly monitor your account drawdown and always check the numbers.
What is your highest account drawdown?
❤️If you have any questions, please, ask me in the comment section.
Please, support my work with like, thank you!❤️

Learn TOP 5 Tips For Trade Management 📖
Hey traders,
In this post, I will share with you my tips for trade management.
But first, let me elaborate on what is exactly a trade management.
Trade management is the set of rules and techniques applied for managing of an already active position.
Trade management is a very important element of any trading strategy that should never be neglected.
1. Never remove a stop loss
Being in a huge loss, many traders refuse to admit that they are wrong. Instead, watching how the price moves closer and closer to a stop loss, they remove stop loss hoping on a coming reversal.
The alternative situation may happen when the price is going sharply in the desired direction. Watching the increasing profits, traders remove a stop loss, being afraid to miss bigger profits.
Both situations may lead to substantial, higher than initially planned losses. Driven by many factors, the market can easily burn all gains and move against the desired direction much longer than traders stay solvent.
For these reasons, never remove a stop loss. It must be always set.
2. Never modify your stop loss if a position is in loss
Watching how the price moves closer and closer to a stop loss is painful. Instead of removing stop loss, some traders move it and give the market more space for reversal.
Even though such a technique is safer than the complete stop loss removal, it is still a very bad habit.
Each stop loss adjustment increases the potential loss, not giving any guarantees that the market will reverse.
It is highly recommendable to keep your stop loss fixed and let the price hit it and admit the loss.
3. Know in advance your profit protection strategy
Where do you take your profit?
Do you have a fixed tp level or do you apply trailing stop?
You should always know the answers.
Coiling around take profit level but not being able to reach it, the price makes many traders manually close the trade or move take profit closer to current price levels.
Another common situation happens when the market so quickly reaches the desired TP level so the traders remove TP hoping to make bigger than initially planned profit.
Such emotional interventions negatively affect a long-term trading performance. TP removal may even burn all profits.
Do not let your greed intervene, and always follow your rules.
4. Never add to a losing position
Watching how the price refuses to go in the intended direction and cutting a partial loss, many traders add to a losing trade in hopes that the market will reverse and all the losses will be recovered.
Again, such a fallacy usually leads to substantial losses.
Remember, you can add to a position only AFTER the market moved in the desired direction, not BEFORE.
5. Close the trades manually only following rules
Quite often, newbie traders manually close their trades because of some random factors:
they saw someone's opposite view, or they simply changed their mind.
Remember, that if you opened a trade following your trading plan, you should always have strict rules for a position manual close. Do not let random factors affect your trading.
Following these 5 simple tips, your trading will improve dramatically. Remember, that it is not enough to spot and accurate entry. Once you are in a trade, you should wisely manage that, following your plan.
❤️If you have any questions, please, ask me in the comment section.
Please, support my work with like, thank you!❤️

Learn How to Trade Head & Shoulders Pattern | Full Guide 📚
Learn my step-by-step guide for Head & Shoulders pattern trading.
This video includes important theory and real market examples.
❤️Please, support this video with like and comment!❤️

Trading Psychology | How to Perceive Your Trades 👁
Hey traders,
In this post, we will discuss a common fallacy among struggling traders: overestimation of a one single trade.
💡The fact is that quite often, watching the performance of an active trading position, traders quite painfully react to the price being closer and closer to a stop loss or, alternatively, coiling close to a take profit but not being managed to reach that.
Fear of loss make traders make emotional decisions:
extending stop loss or preliminary position closing.
The situation becomes even worse, when after the set of the above-mentioned manipulation, the price nevertheless reaches the stop loss.
Just one single losing trade is usually perceived too personally and make the traders even doubt the efficiency of their trading system.
They start changing rules in their strategy, then stop following the trading plan, leading to even more losses.
❗️However, what matters in trading is your long-term composite performance. A single position is just one brick in a wall. As Peter Lynch nicely mentioned: “In this business, if you’re good, you’re right six times out of ten. You’re never going to be right nine times out of ten.”
There are so many factors that are driving the markets that it is impossible to take into consideration them all. And because of that fact, we lose.
The attached chart perfectly illustrates the insignificance of a one trading in a long-term composite performance.
Please, realize that losing trades are inevitable, and overestimation of their impact on your trading performance is detrimental.
Instead, calibrate your strategy so that it would produce long-term, consistent positive results. That is your goal as a trader.
❤️If you have any questions, please, ask me in the comment section.
Please, support my work with like, thank you!❤️

Learn How to Trade Top-Down Analysis | Full Guide 📚
Learn how to trade multiple time frame analysis.
Includes important theory and real market examples.
Entry/stop/targets explained.
❤️If you have any questions, please, ask me in the comment section.
Please, support my work with like, thank you!❤️

HOW TO SET STOP LOSS | 3 STRATEGIES EXPLAINED 📚
Hey traders,
In this post, we will discuss 3 classic trading strategies and stop placement rules.
1️⃣The first trading strategy is a trend line strategy.
The technique implies buying/selling the touch of strong trend lines, expecting a strong bullish/bearish reaction from that.
If you are buying a trend line, you should identify the previous low.
Your stop loss should lie strictly below that.
If you are selling a trend line, you should identify the previous high.
Your stop loss should lie strictly above that.
2️⃣The second trading strategy is a breakout trading strategy.
The technique implies buying/selling the breakout of a structure,
expecting a further bullish/bearish continuation.
If you are buying a breakout of a resistance, you should identify the previous low. Your stop loss should lie strictly below that.
If you are selling a breakout of a support, you should identify the previous high. Your stop loss should lie strictly above that.
3️⃣The third trading strategy is a range trading strategy.
The technique implies buying/selling the boundaries of horizontal ranges, expecting bullish/bearish reaction from them.
If you are buying the support of the range, your stop loss should strictly lie below the lowest point of support.
If you are selling the resistance of the range, your stop loss should strictly lie above the highest point of resistance.
As you can see, these stop placement techniques are very simple. Following them, you will avoid a lot of stop hunts and manipulations.
How do you set stop loss?
❤️If you have any questions, please, ask me in the comment section.
Please, support my work with like, thank you!❤️

LEARN HARMONIC PATTERNS TRADING | ABCD PATTERN 🔰
Hey traders,
Harmonic ABCD pattern is a classic reversal pattern.
This pattern is composed of 3 main elements (based on wicks of the candles):
1️⃣ AB leg
2️⃣ BC leg
3️⃣ CD leg
The pattern is considered to be bullish if AB leg is bearish.
The pattern is considered to be bearish if AB leg is bullish.
AB leg must be a strong movement without corrections within.
A is its initial point and B is its completion point.
BC leg is a correctional movement from B point after a completion of AB leg. The price may fluctuate within that.
B is its initial point and C is its completion point.
CD leg must be a strong movement without corrections within.
C is its initial point and D is its completion point.
❗️ABCD movement is harmonic if the length and the time horizon of AB and CD legs are equal.
By the length, I mean a price change from A to B point and from C to D point.
By the time, I mean a time ranges of AB leg and CD leg.
If the time and length of AB and CD legs are equal, the pattern is considered to be harmonic, and a reversal will be expected from D point at least to B point.
🛑If the pattern is bullish, stop loss must be placed below D point.
🛑If the pattern is bearish, stop loss is placed above D point.
Initial target level is B point.
Usually, after reaching a B point the market returns to a global trend.
What pattern do you want to learn in the next post?
❤️If you have any questions, please, ask me in the comment section.
Please, support my work with like, thank you!❤️

Learn How to Spot & Trade Consolidation | Full Guide 📚
Learn how to identify consolidation.
Price action based rules.
Directional bias & trading strategy explained.
3 states of the market explained.
❤️Please, support this video with like and comment!❤️

Learn How to Trade Double Top Formation | Full Guide 📚
Your ultimate guide for double top pattern trading.
Entry selection / stop placement / target selection explained.
Meaning of the pattern and identification rules.
Important tips & real market exampe.
❤️Please, support this video with like and comment!❤️

Learn Ascending Triangle | Classic Price Action Pattern 📚
Hey traders,
In this educational video, I will teach you how to identify an ascending triangle.
We will discuss the structure and the bias of this patter
and how to apply that in analysis.
❤️If you have any questions, please, ask me in the comment section.
Please, support my work with like, thank you!❤️

What is Spread in Trading | Trading Basics 📚
Hey traders,
It turned out that many newbie traders completely neglect spreads in their trading.
In this post, we will discuss what is the market spread and how it can occasionally spoil a seemingly good trade.
💱No matter what financial instrument we trade, in order to buy the asset we need to have a counterpart that is willing to sell it to us and vice versa, if we want to sell the asset, we need to have someone to sell it to.
The market provides a convenient exchange between buyers and sellers. The asset price is determined by a current supply and demand.
However, even the most liquid markets have two prices: bid and ask.
🙋♂️Ask price represents the lowest price the market participants are willing to sell the asset to you, while 🙇♂️bid price shows the highest price the market participants are willing to buy the asset from you.
Bid and ask price are almost never equal. The difference between them is called the spread.
📈The spread size depends on liquidity of the market.
📍Higher liquidity implies bigger trading volumes and greater number of market participants, making it easier for them to make an exchange.
On such markets we see lower spreads.
📍From the other side, less liquid markets are categorized with low trading volumes, making it harder for the market participants to find a counterpart for the exchange.
On such market, spreads are usually high.
For example, current EURUSD price is 1.0249 / 1.0269.
Bid price is 1.0249 - you open short position on that price.
Ask price is 1.0269 - you open long position on that price.
The spread is 2 pips.
❗️Spreads must always be considered in a calculation of a risk to reward ratio for the trade. For scalpers and day traders, higher than usual spread may spoil a seemingly good trade.
Always check spreads before you open the trade.
In 2020, for example, we saw unusually high spreads on Gold during UK/NY trading sessions. Spreads were so high that I did not manage to open a trade for a couple of days.
Not considering spreads in such a situation would cost you a lot of money.
Do you consider spread when you trade?🤓
❤️If you have any questions, please, ask me in the comment section.
Please, support my work with like, thank you!❤️

THE MOST IMPORTANT FOREX FUNDAMENTALS 📰
Hey traders,
Even though I am a pure technician and I rely only on technical analysis when I trade, we can not deny the fact that fundamentals are the main driver of the financial markets.
In this post, we will discuss the most important fundamentals that affect forex market.
📍Unemployment rate.
Unemployment rate reflects the percentage of people without a job in a selected country or region.
Rising unemployment rate usually signifies an unhealthy state of the economy and negatively affects the currency strength.
📍Housing prices.
Housing prices reflect people's demand for housing. Rising rate reflects a healthy state of the economy, strengthening purchasing power of the individuals and their confidence in the future.
Growing demand for housing is considered to be one of the most important drivers in the economy.
📍Inflation.
Inflation reflects the purchasing power of a currency.
It is usually measured by evaluation of the price of the selected basket of goods or services over some period.
High inflation is usually the primary indicator of the weakness of the currency and the unhealthy state of the economy.
📍Monetary policy.
Monetary policy is the actions of central banks related to money supply in the economy.
There are two main levers: interests rates and bank reserve requirements.
Higher interest rates suppress the economy, making the currency stronger. Lower interests rates increase the money supply, making the economy grow but devaluing the national currency.
📍Political discourse.
Political discourse is the social, economical and geopolitical policies of the national government.
Political ideology determines the set of priorities for the ruling party that directly impacts the state of the economy.
📍Payrolls and earnings.
Payroll reports reflect the dynamic of the creation of new jobs by the economy, while average earnings show the increase or decrease of the earnings of the individuals.
Growing earnings and payrolls positively affect the value of a national currency and signify the expansion of the economy.
Pay closes attention to these fundamentals and monitor how the market reacts to that data.
What fundamentals do you consider to be the most important?
❤️If you have any questions, please, ask me in the comment section.
Please, support my work with like, thank you!❤️

Trading Sessions in Forex | Trading Basics 🕰🌎
Hey traders,
In this post, we will discuss trading sessions in Forex.
Let's start with the definition:
Trading session is daytime trading hours in a certain location.
The opening and closing hours match with business hours.
For that reason, trading hours are varying in different countries because of contrasting timezones.
❗️Please, note that different markets may have different trading hours.
Also, some markets have pre-market and after-hours trading sessions.
In this post, we are discussing only forex trading hours.
The forex market opens on Sunday at 21:00 GMT
and closes on Friday at 21:00 pm GMT.
There are 4 main trading sessions in Forex:
🇦🇺 Australian (Sydney) Session Opens at 21:00 GMT and closes at 06:00 GMT
🇯🇵 Asian (Tokyo) Session Opens at 12:00 GMT and closes at 9:00 GMT.
🇬🇧 UK (London) Session Opens at 7:00 GMT and closes at 16:00 GMT.
🇺🇸 US (New York) Session Opens at 12:00 GMT and closes at 21:00 GMT.
Asian trading session is usually categorized by low trading volumes
while UK and US sessions are categorized by high trading volumes.
Personally, I trade the entire UK session and US opening and usually skip Australian and Asian sessions.
What trading sessions do you trade?
❤️If you have any questions, please, ask me in the comment section.
Please, support my work with like, thank you!❤️

Types of Orders In Trading | Trading Basics 🤝💱
Hey traders,
In this post, we will discuss types of orders that we use in Forex trading.
➖ Market order.
Trading position is opened at a current price level.
Buying the asset, you will open a trading position at a current ask price.
Selling the asset, you will open a trading position at a current bid price.
Even though market order is the most preferable type of orders among newbie traders, I highly recommend not to use that, especially if you are a day trader.
❗️The main problem is that prices constantly fluctuate and there is a certain delay between order execution and position opening. For these reasons, the position will be opened from a random price level within the range where the market is currently staying, affecting a risk to reward ratio.
➖ Limit order.
Trading position will be opened only from a desired price level.
With buy limit, you will buy the asset from a certain level.
(current price remains above the order)
With buy stop order, you will buy the asset from a certain level.
(current price remains below the order)
With sell limit, you will sell the asset from a certain level.
(current price remains below the order)
With sell stop, you will sell the asset from a certain level.
(current price remains above the order)
That is the order type that I prefer. Limit order helps you to trade from a desirable level, automatically executing the order once it is reached, letting you preliminary set it.
❗️However, remember that there is one big disadvantage of that order type: there is no guarantee that the price will reach the desired price level to activate a trading position. For that reason, occasionally you will miss the trades.
Try these order types on a demo account to learn how they work in practice.
Which order type do you prefer?
❤️If you have any questions, please, ask me in the comment section.
Please, support my work with like, thank you!❤️

What is Forex and How Big It Is?💱
Forex - foreign exchange market, is a location where international currencies are bought and sold by economic participants at various exchange rates.
Forex market is the biggest market in the world, reaching on average 6 trillion dollars trading volumes daily.
Forex market is a vital element for a global economy because it provides capital exchanges between the countries.
The main market participants of forex market are central banks, commercial banks, commercial companies, hedge funds and investors.
🕰In order to grasp how big is that market, take a look what is happening on that just in 60 seconds:
📎Total transactions value reaches 3.52 billion US dollars.
📎 1.15 billion dollars of spot transactions.
📎 1.65 billion dollar of exchange swaps.
📎 Total transactions value involving USD reaches 3 billion US dollars.
📎 Total transactions value involving EURO reaches 1.1 billion US dollars.
📎 Just one single EUR/USD pair accumulates 812 million US dollars transactions value.
It is hard to imagine how such big amounts are rolling with such a frequency and how insignificant are the orders of individual traders.
❤️If you have any questions, please, ask me in the comment section.
Please, support my work with like, thank you!❤️

Are You Ready to Trade Full Time? 4 Essential Signs ⭐
Hey traders,
Once you mature in trading and become a consistently profitable trader, the question arises: are you ready to trade full time?
Becoming a full time trade is a very significant step and my things must be taken into consideration before you make it.
✨Becoming a full time trader implies that you quit your current job, that you give up a stable income - your salary.
In contrast to classic job, trading does not give guarantees. Please, realize that such a thing as stable income does not exist in trading.
Trading is a series of winning and losing trades, positive and negative periods. For that reasons, remember that in order to become a full time trader, your average monthly trading income must be at least twice as your monthly expenses.
✨Moreover, even if your trading income is sufficient to cover two months of your life, that is still not enough. You must have savings.
Trading for more than 8 years, I faced with quite prolonged negative periods. One time I was below zero for the entire quarter.
For that reason, supporting a family and living a decent life will require savings that will help you not to sink during the losing periods.
✨Another very important sign is your correct and objective view on your trading. Please, realize that if you bought Bitcoin one time and made a couple of thousands of dollars, it does not make you a consistently profitable trader. Please, do not confuse luck with the skill. Your trading must be proven by many years of trading.
✨You must be emotionally prepared for the living conditions that full time trading will bring you.
Being a full time trader implies that you are constantly at home,
you work from home from Monday to Friday.
You do not see your colleagues, your social life will change dramatically.
I know a lot of people who started to trade full time and then realized that they can not work from home for different reasons.
⭐So what are the necessary conditions for becoming a full time traders:
you should have savings that will cover the negative trading periods,
your average monthly trading income should be at least twice as your monthly expenses,
your trading efficiency must be proven by objective, consistent results,
and you must be psychologically prepared for working from home.
When these conditions are met, you can make a significant step and become a full-time trader.
Are you ready to become a full time trader?
❤️If you have any questions, please, ask me in the comment section.
Please, support my work with like, thank you!❤️

3 Types of Charts You Must Know 📈
Hey traders,
In this post, we will discuss 3 most popular types of charts.
We will discuss the advantages and disadvantages of each one, and you will decide what type is the most appropriate for you.
📈Line Chart.
Line chart is the most common chart applied by analysts. Reading financial articles in different news outlets, I noticed that most of the time the authors apply line chart for the data representation.
On a price chart, the only parameter that the one can set is a time period.
Time period will define a time of a security closing price. The security closing prices overtime will serve as data points.
These points will be connected with a continuous line.
Line charts are applied for displaying an asset's price history, reducing the noise from less volatile times.
Being simplistic, they can provide a general picture and market sentiment. However, they are considered to be insufficient for pattern recognition and in depth analysis.
📏Range Bar Chart.
In contrast to a line chart, a range bar chart does not consider time horizon. The only parameter that the one can set is a price range.
By the range, I mean a price interval where the price moves. A new bar will be formed only once the prices passes the desired range.
Such a chart allows to completely ignore time variable focusing only on price movement and hence reducing the market noise.
The chart will plot new bars only when the market is volatile, and it will stagnate while the market is weak and consolidating.
Accurately setting a desired price range, one can get multiple insights analyzing a range bar chart.
🕯Candlestick Chart.
The most popular chart among technicians and my personal favorite.
With just one single parameter - time period, the chart plots candlesticks.
Each candlestick is formed as a desired time period passes.
It contains an information about the opening price level, closing price, high and low of a selected time period.
Candlestick chart is applied for pattern recognition and in-depth analysis. Its study unveils the behavior of the market participants and their actions at a desired time period.
Of course, each chart has its own pluses and minuses. Choosing its type, you should know exactly what information do you want to derive from the chart.
What chart type do you prefer?
❤️If you have any questions, please, ask me in the comment section.
Please, support my work with like, thank you!❤️

5 MUST READ TRADING BOOKS 📚
Hey traders,
You frequently ask me to share a list of trading books that I personally recommend.
In this post, I gathered 5 books every trader must-read.
Please, note that in that list I included the books that changed my perception of trading. Most of them focus on the psychological aspects of trading and do not teach any particular trading strategy.
📕Trading in The Zone by Mark Douglas.
Douglas uncovers the main fallacies of newbie traders. He focuses on the psychological aspect of trading and its tremendous role in this game. Relying on studies of the human psyche the author teaches readers to beat the ingrained mental habits.
📔The Black Swan by Nassim N. Taleb.
Even though that book is not about trading, it uncovers the aspect of probabilities in life and our perception of them. Especially, Taleb focuses on very rare and extremely low probability events that humans frequently neglect in their predictions and the impact of their occurrence in our lives.
📘The Disciplined Trader by Mark Douglas.
One more book from Douglas. This paper describes the mindset of a successful trader, useful habits and traits. It is looking for reasons why most of the traders fail. The author teaches how to properly react to losing and winning trades and changing market conditions.
📙Market Wizards: Interviews with Top Traders by Jack D. Schwager.
Best traders of the entire world share useful insights of trading. Top experts in the industry talk about their journey, about their path to success and share their valuable experience.
📗Trend Following by Michael W. Covel
Trend is our friend. That is the axiom no one doubts. The only problem is that it is not that simple to follow the trend.
In this book, Covel describes a profitable and efficient trend-following trading strategy adopt.
Of course, reading these 5 books does not guarantee that you will become a consistently profitable trader but I consider them to be very impactful. I always said that a proper mindset is one of the most important things in trading and these books will help you to build it.
Did you read these books?
❤️If you have any questions, please, ask me in the comment section.
Please, support my work with like, thank you!❤️

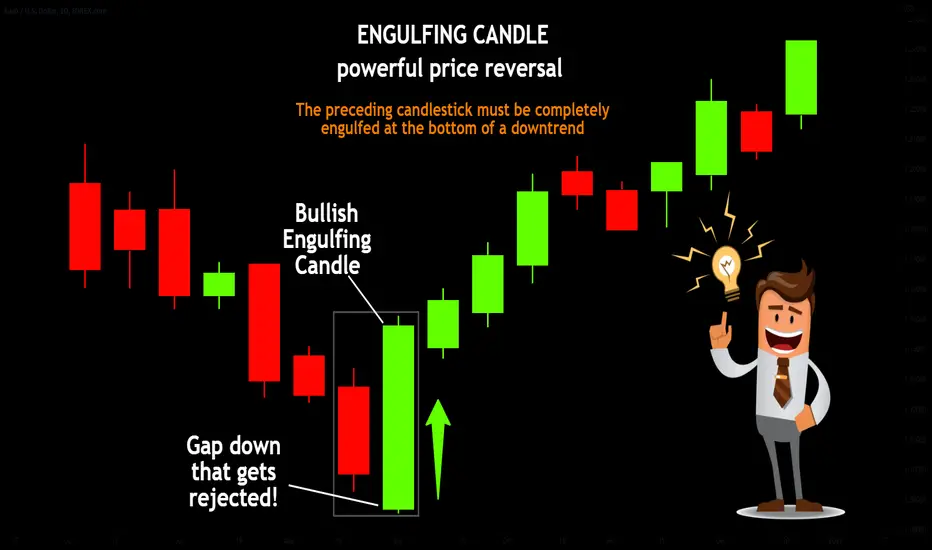
ENGULFING CANDLE | powerful price reversal📚
✅The engulfing model (external bar) is mainly a reversal pattern (although in rare cases it may indicate a continuation of the trend). It looks like two candles, the first of which is small, and the second is large, with a body larger than the entire previous candle, and directed in the opposite direction.
✅From the point of view of crowd movement, such a pattern means that the strength of the current trend is drying up (this is evidenced by the small size of the first engulfing candle). The crowd does not know in which direction to move and, figuratively speaking, is marking time. The appearance of a powerful candle that absorbed the previous one and closed in the opposite direction marks the beginning of a new, strong trend.
⚠️There are several mandatory conditions that the pattern must meet in order for its signal to provide the maximum probability of working out:
1️⃣Before the pattern itself, there must be a downtrend or an uptrend in the market. The movement may be small, but its presence is mandatory;
2️⃣The body of the second candle should be of a different color and orientation (bearish after bullish and bullish after bearish). Shadows may not be absorbed, but then the signal is considered weaker;
3️⃣The body of the second candle should have a contrasting color with respect to the body of the first. The exception is when the body of the first candle is very small (doji or close to it).
❤️ Please, support our work with like & comment! ❤️
3 Important Terms Every Trader Must Know | Trading Basics📚
Hey traders,
In this post, we will discuss 3 very important market situations that every trader must be able to recognize: breakout, retest, and fakeout.
❗️Please, note that the essential element of all these terms is structure: vertical and horizontal key levels.
📍Breakout is a situation when the market breaks the identified horizontal support or resistance, or a vertical trend line.
Breakout is a very important event that signifies the willingness of buyers/sellers to violate the structures. Violation of support signifies a strong selling pressure while a violation of resistance signifies a high buying momentum.
Usually, the structure breakout is confirmed with a candle close.
For confirmation of a breakout of support, a candle close below that is needed.
For confirmation of a breakout of resistance, a candle close above is required.
📍Retest is the situation when the price returns back to broken horizontal support or resistance, or a vertical trend line after a confirmed breakout.
For a structure breakout, high trading volumes are needed. Usually, after a breakout, the market participants are locally exhausted and a correctional movement follows. That may lead to a retest of a broken structure.
Most of the time, after a retest a strong impulse follows. For that reason, for many traders, the retest is applied for trading entries.
📍Fakeout or false breakout is the situation when the price has not enough strength to maintain its direction after a retest of a broken structure. Instead, the market returns back below/above the broken resistance/support.
Fakeout is one of the main reasons, why structure traders lose money.
One of the ways to avoid fakeout is to monitor trading volumes during a structure breakout. A volume spike is needed to confirm the strength of the market participants while low volumes most of the time signify a manipulation.
Learn to spot breakouts and false ones, and try to trade on a retest.
Let me know what do you want to learn in the next post?
❤️If you have any questions, please, ask me in the comment section.
Please, support my work with like, thank you!❤️

Candlestick Action | How Candles Are Formed🕯
❗️Japanese candlesticks as a technical analysis tool were invented earlier than others, but they were not widely used immediately. By the name, it is easy to guess that Japan became the "homeland": local rice traders used this method already in the 18th century. However, due to the geographical remoteness and closeness of the country from external "visitors", this type of chart gained popularity much later, when exchange life was already actively boiling in Europe and the USA.
✅What is hidden behind the candlestick chart?
🟢A candle is formed from 4 prices: opening, closing, high and low for a certain period of time. If we take a timeframe of a minute, then each candle will indicate the price movement within this minute, if an hour is inside an hour, if a day is inside a day. The distance between the opening and closing price is the "body" of the candle, and the tails show to what lows and highs the price reached. If the opening price was higher than the closing price, then the candle will be black; and vice versa: if the opening price is lower than the closing price, then the candle will be white. It turns out that candles are, in fact, the psychology of the market, they most accurately reflect the fears and hopes of its participants.
🟢The charts of Japanese candlesticks themselves are valuable for analysis: the resulting models are interpreted as models of reversal or continuation of the trend. It is also important to understand: each individual candle or a combination of candles is just a way of depicting the actions and moods of all bidders for the period we have chosen (day/week/ month, etc.). The fact is that human behavior is quite formulaic in the same situations, and that is why various methods of chart analysis are so popular with investors and traders.
🟢Looking at only one or several candlesticks, a "savvy" viewer can easily understand whether the market is set to rise or fall, change the current trend or its continuation, increase the momentum of movement or its attenuation.
⚠️It is important to understand that the behavior of individual bidders develops into a general market movement, which can be "read" using charts of Japanese candlesticks and their basic models. Therefore, your optimal investment decisions will be supported by the most effective moments of entry or exit from the position, which will significantly improve the financial result.
❤️ Please, support our work with like & comment! ❤️
