SAND Sandbox Technical ReboundIf you haven`t sold SAND here:
Then in my opinion, based on the analysis of SAND's chart patterns, I can see the potential bullish signals suggested by the double bottom and falling wedge patterns.
These patterns often indicate a reversal or continuation of the current trend, which makes me optimistic about the stock's future performance. Considering the support found at the double bottom and the narrowing price range in the falling wedge, it appears that buyers are entering the market, and there is potential for an upward price movement.
Given these chart patterns and my analysis, I have set a price target of $0.50. I believe that a technical rebound leading to such a price level is feasible based on the signals observed.
Looking forward to read your opinion about it.
Tradingcourse

VET VeChain Falling Wedge Pattern Vechain (VET) currently finds itself at the end of a falling wedge pattern, which could potentially indicate a bullish reversal in the near future. This technical pattern suggests that selling pressure has been gradually decreasing, while buyers may start to regain control.
Considering this chart pattern, there is a possibility of a technical rebound for Vechain, with a potential target price of $0.022.
Looking forward to read your opinion about it!

DOT Polkadot Double BottomIf you haven`t sold DOT here:
Now DOT (Polkadot) has exhibited a promising chart pattern with the formation of a double bottom, signaling a potential bullish reversal. This pattern suggests that the selling pressure has been absorbed, potentially paving the way for an upward price movement.
With the double bottom formation in place, DOT has the potential to experience a significant rally, and your first price target of $6.25 seems attainable. As market sentiment improves and buying interest increases, DOT could see notable upward momentum.
Looking forward to read your opinion about it!

ADBE Adobe Options Ahead of EarningsAnalyzing the options chain of ADBE Adobe prior to the earnings report this week,
I would consider purchasing the 460usd strike price Calls with
an expiration date of 2023-7-21,
for a premium of approximately $21.60.
If these options prove to be profitable prior to the earnings release, I would sell at least half of them.
Looking forward to read your opinion about it.

KR The Kroger Options Ahead of EarningsAnalyzing the options chain of KR The Kroger prior to the earnings report this week,
I would consider purchasing the 45usd strike price Calls with
an expiration date of 2023-6-16,
for a premium of approximately $2.04.
If these options prove to be profitable prior to the earnings release, I would sell at least half of them.
Looking forward to read your opinion about it.

GRT The Graph migration to ArbitrumIn my opinion, despite the majority support for The Graph Improvement Proposal and the planned migration to Arbitrum, there are potential concerns for the GRT crypto token. The shift to Arbitrum, as an off-chain solution, may introduce uncertainties and risks that could impact the token's value.
Furthermore, the support level of $0.052 could be a significant point to monitor, as breaching that level may trigger additional selling pressure and potential downward momentum for GRT.
Looking forward to read your opinion about it!

QNT Quant Cryptocurrency Buy AreaQNT Quant is not a bad project, but still not a buy for me!
In my opinion, QNT (Quant) crypto appears to address a significant challenge in the blockchain space by focusing on bridging disparate blockchains. The ability to create multi-chain applications or mApps using Quant seems promising, as it enables enhanced usability and communication between different blockchain networks. This is particularly crucial in the cryptocurrency landscape, where interoperability and seamless connectivity among various projects and platforms can greatly benefit the industry as a whole. By facilitating cross-blockchain communication, Quant has the potential to unlock new possibilities for developers and users, fostering innovation and efficiency within the decentralized ecosystem.
I have a large buy area in which I'm willing to average down if it`s the case: $41 - $71.
looking forward to read your opinion about it.

BinanceUS suspends U.S. dollar depositsIf you haven`t sold BNB here:
Then you should know that BinanceUS, a part of the biggest crypto exchange Binance, has made an announcement regarding changes in its operations. Going forward, the exchange will cease accepting U.S. dollar deposits, and customers will soon no longer have the option to withdraw dollars from the platform.
This decision follows a lawsuit filed by the U.S. Securities and Exchange Commission (SEC) against Binance, its CEO Changpeng Zhao, and the operator of its U.S. exchange. The SEC alleges various misconduct, including artificially inflating trading volumes, misusing customer funds, failing to enforce restrictions on U.S. customers, and providing misleading information about market surveillance controls.
I think BNB will test the $220 support.
Looking forward to read your opinion about it.

JBL Jabil Options Ahead of EarningsAnalyzing the options chain of JBL Jabil prior to the earnings report this week,
I would consider purchasing the 95usd strike price Calls with
an expiration date of 2023-6-16,
for a premium of approximately $3.15.
If these options prove to be profitable prior to the earnings release, I would sell at least half of them.
Looking forward to read your opinion about it.

ATEX Anterix Options Ahead of EarningsAnalyzing the options chain of ATEX Anterix prior to the earnings report this week,
I would consider purchasing the 30usd strike price in the money Calls with
an expiration date of 2023-6-16,
for a premium of approximately $3.90.
If these options prove to be profitable prior to the earnings release, I would sell at least half of them.
Looking forward to read your opinion about it.

LEN Lennar Corporation Options Ahead of EarningsIf you haven`t sold LEN here, for a quick profit:
Then Analyzing the options chain of LEN Lennar Corporation prior to the earnings report this week,
I would consider purchasing the 110usd strike price Puts with
an expiration date of 2023-7-21,
for a premium of approximately $2.67.
If these options prove to be profitable prior to the earnings release, I would sell at least half of them.
Looking forward to read your opinion about it.

GBPAUD regional Double BottomThe GBPAUD currency pair is showing indications of a potential reversal based on a double bottom pattern observed on the regional chart. This pattern suggests that the price has reached a support level twice and is likely to reverse its downtrend.
Traders considering this potential reversal may set a take profit level at 1.870, anticipating an upward price movement towards this target. To manage risk, it is recommended to place a stop loss at 1.851, which serves as a safety measure in case the reversal does not occur as expected.
While the double bottom pattern provides a bullish signal, it's important to exercise caution and consider other factors such as market conditions, fundamental analysis, and overall market sentiment. Technical patterns alone do not guarantee the success of a trade, and monitoring the market closely is essential to adapt to any changes that may occur.
Looking forward to read your opinion about it.

CHFEUR Potential reversal There are signs of a potential reversal in the CHFEUR currency pair. With a take profit level set at 1.027, traders are anticipating a favorable price movement to reach this target. Meanwhile, a stop loss at 1.024 is placed to limit potential losses in case the reversal does not materialize as expected.
It's important to consider that technical analysis provides insights based on historical price patterns and indicators. However, market conditions are subject to change, and there is no guarantee that the anticipated reversal will occur or that the price targets will be reached.

CHFAUD Potential ReversalThere are indications of a potential reversal in the CHFAUD currency pair. The suggested stop loss is set at 1.626, which acts as a risk management tool to limit potential losses if the reversal doesn't materialize as anticipated. On the other hand, the take profit level is identified at 1.647, representing the desired price target.
It's important to note that technical analysis provides insights based on historical price patterns and indicators. However, market conditions can be unpredictable, and there is no guarantee that the anticipated reversal will occur or that the price target will be reached.
Looking forward to read your opinion about it!

LINA Linear Finance Upside PotentialThe recent price action on LINA Linear Finance suggests a potential reversal in the making. The 200-day Moving Average has played a significant role as a strong support level since the golden cross reversal occurred. This bullish signal indicates a shift in momentum and a potential upward trend for LINA.
Considering this technical setup, my price target for LINA is set at the $0.0195 resistance level. If the current bullish momentum continues, breaking through this resistance could open the doors for further upside potential.
Overall, the recent price action and the support from the 200-day Moving Average indicate a potential reversal on LINA Linear Finance, with a price target of $0.0195 as a key resistance level to watch in the coming days.
Looking forward to read your opinion about it.

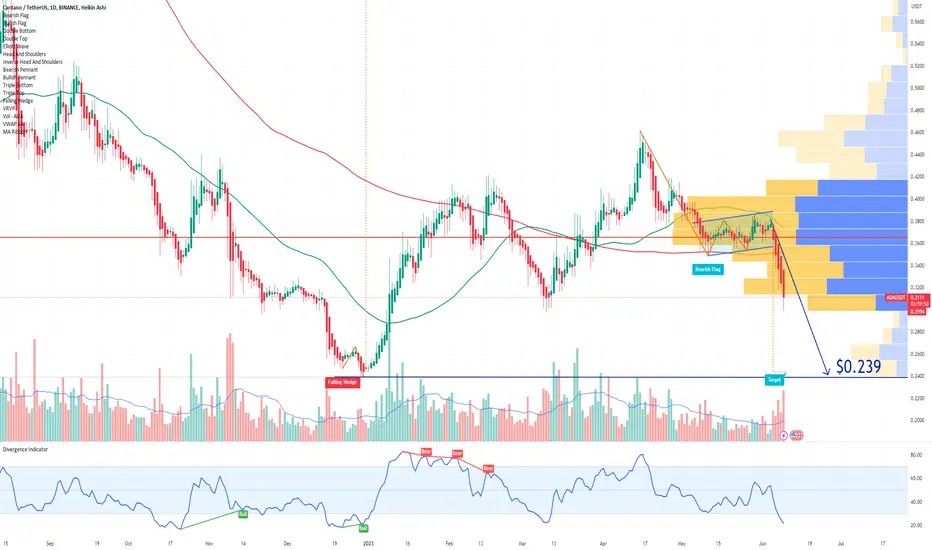
Robinhood to delist ADA Cardano If you haven`t sold ADA here:
Then you should know that Robinhood, the well-known trading platform, will discontinue its support for three cryptocurrencies implicated in SEC lawsuits against Binance and Coinbase.
Effective from June 27, 2023, Robinhood will no longer provide support for Cardano (ADA), Polygon (MATIC), and Solana (SOL).
In My opinion ADA will test the support of $0.239.
Looking forward to read your opinion about it.
Robinhood will delist Polygon MATICIf you haven`t sold MATIC here:
Then you should know that Robinhood, the well-known trading platform, will discontinue its support for three cryptocurrencies implicated in SEC lawsuits against Binance and Coinbase.
Effective from June 27, 2023, Robinhood will no longer provide support for Cardano (ADA), Polygon (MATIC), and Solana (SOL).
In My opinion MATIC will test the support of $0.50.
Looking forward to read your opinion about it.

Robinhood to delist SOL SolanaIf you haven`t sold Solana here:
Then you should know that Robinhood, the well-known trading platform, will discontinue its support for three cryptocurrencies implicated in SEC lawsuits against Binance and Coinbase.
Effective from June 27, 2023, Robinhood will no longer provide support for Cardano (ADA), Polygon (MATIC), and Solana (SOL).
In My opinion MATIC will test the support of 13usd.
Looking forward to read your opinion about it.

MANA Decentraland is considered a security by the SECIf you haven`t sold MANA here:
Then you should know that recently the U.S. Securities and Exchange Commission (SEC) classified Decentraland (MANA) as a security. This means that MANA, the native cryptocurrency of the Decentraland virtual reality platform, is now subject to securities regulations and requirements imposed by the SEC.
The decision to categorize MANA as a security by the SEC signifies that it is considered an investment contract, representing ownership or participation in a particular project or platform. As a result, Decentraland and MANA will be subject to compliance with applicable securities laws, including registration, reporting, and other regulatory obligations.
This classification by the SEC highlights the increasing scrutiny and regulation of cryptocurrencies, particularly those involved in projects that resemble traditional securities offerings.
My short term price target is $0.35.
Looking forward to read your opinion about it.

TON Toncoin has been classified as a security by the SEC !The SEC's classification of Telegram's Gram (TON) as a security highlights the regulatory scrutiny surrounding certain cryptocurrencies. This classification implies that Gram tokens are considered investment contracts, subjecting them to securities regulations and requirements. Such regulatory actions aim to protect investors and ensure compliance within the evolving cryptocurrency landscape.
It reinforces the importance for cryptocurrency projects to navigate the regulatory landscape diligently and ensure compliance with applicable securities laws to foster investor confidence and industry growth.
My Price Target for TON is $0.73.
Looking forward to read your opinion about it!

XMR Potential Ban of anonymous crypto projects !If you haven`t sold XMR here:
Then i will remind you that Monero (XMR) has gained popularity for its capacity to enhance user anonymity, making transactions challenging to trace through the utilization of stealth addresses. However, this aligns with a goal that regulators do not necessarily support in the cryptocurrency space.
A leaked version of a US draft bill has surfaced, suggesting the elimination of anonymous crypto projects. The proposal also mandates that DAOs, DeFi platforms, and exchanges register legally in the United States. This development indicates a potential shift towards greater regulation and oversight within the industry.
My price target for XMR is $96.50.
Looking forward to read your opinion about it!

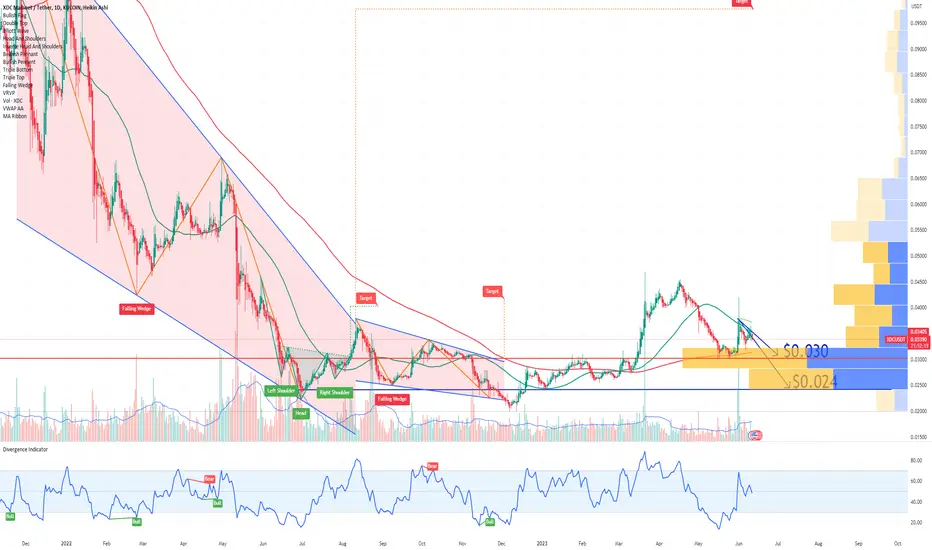
XDC Network Potential RetracementIn my opinion, considering the current market conditions and the broader performance of cryptocurrencies, XDC (XinFin Network) could face downward pressure and potentially trade lower at this time.
Many cryptocurrencies have experienced a recent decline in value due to various factors such as market corrections, regulatory concerns, or shifts in investor sentiment. XDC may not be immune to these trends and could be influenced by the overall market sentiment.
My price targets are $0.030 and $0.024.
Looking forward to read your opinion about it.
Bitcoin Head and Shoulders Price TargetIf you haven`t sold BTC here:
Then Bitcoin, currently trading at $26,510, has formed a head and shoulders pattern, indicating a possible bearish trend ahead. This chart pattern consists of three peaks, with the middle peak forming the head and the other two forming the shoulders. The neckline, a crucial support level, becomes a focal point as a break below it could trigger further downward movement.
While the target for the head and shoulders pattern suggests a larger decline, attention should also be given to the 200-day moving average support at $23,440. This level has historically acted as a significant support zone for Bitcoin. Therefore, it is reasonable to anticipate a potential drop towards this level.
It's important to consider that technical patterns are not infallible, and market sentiment and external factors can influence price movements. Bitcoin's volatility adds an element of unpredictability, making it essential to exercise caution and keep an eye on market developments.
Looking forward to read your opinion about it.
