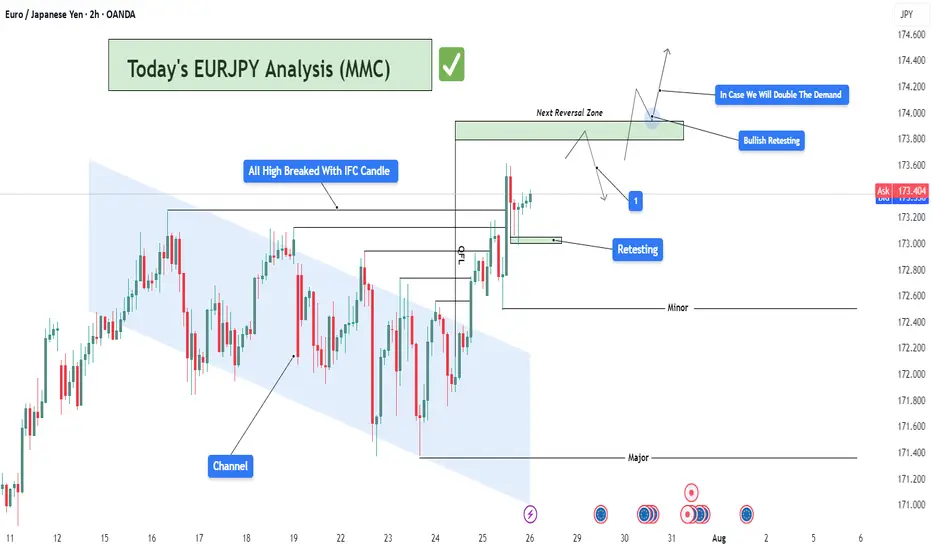
EURJPY Bullish Breakout with IFC Confirmation | MMC Retest Play🔍 Market Structure & Price Behavior Explanation
🔹 1. Channel Structure and Bearish Trap:
The pair was previously trading within a downward sloping channel, forming lower highs and lower lows. This structure was respected for several sessions, creating a bearish bias for most retail traders.
However, as per Mirror Market Concepts, such channels often act as liquidity traps — designed to build sell-side liquidity before a strong reversal.
🔹 2. IFC Candle Break — Smart Money Confirmation:
A powerful bullish impulse candle (IFC - Institutional-Filled Candle) broke through all previous swing highs formed inside the channel. This is a critical sign that institutional buyers have stepped in and the bearish trend is likely over.
This candle is not just a breakout but also a signature of smart money transitioning the market structure from bearish to bullish. The breakout occurred with high momentum and volume, piercing through the upper channel boundary, invalidating the bearish trend.
📘 Key Note: IFC candles usually represent imbalance, strong directional intent, and are often followed by continuation after retest.
🔹 3. Retesting Phase – Key to Confirmation:
After the breakout, price retested the broken structure, which is now acting as a new demand zone. The retest is clean, holding firmly above minor support — giving confirmation of bullish control.
This zone is also aligned with a QFL (base structure) concept, where price returns to the base before a new leg of the trend begins.
🔹 4. Current Price Action: Building for Next Leg
Price is now consolidating just below the next key reversal zone (marked in green). This zone represents potential supply or resistance.
There are two likely outcomes here:
Rejection at the reversal zone, with a potential pullback before continuation.
Clean break above, followed by "Demand Doubling", where price re-tests this level again, confirming further upside momentum.
In case the second scenario plays out (as marked on the chart), EURJPY could aggressively rally toward 174.400 and beyond.
🔹 5. Demand Zones & Key Levels:
✅ Minor Demand Zone (~173.00):
Currently respected — origin of last bullish move.
✅ Major Demand Zone (~171.200):
Acts as macro support in case of deep retracement.
✅ Reversal Zone (~173.800 – 174.200):
Price may slow down, reject, or consolidate here. Smart money usually decides at this level.
📈 MMC Trading Plan (Mirror Market Concept Approach):
Buy Bias is active as long as price remains above the minor demand zone.
Any rejection from reversal zone with wick traps followed by bullish engulfing setups = potential long entries.
Break & hold above 174.200 will likely trigger momentum-based entries, targeting extended bullish continuation.
💹 Trade Setup Parameters:
📥 Entry #1: After successful retest and bullish confirmation at demand
🛑 Stop Loss: Below retest structure (~172.850)
🎯 Take Profit 1: 173.950 (within reversal zone)
🎯 Take Profit 2: 174.350+ (post-demand doubling continuation)
🧠 Trader’s Mindset – What to Expect Next:
The chart is a classic example of MMC in real-time, where:
Price traps sellers inside a fake bearish channel
Breaks structure using high-volume impulsive moves
Retests demand zone cleanly
Builds up toward the next decision-making zone
Patience is key here. Let price either break and confirm above the reversal zone or give us another deep retest for the best R:R long setup.
Tradingeducation
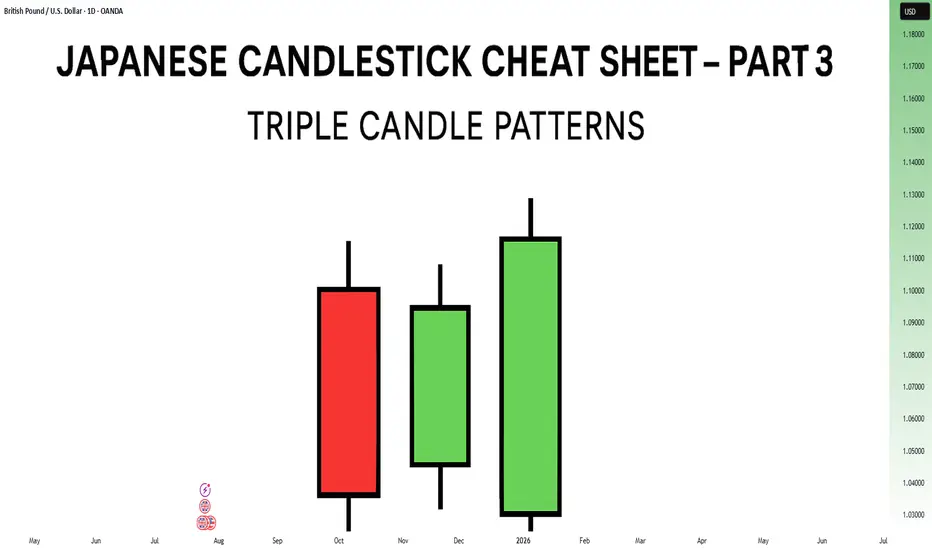
Japanese Candlestick Cheat Sheet – Part Three- 3 candle patternsSo far in this series, we've broken down single candle formations ( Part 1 ) and explored double candle signals ( Part 2 ) — the kind of patterns that give you quick, often powerful hints about the market’s mood.
But now it’s time to go a step further.
👉 In Part 3, we dive into triple candlestick formations — patterns that take more time to form, but often offer stronger confirmation and a more reliable narrative.
They’re like reading three full sentences from the market instead of just one or two words.
If you’re ready to spot momentum shifts (not noise), this lesson is for you.
Let’s decode the story behind formations like Morning Star, Three White Soldiers, and so on.
MORNING STAR
Bias: Bullish
What is the Morning Star pattern?
The Morning Star pattern consists of a bearish candle, a small-bodied middle candle, and a bullish candle, forming at the end of a downtrend to signal potential reversal. This pattern reflects a shift from seller dominance to buyer strength, as the middle candle marks a pause before a reversal. The Morning Star is a reliable signal that buyer interest is reemerging.
Understanding Morning Stars helps traders anticipate shifts in momentum, providing valuable entry points for new uptrends.
Meaning:
Found in downtrends; signals potential bullish reversal as buyers gain control, with strength confirmed by the third candle closing above the first.
BULLISH ABANDONED BABY
Bias: Bullish
What is the Bullish Abandoned Baby pattern?
The Bullish Abandoned Baby is a rare but powerful reversal pattern that consists of a bearish candle, a gapped doji, and a bullish candle. The middle doji reflects indecision, while the third bullish candle confirms the reversal. This pattern highlights a dramatic shift in sentiment, showing that buyers are prepared to take control.
Recognizing the Bullish Abandoned Baby can offer traders insights into pivotal market shifts.
Meaning:
Appears in downtrends; suggests a strong bullish reversal, as the middle doji shows indecision, with confirmation by a strong bullish move.
THREE WHITE SOLDIERS
What is the Three White Soldiers pattern?
The Three White Soldiers pattern consists of three consecutive bullish candles, each closing higher than the last, often appearing in downtrends to signal a potential bullish reversal. This pattern reflects sustained buying pressure, indicating that buyer sentiment is strong. Psychologically, it shows that buyers are steadily gaining confidence, pushing prices upward.
For traders, Three White Soldiers provide a clear signal of momentum, ideal for capturing emerging trends.
Meaning:
Found in downtrends; signals potential trend reversal, showing sustained buying strength, often signaling the start of a bullish trend.
MORNING DOJI STAR
What is the Morning Doji Star pattern?
The Morning Doji Star pattern is similar to the Morning Star, but with a doji as the middle candle, indicating greater indecision before a reversal. This pattern consists of a bearish candle, a doji, and a bullish candle, highlighting a transition from bearish to bullish sentiment. The doji reflects a moment when market sentiment is balanced, but the third candle confirms a bullish shift.
Interpreting Morning Doji Stars can help traders identify turning points in downtrends, providing valuable entry opportunities.
Meaning:
Appears in downtrends; signals potential bullish reversal, with indecision from the doji and confirmation by a strong bullish candle.
EVENING STAR
What is the Evening Star pattern?
The Evening Star is a three-candle pattern that appears at the top of an uptrend, signaling a potential bearish reversal. It consists of a bullish candle, a small-bodied middle candle, and a bearish candle, showing a transition from buyer control to seller strength. This pattern often appears at market peaks, where optimism is giving way to caution.
Understanding the Evening Star pattern helps traders anticipate downtrend formations, allowing them to time their exits.
Meaning:
Found in uptrends; signals potential bearish reversal as sellers gain control, confirmed if the third candle closes below the first.
BEARISH ABANDONED BABY
What is the Bearish Abandoned Baby pattern?
The Bearish Abandoned Baby is the bearish counterpart to the Bullish Abandoned Baby and consists of a bullish candle, a gapped doji, and a bearish candle. This pattern reveals a dramatic shift in sentiment from bullish to bearish, highlighting a sudden reversal at the top of an uptrend.
Recognizing the Bearish Abandoned Baby can offer traders insight into market tops and impending trend changes.
Meaning:
Appears in uptrends; indicates strong bearish reversal, as indecision in the doji is followed by selling strength.
THREE BLACK CROWS
What is the Three Black Crows pattern?
The Three Black Crows pattern consists of three consecutive bearish candles, each closing lower than the last, appearing in uptrends to signal potential reversal. This pattern reflects sustained selling pressure, indicating that sellers are gaining control. The Three Black Crows highlight a moment when buyer confidence wanes, marking the beginning of downward momentum.
For traders, this pattern provides a clear signal to avoid buying into weakening trends or even entering short trades.
Meaning:
Found in uptrends; signals potential bearish reversal, with sustained selling pressure often marking the start of a downtrend.
EVENING DOJI STAR
What is the Evening Doji Star pattern?
The Evening Doji Star is similar to the Evening Star, but with a doji as the middle candle, highlighting greater indecision. This pattern consists of a bullish candle, a doji, and a bearish candle, indicating a shift from bullish to bearish sentiment. The doji suggests that buyers are losing control, with sellers prepared to reverse the trend.
Understanding Evening Doji Stars allows traders to recognize market tops, helping them avoid overextended trends.
Meaning:
Appears in uptrends; signals potential bearish reversal, as the doji suggests indecision, confirmed by strong selling on the third candle.
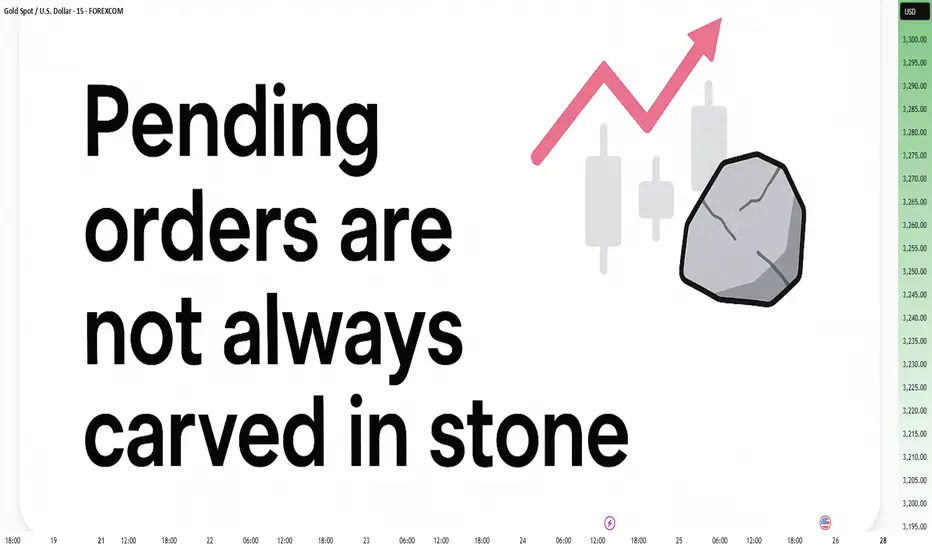
Pending Orders Are Not Set in Stone – Context Still MattersIn a previous educational article, I explained why I almost never trade breakouts on Gold.
Too many fakeouts. Too many emotional traps.
Instead, I stick to what works:
• ✅ Buying dips
• ✅ Selling rallies
But even these entries — placed with pending orders — are not automatic.
Because in real trading, price is not just a number — it’s a narrative.
And if the story changes, so should the trade.
________________________________________
🎯 The Setup – Buy the Dip Around 3400
Let’s take a real example from yesterday.
In my analysis, I mentioned I would look to buy dips near 3400, a former resistance now acting as support.
Price dropped to 3405, just a few points above my pending buy at 3402.
We saw a clean initial bounce — confirming that short-term support was real.
But I missed the entry by 30 pips.
So far, so good.
But here’s the important part — what happened next changed everything.
________________________________________
🧠 The Rejection Shifted the Entire Story
The bounce from 3405 was immediately sold into at 3420, a newly formed short-term resistance (clearly visible on the 15-minute posted chart).
After that, price started falling again — heading back toward my pending order.
📌 At that point, I cancelled the order. Why?
Because the context had changed:
• Bulls had tried once — and failed at 3420
• Sellers were clearly active and waiting above
• A second drop into my level wouldn’t be a clean dip — it would be retest under pressure.
The market was no longer giving me a “buy the dip” setup.
It was showing me a failed recovery. That’s a very different trade.
________________________________________
💡 What If It Had Triggered?
Let’s imagine that price had hit 3402 first, triggering my order.
Then rebounded, failed at 3420, and started dropping again.
Even then, I wouldn’t hold blindly.
Once I saw the rejection at 3420, I would have understood:
The structure had shifted.
The bullish case is weakening.
Exit early — breakeven or small controlled loss.
________________________________________
🔁 Sequence > Level
This is the most important principle:
• ✅ First down, then up = healthy dip → shows buyers are still in control
• ❌ First up, then down = failed breakout → shows selling pressure is stronger
Two scenarios. Same price. Opposite meaning.
That’s why you should look for:
Not just where price goes — but how it gets there.
________________________________________
🔒 Pending Orders Are Conditional
Many traders treat pending orders like traps:
“Just let price come to my level, and I’m in.”, but you should refine a little
✅ Pending orders should be based on a conditional expectation
❌ Not a fixed belief that the zone must hold
If the market tells a different story, remove the order.
No ego. No drama. Just process.
________________________________________
📌 Final Thought
Trading isn’t just about catching a price.
It’s about understanding price behavior.
First down, then up = strength.
First up, then down = weakness.
Let the market show its hand — then decide if you want to play.
Disclosure: I am part of TradeNation's Influencer program and receive a monthly fee for using their TradingView charts in my analyses and educational articles.
Feed Your Ego or Feed Your Account- Your Choise🧭 From Rookie to Realization
I’ve been trading since 2002. That’s nearly a quarter of a century in the markets.
I’ve lived through it all:
• The early days, when the internet was slow and information was scarce
• The forums, the books, the overanalyzing
• The obsession with finding “the perfect system”
• And later… the dangerous phase: needing to be right, because I have a few years of experience and I KNOW
At one point, I thought that being a good trader meant calling the market in advance — proving I was smarter than the rest.
But the truth is: the market doesn't pay for being right. It pays for managing risk, always adapting and executing cleanly.
________________________________________
😤 The Psychological Trap Most Traders Fall Into
There’s one thing I’ve seen consistently over the last 25 years:
Most traders don’t trade to make money.
They trade to feel right.
And this need — this psychological craving to validate an opinion — is exactly what keeps them from growing.
You’ve seen it too:
• The guy who’s been screaming “altcoin season” for 2 years
• Who first called it when EGLD was at 80, TIA, and others that kept dropping
• But now that something finally moves, he says:
“See? I was right all along, altcoin season is here”
He’s not trading.
He’s rehearsing an ego story, ignoring every failed call, every drawdown, every frozen position.
He doesn’t remember the trades that didn’t work — only the one that eventually did.
This is not strategy.
It’s delusion dressed up as conviction.
________________________________________
📉 The Market Doesn’t Care What You Think
Here’s the reality:
You can be right in your analysis — and still lose money.
You can be wrong — and still come out profitable.
Because the market doesn’t reward your opinion.
It rewards how well you manage risk, entries, exits, expectations, and flexibility
I’ve seen traders who were “right” on direction but blew their accounts by overleveraging.
And I’ve seen others who were wrong on their first two trades — but adjusted quickly, cut losses, and ended green overall in the end.
This is what separates pros from opinionated amateurs.
________________________________________
📍 A Real Example: Today’s Gold Analysis
Let’s take a real, current example — my own Gold analysis from this morning.
I said:
• Short-term, Gold could go to 3450
• Long-term, the breakout from the weekly triangle could take us to 3800
Sounds “right,” right? But let’s dissect it:
Short-term:
✅ I identified 3370 as support
If I buy there, I also have a clear invalidation level (below 3350)
If it breaks that and hits my stop?
👉 I reassess — because being “right” means nothing if the trade setup is invalidated
And no, it doesn’t help my PnL if Gold eventually reaches 3450 after taking me out.
Long-term:
✅ The weekly chart shows a symmetrical triangle
Yes — if we break above, the measured move targets 3800
But…
If Gold goes below 3300, that long-term scenario is invalidated too.
And even worse — if Gold trades sideways between 3000 and 3500 for the next 5 years and finally hits 3800 in 2030, that “correct call” is worth nothing.
You can't build a career on "eventually I was right."
You need precision, timing, risk management, and the ability to say:
“This setup is no longer valid. I’m out.”
________________________________________
💡 The Shift That Changed Everything
It took me years to realize this.
The day I stopped needing to be right was the day I started making consistent money.
I stopped arguing with the market.
I stopped holding losers out of pride.
I stopped needing to "prove" anything to anyone — especially not myself.
Now, my job is simple:
• Protect capital
• Execute with discipline
• Let the edge do its job
• And never fall in love with my opinion
________________________________________
✅ Final Thought – Let Go of Being Right
If you’re still stuck in the “I knew it” mindset — let it go.
It’s not helping you. It’s costing you.
The best traders lose small, admit mistakes fast, and stay emotionally neutral.
The worst traders hold on to “being right” while their account burns.
The market doesn’t owe you respect.
It doesn’t care if you called the top, bottom, or middle.
It pays the ones who trade objectively, flexibly, and without ego.
After almost 25 years, this is the one thing I wish I had learned sooner:
Don’t try to win an argument with the market.
Just get paid.
Disclosure: I am part of TradeNation's Influencer program and receive a monthly fee for using their TradingView charts in my analyses and educational articles.

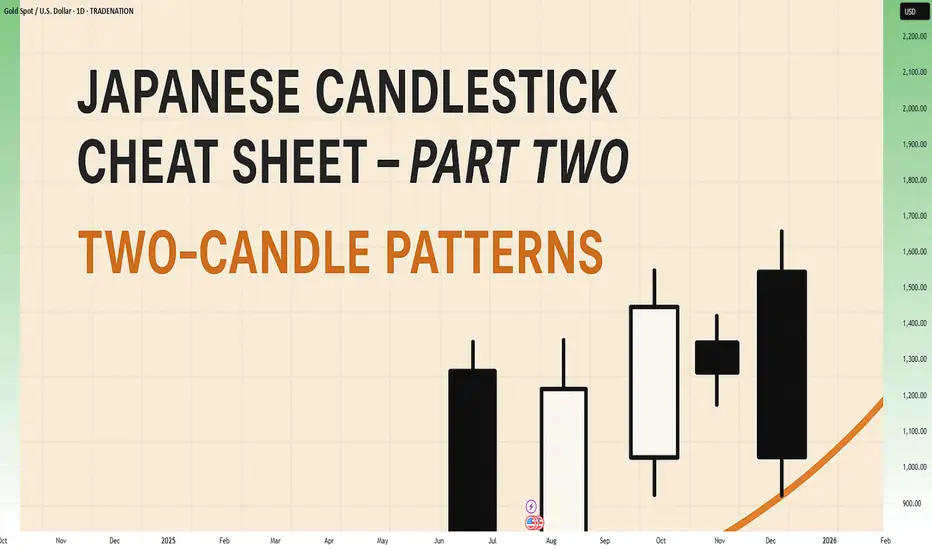
Japanese Candlestick Cheat Sheet – Part Two- 2 candle patternsTwo-Candle Patterns That Signal Shifts in Sentiment
Single candles whisper…
But two candles talk to each other — and when they do, they often reveal the first signs of a reversal or continuation.
In this second part of the series, we go deeper.
From engulfings to haramis, tweezer tops to piercing lines — these patterns don’t just look good on charts… they capture the psychological tug-of-war between buyers and sellers.
Price doesn’t lie.
And two candles in a row can say: “Something just changed.”
Learn to spot them early. Learn to listen when the chart speaks.
This is Part Two of your practical guide to mastering candlestick formations.
BULLISH KICKER
Bias: Bullish
What is the Bullish Kicker pattern?
The Bullish Kicker forms when a strong bullish candle follows a bearish one with no overlap between the two, indicating a sudden shift in sentiment. This pattern is a powerful indicator of a reversal as buyers take control. The sharp contrast between the bearish and bullish candles reflects a dramatic shift in market psychology, where bears are caught off-guard and forced to cover their positions.
Bullish Kickers are rare but extremely telling, providing a clear signal that sentiment is favoring buyers. Recognizing such decisive patterns can be a game-changer.
Meaning:
Found after downtrends or sell-offs; suggests a sudden shift in sentiment, indicating strong buying interest and potential trend reversal.
BULLISH ENGULFING
Bias: Bullish
What is the Bullish Engulfing pattern?
The Bullish Engulfing pattern occurs when a large bullish candle fully engulfs the previous smaller bearish candle, signaling a potential trend reversal. This pattern highlights a moment when buyers overpower sellers, often marking the beginning of upward momentum. Psychologically, it suggests that buyer confidence is returning, and sellers are losing their grip.
For traders, understanding Bullish Engulfing patterns can provide crucial entry points into emerging trends. Learning to identify and trade such patterns is essential for capturing momentum and new trends.
Meaning:
Typically found in downtrends, this pattern signals a potential bullish reversal as buyers overpower sellers, often indicating a shift toward upward momentum.
BULLISH HARAMI
Bias: Bullish
What is the Bullish Harami pattern?
The Bullish Harami consists of a small bullish candle within a preceding larger bearish one, indicating a pause in downward momentum and hinting at a potential reversal. This pattern shows that sellers are beginning to weaken as buyers cautiously test the waters. The Harami reflects a shift in sentiment from bearish to neutral, often marking a transitional phase in the market.
Interpreting the Bullish Harami helps traders spot moments when sentiment is shifting, potentially signaling the start of a trend change.
Meaning:
Seen in downtrends, it suggests indecision, with possible bullish reversal if the following candles confirm buying strength, indicating a weakening bearish trend.
PIERCING LINE
Bias: Bullish
What is the Piercing Line pattern?
The Piercing Line forms when a bullish candle opens below the previous bearish candle’s low but closes over halfway into it. Found in downtrends, this pattern reflects strong buying pressure as buyers step in at lower prices, creating a potential bullish reversal. The Piercing Line pattern suggests that sentiment may be shifting as buyers gain confidence.
This pattern’s strength lies in its psychological impact, revealing moments when buyers are willing to take risks. Recognizing these signs early can provide valuable insights for traders looking to time entries.
Meaning :
Found in downtrends, this pattern suggests a possible bullish reversal if buying continues, as sellers lose control to buyers.
TWEEZER BOTTOM
Bias: Bullish
What is the Tweezer Bottom pattern?
The Tweezer Bottom pattern is characterized by two consecutive candles with nearly identical lows, one bearish and one bullish. This pattern often signals the end of a downtrend, as the matching lows suggest a strong support level where buyers are stepping in. The Tweezer Bottom highlights market psychology at work, with sellers unable to push prices lower, reflecting renewed buying interest.
Tweezer Bottoms are ideal for traders looking to identify support zones and potential reversal points. By understanding this pattern’s significance, traders can make informed decisions.
Meaning:
Found in downtrends, it signals potential reversal, showing strong support at the matching low, suggesting buyers are stepping in.
BEARISH KICKER
Bias: Bearish
What is the Bearish Kicker pattern?
The Bearish Kicker is the inverse of the Bullish Kicker, forming when a strong bearish candle follows a bullish one without overlap, indicating a sharp sentiment shift. This pattern often marks a sudden reversal, with sellers taking control after an initial bullish period. Psychologically, Bearish Kickers are powerful, signaling that buyers are caught off-guard and losing momentum.
Recognizing Bearish Kickers provides traders with insights into sudden shifts in market dynamics, helping them avoid buying into weakening trends.
Meaning:
Found after uptrends; indicates a sudden sentiment shift, signaling potential trend reversal and intensified selling pressure.
BEARISH ENGULFING
Bias: Bearish
What is the Bearish Engulfing pattern?
The Bearish Engulfing pattern forms when a large bearish candle engulfs the previous smaller bullish candle, suggesting a potential reversal in an uptrend. This pattern signals that sellers have regained control, often marking the start of downward momentum. The Bearish Engulfing reveals a psychological shift, as selling pressure overtakes buying interest.
This pattern is a powerful tool for traders who aim to catch trend reversals, allowing them to align with emerging downward momentum.
Meaning:
Typically found in uptrends, this pattern signals a potential bearish reversal as sellers overpower buyers, often indicating a downward momentum shift.
BEARISH HARAMI
Bias: Bearish
What is the Bearish Harami pattern?
The Bearish Harami consists of a small bearish candle contained within a larger preceding bullish one, reflecting indecision and a potential trend reversal. Found in uptrends, it hints that buyers are losing strength, while sellers are cautiously testing the market. This pattern highlights moments when buyer momentum begins to wane, suggesting caution.
Interpreting the Bearish Harami allows traders to spot potential shifts in sentiment, helping them manage risk and time their exits.
Meaning:
Seen in uptrends, it suggests indecision with a potential bearish reversal if following candles confirm, indicating a weakening bullish trend.
DARK CLOUD COVER
Bias: Bearish
What is the Dark Cloud Cover pattern?
The Dark Cloud Cover appears when a bearish candle opens above the previous bullish candle but closes over halfway into it, reflecting a shift in control from buyers to sellers. This pattern suggests that bullish momentum may be fading, hinting at a potential reversal. Dark Cloud Cover patterns reveal moments when sentiment shifts from optimism to caution.
For traders, understanding this pattern helps them anticipate reversals at the top of uptrends.
Meaning:
Found in uptrends; signals potential bearish reversal if selling continues, as buyers lose control to sellers.
TWEEZER TOP
Bias: Bearish
W hat is the Tweezer Top pattern?
The Tweezer Top is formed by two candles with matching or nearly matching highs, typically one bullish and one bearish. This pattern signals potential resistance, as sellers are consistently pushing back against the same level. The Tweezer Top reflects a moment of seller strength, often marking the end of an uptrend.
Recognizing Tweezer Tops helps traders spot resistance zones and potential reversal points, allowing them to avoid buying into weakening trends or even shorting the asset.
Meaning:
Found in uptrends, it signals potential reversal, showing strong resistance at the matching high, suggesting selling pressure.
🧭 Final Thought
Two-candle formations often appear at key turning points — right where most traders hesitate or get trapped.
Learn to read them not just as patterns, but as conversations between candles — one pushing, the other reacting.
And if this is your first time reading the series, don’t miss Part One – where we covered single-candle signals like dojis, hammers, and marubozus — the very foundations of candlestick reading.
Japanese Candlestick Cheat Sheet – Part OneSingle-Candle Formations That Speak
Before you dream of profits, learn the one language that never lies: price.
Indicators are just subtitles — price is the voice.
Japanese candlesticks are more than just red and green bars — they reflect emotion, pressure, and intention within the market.
This series will walk you through the real psychology behind candlestick patterns — starting here, with the most essential:
🕯️ Single-candle formations — the quiet signals that often appear before big moves happen.
If you can’t read a doji, you’re not ready to understand the market’s hesitation.
If you ignore a hammer, you’ll miss the moment sentiment shifts.
Let’s start simple. Let’s start strong.
This is Part One of a five-part series designed to build your candlestick fluency from the ground up.
1. DOJI
Bias: Neutral
What is the Doji pattern?
The Doji candlestick pattern forms when a candle’s open and close prices are nearly identical, resulting in a small or nonexistent body with wicks on both sides. This pattern reflects market equilibrium, where neither buyers nor sellers dominate. Dojis often appear at trend ends, signaling potential reversals or pauses.
As a fundamental tool in technical analysis, Dojis help traders gauge the psychological battle between buyers and sellers. Proper interpretation requires context and experience, especially for spotting trend shifts.
Meaning:
Indicates market indecision or balance. Found during trends and may signal a reversal or continuation based on context.
LONG-LEGGED DOJI
Bias: Neutral
What is the Long-Legged Doji pattern?
The Long-Legged Doji captures a moment of intense uncertainty and volatility in the market. Its long wicks represent significant movement on both sides, suggesting that neither buyers nor sellers have control. This back-and-forth reflects the psychology of market participants wrestling for control, which often foreshadows a shift in sentiment. When traders see a Long-Legged Doji, it highlights the need to monitor for potential changes in direction.
They can appear within trends, at potential reversal points, or at consolidation zones. When they form at the end of an uptrend or downtrend, they often signal that the current trend may be losing momentum.
Meaning:
The prominent wicks indicate volatility. Buyers and sellers pushed prices in opposite directions throughout the session, ultimately reaching an indecisive close.
SPINNING TOP
Bias: Neutral
What is the Spinning Top pattern?
A Spinning Top is a candlestick with a small body and long upper and lower wicks, indicating that the market has fluctuated significantly but ultimately closed near its opening price. This pattern often points to a moment of indecision, where both buyers and sellers are active but neither dominates. Spinning Tops are commonly found within both uptrends and downtrends and can suggest that a trend is losing momentum.
For traders, a Spinning Top provides a valuable insight into market psychology, as it hints that the prevailing sentiment may be weakening. While Spinning Tops alone aren’t always definitive, they can serve as a precursor to larger moves if the following candles confirm a shift in sentiment.
Meaning:
Shows indecision between buyers and sellers. Common in both up and downtrends; signals potential reversal or pause.
HAMMER
Bias: Bullish
What is the Hammer pattern?
A Hammer candlestick appears at the end of a downtrend, with a small body and a long lower wick. This shape reflects a moment when sellers pushed prices lower, but buyers managed to absorb the selling pressure and drive prices back up before the close. This pattern is particularly important for spotting potential reversals, as it indicates that buyers are beginning to reassert control.
Hammers reveal the underlying psychology of a market where buying confidence is emerging, even if sellers have dominated for a while. To successfully trade this pattern, it’s essential to confirm the reversal with subsequent candles.
Meaning:
Showing rejection of lower prices. Signals potential bullish reversal, especially if followed by strong buying candles.
INVERTED HAMMER
Bias: Bullish
What is the Inverted Hammer pattern?
The Inverted Hammer forms at the bottom of a downtrend, with a small body and long upper wick. This pattern shows that buyers attempted to push prices higher, but sellers ultimately brought them back down by the close. The Inverted Hammer is an early sign of buyer interest, hinting that a trend reversal may be underway if subsequent candles confirm the shift.
Interpreting the Inverted Hammer helps traders understand where sentiment may be shifting from bearish to bullish, often marking the beginning of a recovery. Recognizing these patterns takes practice and familiarity with market conditions.
Meaning:
Showing rejection of higher prices. Can signal bullish reversal if confirmed by subsequent buying pressure.
DRAGONFLY DOJI
Bias: Bullish
What is the Dragonfly Doji pattern?
The Dragonfly Doji has a long lower wick and no upper wick, forming in downtrends to signal potential bullish reversal. This pattern reveals that sellers were initially in control, pushing prices lower, but buyers stepped in to push prices back up to the opening level. The Dragonfly Doji’s unique shape signifies that strong buying support exists at the lower price level, hinting at an impending reversal.
Recognizing the psychology behind a Dragonfly Doji can enhance a trader’s ability to anticipate trend changes, especially in markets where support levels are being tested.
Meaning:
Found in downtrends; suggests possible bullish reversal if confirmed by a strong upward move.
BULLISH MARUBOZU
Bias: Bullish
What is the Bullish Marubozu pattern?
The Bullish Marubozu is a large, solid candle with no wicks, indicating that buyers were in complete control throughout the session. This pattern appears in uptrends, where it signals strong buying momentum and often foreshadows continued upward movement. The absence of wicks reveals that prices consistently moved higher, with little resistance from sellers.
For traders, the Bullish Marubozu offers a glimpse into market psychology, highlighting moments when buyer sentiment is particularly strong. Learning to identify these periods of intense momentum is crucial for trading success.
Meaning:
Showing complete buying control. Found in uptrends or at reversal points; indicates strong buying pressure and likely continuation of the trend.
SHOOTING STAR
Bias: Bearish
What is the Shooting Star pattern?
The Shooting Star appears at the top of an uptrend, characterized by a small body and a long upper wick, indicating a potential bearish reversal. Buyers initially drove prices higher, but sellers took over, bringing prices back down near the open. This shift suggests that buyers may be losing control, and a reversal could be imminent.
Interpreting the Shooting Star gives traders valuable insights into moments when optimism begins to fade, providing clues about a potential trend shift.
Meaning:
Indicating rejection of higher prices. Signals a potential bearish reversal if followed by selling pressure.
HANGING MAN
Bias: Bearish
W hat is the Hanging Man pattern?
The Hanging Man candle forms at the top of an uptrend, with a small body and long lower wick. This pattern suggests that sellers attempted to drive prices down, but buyers regained control. However, the presence of a long lower shadow hints that sellers may be gaining strength, potentially signaling a bearish reversal.
The Hanging Man pattern reflects market psychology where buyers might be overextended, making it a valuable tool for identifying potential tops in trends.
Meaning:
Signals potential bearish reversal if confirmed by selling candles afterward.
GRAVESTONE DOJI
Bias: Bearish
What is the Gravestone Doji pattern?
With a long upper wick and no lower wick, the Gravestone Doji reveals that buyers pushed prices up, but sellers eventually regained control. Found in uptrends, it suggests that a bearish reversal could be near, as the upper shadow indicates buyer exhaustion. The Gravestone Doji often appears at market tops, making it a valuable indicator for those looking to anticipate shifts.
Understanding the psychology behind this pattern helps traders make informed decisions, especially in markets prone to overbought conditions.
Meaning:
Showing rejection of higher prices. Found in uptrends; signals potential bearish reversal if followed by selling activity.
BEARISH MARUBOZU
Bias: Bearish
What is the Bearish Marubozu pattern?
The Bearish Marubozu is a large, solid bearish candle without wicks, showing that sellers held control throughout the session. Found in downtrends, it signals strong bearish sentiment and suggests that the trend is likely to continue. The lack of wicks reflects consistent downward momentum without significant buyer support.
This pattern speaks about market psychology, offering traders insights into moments of intense selling pressure. Recognizing the Bearish Marubozu can help you align with prevailing trends and avoid buying into weakening markets
Meaning:
Showing strong selling pressure. Found in downtrends; signals continuation of the bearish trend or an intensifying sell-off.
👉 Up next: Double-candle formations – where price meets reaction.
Why Swing Trading and Scalping Are Opposite Worlds"It's not about the strategy. It's about who you are when the market puts pressure on you."
Most traders fail not because they don’t learn “strategies” — but because they pick a style that doesn't match their temperament.
And nothing creates more damage than confusing swing trading with scalping/intraday trading.
Let’s break them down. For real...
________________________________________
🔵 1. Swing Trader – Chasing Direction, Not Noise
A swing trader does not touch choppy markets.
He’s not here for the sideways grind. He wants momentum.
If there’s no clear trend, he doesn’t trade.
He shifts between assets depending on where real movement is.
• USD weakens → he buys EUR/USD and waits
• Gold breaks → he enters and lets the move develop
Swing trading means positioning with the macro flow, not chasing bottoms and tops.
✅ He trades based on H4/Daily or even Weekly charts
✅ He holds for hundreds of pips.
✅ He accepts contrarian candles in the process.
________________________________________
🔴 2. Scalper/Intraday Trader – The Asset Specialist
A true scalper doesn’t chase trends.
He hunts inefficiencies — quick spikes, fakeouts, liquidity grabs.
✅ Loves range conditions
✅ Lives inside M5–M15
✅ Often trades only one asset he knows like the back of his hand
He doesn’t care what EUR/USD will do this week.
He cares what it does in the next 30 minutes after a breakout.
Scalping is not chaos. It's cold execution with a sniper mindset.
📡 He reacts to news in real time.
He doesn’t predict — he exploits.
________________________________________
🧾 Key Differences – Swing Trader vs. Scalper
________________________________________
🎯 Primary Objective
• Swing Trader: Captures large directional moves over several days.
• Scalper/Intraday: Exploits short-term volatility, aiming for quick, small gains.
________________________________________
🧭 Market Conditions Preference
• Swing Trader: Needs clean, trending markets with clear momentum.
• Scalper/Intraday: Feels comfortable in ranging markets with liquidity spikes and noise.
________________________________________
🔍 Number of Instruments Traded
• Swing Trader: Monitors and rotates through multiple assets (e.g. XAUUSD, EURUSD, indices, BTC, he's going where the money is).
• Scalper/Intraday: Specializes in 1–2 instruments only, knows their behavior in every session.
________________________________________
⏰ Time Spent in Front of the Charts
• Swing Trader: Waits for clean setups, may hold positions for days or weeks.
• Scalper/Intraday: Constant screen time, executes and manages trades actively.
________________________________________
📰 Reaction to News
• Swing Trader: Interprets the macro/fundamental impact and positions accordingly.
• Scalper/Intraday: Reacts live to data releases, wicks, and intraday volatility.
________________________________________
📉 When They Struggle
• Swing Trader: Fails in choppy or directionless markets.
• Scalper/Intraday: Loses edge when the market trends explosively.
________________________________________
🧠 Psychological Requirements
• Swing Trader: Needs patience, confidence in the big picture, and acceptance of drawdown.
• Scalper/Intraday: Needs absolute discipline, emotional detachment, and razor-sharp focus.
________________________________________
✅ Bottom line: They are two different games.
Don’t try to play both on the same chart with the same mindset.
________________________________________
✅ Final Thoughts – Your Edge Is in Alignment, Not Imitation
You don’t pick a trading style because it “sounds cool.”
You pick it because it aligns with:
• Your schedule
• Your attention span
• Your tolerance for uncertainty
If you hate watching candles all day – go swing.
If you hate waiting for days – go intraday.
If you keep switching between both – go journal your pain and come back later.
P.S. Recent Example:
I'm a swing trader. And this week, Gold has been stuck in a range.
What do I do? I wait. No rush, no overtrading. Just patience.
Once the range breaks, I’m ready — in either direction.
But I don’t close after a quick 50–100 pip move. That’s not my game.
I aim for 700+ pips whether it breaks up or down,because on both sides we have major support and resistance levels that matter.
That’s swing trading:
📍 Enter with structure, hold with confidence, exit at significance.
Not every move is worth trading — but the big ones are worth waiting for.
Disclosure: I am part of TradeNation's Influencer program and receive a monthly fee for using their TradingView charts in my analyses and educational articles.
In trading, the long way is the shortcut⚠️ The Shortcut Is an Illusion — And It Will Cost You
In trading, everyone wants to arrive without traveling.
They want the profits, the freedom, and the Instagram lifestyle — even if it’s fake.
What they don’t want is the process that actually gets you there.
So they chase shortcuts:
• Copy signals without understanding the reason behind them
• Over-leverage on “the perfect setup”
• Buy indicators they don’t know how to use
• Skip journaling and backtesting
• Trade real money without trading psychology
And then they wonder…
Why is my account bleeding?
Why does this feel like a cycle I can't break?
Because:
Every shortcut in trading is just a fast track to disaster.
You will lose. You will restart. And it will take even longer than if you just did it right the first time.
🤡 The TikTok Fantasy: “1-Minute Strategy That Will Make You Millions in 2025”
This is the new wave:
A 60-second video showing you a magical indicator combo.
No context. No testing. No risk management.
Just fake PnL screenshots and promises of millionaire status before next summer.
“This 1-minute scalping strategy made me $12,000 today!”
And people fall for it… because it’s easier to believe in shortcuts than to accept that real trading is boring, repetitive, and hard-earned.
If it fits in a TikTok video, it’s not a strategy. It’s clickbait.
________________________________________
❓ Looking for a System Without Knowing the Basics
Here’s the paradox:
Most people are desperate to find a “profitable strategy” — but they haven’t even mastered the basic math of trading.
• They don’t know how pip value is calculated
• They don’t understand how leverage works
• They confuse margin with risk
• They size positions emotionally, not based on their account
• They can’t define what 1% risk per trade actually means in dollars
But they’re out here, loading indicators, watching YouTube “hacks,” and flipping accounts with 1:500 leverage.
Imagine trying to perform surgery before learning anatomy.
That’s what trying to trade a strategy without knowing pip cost looks like.
________________________________________
🛠️ The Long Way Is the Fastest Way
You want the real shortcut?
Here it is:
• Learn price structure deeply
• Backtest like a scientist
• Journal like a professional
• Risk small while you're learning
• Stay on demo until your edge is proven
• Master basic math: leverage, margin, pip value, position sizing
This is the long way.
But it’s the only way that doesn’t end in regret.
________________________________________
⏳ Most Traders Waste 2–5 Years Looking for a Shortcut
And in the end?
They crawl back to the long path.
Broke, humbled, and wishing they had just started there from the beginning.
The shortcut is a scam.
The long way is the only path that leads to consistency.
You either take it now… or take it later — after your account pays the price.
________________________________________
✅ Final Thought
Don’t ask how fast you can get profitable.
Ask how solid you can build your foundation.
Because in trading:
❌ The shortcut costs you everything
✅ The long way gives you everything
And the longer you avoid it, the longer it takes.
KOG - OILQuick look at Oil. There is a pivot here in the golden zone around the 70.5 level which we can dip into. Above that level, we would be looking for higher oil with the potential target level on the chart. Note, oil is due a huge pull back, so rejection from one of these resistance levels can give us that pull back in order to get better pricing to long.
We've added the red boxes from the indicator to help you navigate the move.
Please do support us by hitting the like button, leaving a comment, and giving us a follow. We’ve been doing this for a long time now providing traders with in-depth free analysis on Gold, so your likes and comments are very much appreciated.
As always, trade safe.
KOG

THE KOG REPORTTHE KOG REPORT:
In last week’s KOG Report we said we would be ideally be looking for the market to open, give us a high into that red box region 3455-60 and then give the reaction we wanted for the short trade. We didn’t quite hit that level falling just shy, but the move did present itself and as you can see all the bearish below red box targets were completed as well as KOG’s bias of the week targets which was bearish below 3465.
We then posted the FOMC KOG Report in which we suggested looking for price to continue the move as long as the bias level stood, which it did and we got another move downside, but again, falling just shy of the level we wanted to then attempt that swing long.
So, what can we expect in the week ahead?
As we suggested on Friday, it would be a good idea for traders to be sitting neutral on the markets with minimum to zero exposure anticipating gaps and glitches across the markets on open. This news was expected so those who played discipline should be cash in account, which is also a position in the markets.
We have key levels now 3350-55 support with extension 3340 which will need to break downside for us to go lower, while support there should take us up towards the 3385-90 level initially, which is the level to look for a potential RIP for the scalp short. This will give us the flip, red box activation 3380-75 which if held should allow us to complete the move to break through the 3400 level with red box target 3445 and above that 3451. This is based on there being a completely aggressive move from the open upside.
On the flip, break below key level here 3335 and 3320 is the first level to consider which will continue the path we wanted from last week. Ideally, not for this news and potential for this to spike upside, we would have stuck with the plan from last week. Difference now, we need more buyers higher up and a potential test on that high again.
Key Levels:
Red box defence 3375-80, needs to be broken
Red box defence 3350, needs to be broken
KOG’s bias of the week:
Bullish above 3340 with targets above 3375, 3390, 3395 and above that 3410
Bearish on break of 3340 with targets below 3330, 3320, 3310, 3306 and below that 3298
RED BOX TARGETS:
Break above 3375 for 3378, 3390, 3395, 3406, 3410 and 3419 in extension of the move
Break below 3365 for 3355, 3350, 3340, 3336, 3330 and 3323 in extension of the move
Please do support us by hitting the like button, leaving a comment, and giving us a follow. We’ve been doing this for a long time now providing traders with in-depth free analysis on Gold, so your likes and comments are very much appreciated.
As always, trade safe.
KOG

Your Trading System Isn't the Problem. Your Discipline Is.📘 Your Trading System Isn't the Problem. Your Discipline Is.
Hard truth:
Your endless search for a new system is a smokescreen.
The best system in the world can't save you from poor discipline.
Here's why discipline matters more than your strategy:
You quit your system after a few losses, never allowing it to prove its value.
You deviate from your rules when emotions run high—wrecking consistency.
You're focused on shiny objects instead of sharpening the knife you already have.
🎯 The solution?
Commit to discipline. Track your adherence rigorously. Measure your success by consistency, not immediate outcomes.
TrendGo’s power isn’t just in clear signals—it's in enabling disciplined action.
🔍 Stop blaming your tools. Own your discipline.

The Fundamental Truths About a Trending MarketBefore you can trade successfully, you must first understand what defines a market trend.
🔼 What is an Uptrend?
An uptrend is characterised by a series of Higher Highs (HH) and Higher Lows (HL). This signals that buyers are in control and price is climbing steadily.
🔽 What is a Downtrend?
A downtrend is identified by a series of Lower Lows (LL) and Lower Highs (LH). This indicates that sellers are dominant and price is consistently falling.
📌 Important Facts About a Trending Market
Trends don’t change easily. Once a trend is established, it tends to persist.
A trend reversal takes time and effort. It doesn't happen abruptly — the market needs a strong reason to change direction.
There are always warning signs. Before a trend changes, there’s usually a pattern or shift in behaviour that acts as a clue.
The bigger the trend, the longer it takes to reverse. A well-established trend will require more time and evidence before it breaks.
🎯 Keys to Trading Any Market Successfully
Identify the market condition.
Is the market trending upwards, downwards, or moving sideways (consolidating)?
Study price behaviour at key levels.
Understand how price reacts at significant highs and lows.
Learn the anatomy of price waves.
Recognise wave structure — how price expands and contracts in trends.
Align your trades with the market condition.
Your entry and exit strategies should fit the current phase of the market.
🔚 Summary
Mastering trends is one of the most important skills in trading. When you understand what defines an uptrend or downtrend, recognise when a trend may be ending, and align your strategy with the market condition, you set yourself up for consistent success. Patience, observation, and timing are key — because the market always leaves clues, but only for those who are prepared to see them.

USDJPY: Will This CRT FVG Hold After the PWL Sweep?Price action on USDJPY reflects a clean execution of Candle Range Theory (CRT). Following a sweep of the Previous Week’s Low (PWL), price reacted from a higher timeframe demand zone, grabbing sell-side liquidity before printing a bullish Break of Structure (BOS). This BOS confirmed a shift in market intent and set the stage for a retracement into a clearly defined Fair Value Gap (FVG). I refined the entry on the 4H chart, waiting for price to return to the FVG zone, with risk placed just below the sweep wick. The target is mapped to the next logical supply above a cluster of equal highs and prior inefficiency. This setup reflects a high-conviction CRT play, built from top-down analysis and confluences rooted in market structure, liquidity, and imbalance logic.

Is This the Optimal Entry After a PDL Sweep and FVG Retest?A clean structural development on CHFJPY (1H TF)
After sweeping the Previous Day’s Low (PDL), price created a bullish Break of Structure (BOS) to the upside , shifting short-term sentiment. This BOS was followed by a precise retest into a Fair Value Gap (FVG), suggesting possible continuation as liquidity shifts from weak hands to strong.
🧠 Educational Notes :
CRT Sweep Logic: Market often sweeps the previous day's high or low before making its true move. In this case, a clean PDL sweep was followed by a strong bullish reaction.
Break of Structure (BOS): Confirmed bullish intent after the sweep, validating a shift in order flow.
FVG Retest: Institutional pricing inefficiency filled — a classic SMC continuation behavior.
Entry Thesis: Based on reaction from FVG + BOS confirmation, with invalidation below the swept low and TP near the previous swing high.
This setup is not financial advice, but a clear visual case study for traders applying SMC + CRT logic.

When and How to Use Weekly Time Frame in Gold Forex Trading
Ignoring weekly time frame chart analysis could cost you big losses in Forex, Gold trading!
Discover 3 specific cases when weekly time frame beats daily time frame analysis.
Learn the situations when weekly timeframe exposes what daily charts can’t, how to analyze it properly and when to check it.
1. Long-term historic levels
When the market trades in a strong bullish or bearish trend and goes beyond recent historic levels, quite often the daily time frame will not be sufficient for the identification of significant supports and resistances.
The proven way to identify the next meaningful levels will be to analyze a weekly time frame.
Examine a price action on EURAUD forex pair on a daily time frame chart. The market is trading in a strong bullish trend and just updated the high.
Checking the historic price action, we don't see any historic resistance on the left.
Switching to a weekly time frame chart, we can easily recognize a historic resistance that the price respected 5 years ago.
That's a perfect example when weekly t.f revealed a historic price action that a daily didn't.
2. Trend-lines
Weekly time frame analysis is important not only for a search of historic levels. It can help you find significant vertical structures - the trend lines.
We can easily find several meaningful historic resistances on EURUSD pair on a daily time frame.
Though, there are a lot of historic structures there, let's check if there are some hidden structures on a weekly.
Weekly time frame reveals 2 important trend lines, one being a vertical support and another being a vertical resistance.
With a daily time frame analysis, these trend lines would be missed .
3. More accurate breakout confirmations
Some false support and resistance breakouts that you see on a daily could be easily avoided with a weekly time frame analysis.
Quite regularly, a daily time frame support or resistance is in fact a weekly structure. And for its breakout, a weekly candle close will provide more accurate confirmation.
From a daily time frame perspective, we see a confirmed breakout - a daily candle close above a solid resistance zone.
It provides a strong bullish signal on AUDUSD forex pair.
However, the violation turned out to be false and dropped.
Such a false breakout , could be easily avoided, checking a weekly time frame chart.
The underlined resistance is in fact a weekly structure.
The price did not manage to close above, and perfectly respected that, starting to fall after its test.
Such a deeper analysis would completely change our bias from strong bullish (based solely on a daily) to strongly bearish (based on a daily AND weekly)
Remember This
Do not ignore and always check a weekly time frame.
It shows a unique perspective on the market and reveals a lot of hidden elements that you would not notice.
No matter whether you are a scalper, day trader or swing trader,
remember that weekly time frame structures are very impactful and accumulate large trading volumes.
❤️Please, support my work with like, thank you!❤️
I am part of Trade Nation's Influencer program and receive a monthly fee for using their TradingView charts in my analysis.

Understanding Market StructureIn this video, I break down market structure in a simple and easy-to-digest way, helping you understand how to identify whether the market is in an uptrend or downtrend.
Recognizing market direction is a key skill for any trader, it allows you to trade in alignment with price action and make more confident, higher-probability decisions.
✅ If you're new to trading or want to sharpen your edge, this video will give you the insights needed to read market trends more clearly.
📈 Hope you find value in this breakdown!
👉 Don’t forget to like, comment, and subscribe to support the channel and stay tuned for more educational content.

Positive Psychology in TradingTrading isn’t just about numbers, charts, or quick decisions. It’s an intense emotional experience, a constant mental challenge, and often a major source of stress.
That’s why more traders are turning to positive psychology—a modern psychological approach that explores what makes people thrive, even under pressure and uncertainty.
What is Positive Psychology?
Founded by Martin Seligman, positive psychology focuses on positive emotions, strengths, and the conditions that lead to a fulfilling life. Unlike traditional approaches that look at “what’s wrong,” it asks: What’s going right? and How can we build on it?
The PERMA model (Positive Emotion, Engagement, Relationships, Meaning, Achievement) serves as a powerful framework—even in the world of trading.
________________________________________
How Does It Apply to Trading?
1. Positive Emotions – Calm Before the Click
Trading isn’t about euphoria or panic—it’s about equilibrium. Cultivating positive emotions like gratitude or realistic optimism helps you:
• Reduce impulsivity
• Build emotional resilience
• Make clearer decisions under pressure
Try this: At the end of each trading day, write down 3 things that went well and why. This trains your brain to see progress, not just mistakes.
________________________________________
2. Engagement (Flow) – Get in the Zone
Flow is that state of complete absorption in what you're doing. In trading, it means:
• Deep focus without mental fatigue
• Quick yet thoughtful decisions
• A fulfilling experience, win or lose
How to reach it? Schedule short, focused trading sessions with no distractions and a clear plan.
________________________________________
3. Positive Relationships – You’re Not Alone
Trading can be solitary—and at times, frustrating. A positive community of fellow traders can:
• Reduce isolation
• Offer constructive feedback
• Boost your motivation
Pro tip: Join a trading group that values learning and support, not just fast wins.
________________________________________
4. Meaning – Why Do You Trade?
Without a deeper why, trading becomes a stressful gamble. When you have a clear sense of purpose (financial freedom, personal growth, discipline), it’s easier to:
• Stay consistent during drawdowns
• Stick to your plan
• Avoid burnout
________________________________________
5. Achievement – Celebrate the Process, Not Just the Profits
Positive psychology emphasizes progress over perfection. In trading, this might mean:
• A full week of disciplined trades = success
• Following your strategy = a win
• Avoiding overtrading = growth
________________________________________
Final Thoughts
Positive psychology isn’t about “happy thoughts” or ignoring risk. It’s about building a resilient, balanced, and healthy mindset—a crucial asset for any long-term trader.
If you want to become a high-performing trader, don’t focus only on strategies and charts. Learn to master your emotions, develop your inner strengths, and trade with purpose.

Candlestick Patterns + Trend and Momentum: A Perfect CombinationCandlestick patterns provide valuable insights into price action, showing potential reversals, continuations, or market indecision. However, to significantly improve their effectiveness, combining candlestick analysis with trend and momentum indicators is essential. Here’s how you can use these combinations to trade with more confidence and accuracy.
1. Why Candlestick Patterns Matter
Candlestick patterns visually represent traders’ psychology through price movements, including four key prices: Open, Close, High, and Low. Some of the most common and useful patterns include:
Doji: Indicates market indecision and potential reversals.
Hammer & Hanging Man: Signals possible trend reversals at support or resistance.
Engulfing Pattern: Often marks the beginning of a significant reversal.
Morning/Evening Star: Combination patterns that strongly suggest a trend reversal.
2. Adding Trend and Momentum Indicators
Candlestick patterns alone might lead to false signals or confusion. By pairing them with other technical tools, such as moving averages, RSI (Relative Strength Index), or MACD (Moving Average Convergence Divergence), you gain crucial context to confirm the reliability of the patterns.
Here’s how:
Trend Alignment:
Using moving averages, such as the 20 or 50-period EMA, helps confirm whether a bullish candlestick pattern appears in an uptrend (strengthening the signal) or countertrend (potentially weaker signal).
Momentum Confirmation:
Oscillators like the RSI or MACD can confirm the underlying momentum behind a candlestick pattern. For instance, a bullish engulfing pattern becomes more reliable if it coincides with RSI moving upward from oversold territory or MACD showing a bullish crossover.
Volume Analysis:
Higher volume on the candle that forms the pattern typically confirms increased market interest and strengthens the validity of the signal.
3. Practical Example: Bullish Engulfing + RSI
Imagine you spot a bullish engulfing pattern forming at a clear support level after a downtrend:
Step 1: Identify the Pattern: Confirm the bullish engulfing visually.
Step 2: Check RSI: Ensure RSI is below 30 or rising, signaling oversold conditions and potential bullish momentum.
4. Why This Approach Works
Enhanced Accuracy: Combining candlestick signals with trend and momentum indicators increases signal reliability.
Improved Risk Management: Clearer signals mean more confident entries and better-defined stop-loss levels.
Reduces False Signals: Multiple confirmations reduce the risk of false breakouts or reversals.
5. Final Tips
Always look for multiple confirmations (trend, momentum, volume) before making trade decisions based solely on candlestick patterns.
Be patient—waiting for full confirmation can help avoid premature trades.
Regularly backtest and practice recognizing these combined signals to strengthen your trading strategy.

How to Regain Your Trading MOJOEvery trader, no matter how experienced, eventually hits a rough patch — a period where trades don’t work out, motivation fades, and confidence slips away.
If you feel like you've lost your trading mojo, you're not alone. The key is not to quit but to rebuild it methodically.
Here’s how to get your trading energy back on track:
1. Accept That Slumps Are Normal
First, realize that losing your mojo is part of the trading journey.
Even the best traders experience drawdowns — emotionally and financially.
Acknowledging that this phase is temporary immediately removes some of the pressure and guilt.
Self-acceptance is your first weapon.
2. Reduce Risk and Slow Down
When your confidence is low, lower your position size.
Trade smaller. Risk less.
You don’t need to stop trading completely — you need to stop damaging yourself further.
Think of it as “active recovery,” much like athletes training lightly after an injury.
3. Go Back to Basics
Strip your trading plan down to the essentials:
- Focus on one setup you trust.
- Use clear entry and exit rules.
- Avoid complicated strategies or "revenge trading."
Simplicity restores clarity, and clarity brings confidence.
4. Reframe Losses Mentally
Instead of seeing losses as failures, view them as fees for learning.
Ask yourself after each trade:
- "Was this trade according to my plan?"
- "Did I respect my stop loss?"
If yes, you are winning — even if the trade loses money.
Consistency in good decision-making rebuilds emotional momentum.
5. Visualize the Trader You Want to Be
Take 5 minutes each day to visualize yourself executing perfect trades:
- Calmly analyzing.
- Patiently waiting.
- Executing your plan without emotion.
Your brain needs new emotional associations with trading — not fear and anxiety, but calm and focus.
6. Set Tiny Wins
Don't chase the big win right away.
Set micro-goals like:
- "I will follow my stop loss rules today."
- "I will not overtrade today."
- "I will wait for my setup."
Achieving small wins daily rebuilds your trader identity brick by brick.
Final Thoughts :
Regaining your trading mojo is less about finding a "magic moment" and more about stacking good habits and resetting your mind.
You don't need a new system, a new market, or a lucky break.
You need to reconnect with the disciplined, focused trader within you.
Stay patient, stay structured, and remember — your mojo isn’t lost forever. It’s just waiting for you to catch up. 🚀

Trading Psychology Trap: The Dark Side of Hedging a Bad Trade⚡ Important Clarification Before We Begin
In professional trading, real hedging involves sophisticated strategies using derivatives like options, futures, or other financial instruments.
Banks, funds, and major institutions hedge to manage portfolio risk, based on calculated models and complex scenarios.
This article is not about that.
We are talking about the kind of "hedging" retail traders do — opening an opposite position at the broker to "protect" a losing trade.
It may feel smart in the moment, but psychologically, it can be a hidden trap that damages your trading discipline.
Let’s dive into why emotional hedging rarely works for independent traders.
________________________________________
In trading, there’s a moment of panic that every trader has faced:
"My short position is in the red… maybe I’ll just open a long to balance it out."
It feels logical. You’re hedging. Protecting yourself. But in reality, you might be stepping into one of the most deceptive psychological traps in trading.
Let’s unpack why emotional hedging is rarely a good idea—and how it quietly sabotages your progress.
________________________________________
🧠 1. Emotional Relief ≠ Strategic Thinking
Hedging often arises not from a solid strategy, but from emotional discomfort.
You don’t hedge because you’ve analyzed the market. You hedge because you can’t stand the pain of a losing position.
This is not trading.
This is emotional anesthesia.
You’re trying to feel better—not trade better.
________________________________________
🎭 2. The Illusion of Control
Opening a hedge feels like taking back control.
In reality, you’re multiplying complexity without clarity.
You now have:
• Two opposing positions
• No clear directional bias
• An unclear exit strategy
You’ve replaced one problem (a loss) with two: mental conflict and strategic confusion.
________________________________________
🎢 3. Emotional Volatility Rises Sharply
With two positions open in opposite directions:
• You root for both sides at once.
• You feel relief when one wins, and stress when the other loses.
• Your mind becomes a battleground, not a trading desk.
This emotional volatility leads to irrational decisions, fatigue, and trading paralysis.
________________________________________
🔄 4. You Delay the Inevitable
When you hedge a losing position, you don’t fix the mistake.
You prolong it.
Eventually, you’ll have to:
• Close one side
• Add to one side
• Or exit both at the wrong moment
Hedging here is just postponed decision-making—and it gets harder the longer you wait.
________________________________________
🧪 5. You Build a Dangerous Habit
Hedging out of fear creates a reflex:
"Every time I’m losing, I’ll hedge."
You’re not learning to cut losses or reassess your strategy.
You’re learning to panic-protect.
And over time, you start to rely on hedging as a crutch—rather than developing real confidence and discipline.
________________________________________
✅ The Healthier Alternative
What should you do instead?
• Cut the loss.
• Review the trade.
• Wait for a fresh setup that aligns with your plan.
Accepting a losing trade is hard. But it’s a sign of maturity, not weakness.
Hedging may feel clever in the moment, but long-term consistency comes from clarity, not complication.
________________________________________
🎯 Final Thought
Emotional hedging isn’t about strategy.
It’s about fear.
The best traders don’t hedge to escape a loss.
They manage risk before the trade starts —and have the courage to close what’s not working.
Don’t fall into the illusion of safety.
Master the art of decisive action. That’s where real edge lives. 🚀

Serios Traders Trade Scenarios, Not Certaintes...If you only post on TradingView, you're lucky — moderation keeps discussions professional.
But on other platforms, especially when you say the crypto market will fall, hate often knows no limits.
Why?
Because most people still confuse trading with cheering for their favorite coins.
The truth is simple:
👉 Serious traders don't operate based on certainties. They work with living, flexible scenarios.
In today's educational post, I'll show you exactly how that mindset works — using a real trade I opened on Solana (SOL).
________________________________________
The Trading Setup:
Here’s the basic setup I’m working with:
• First sell: Solana @ 150
SL (stop-loss): 175
TP (take-profit): 100
• Second sell: Solana @ 160
SL: 175
TP: 100
I won’t detail here why I believe the crypto market hasn’t reversed yet — that was already explained in a previous analysis.
Today, the focus is how I prepare my mind for different outcomes, not sticking to a fixed idea.
________________________________________
The Main Scenarios:
Scenario 1 – The Pessimistic One
The first thing I assume when opening any position is that it could fail.
In the worst case: Solana fills the second sell at 160 and goes straight to my stop-loss at 175.
✅ This is planned for. No drama, no surprise. ( Explained in detail in yesterday's educational post )
________________________________________
Scenario 2 – Pessimistic but Manageable
Solana fills the second sell at 160, then fluctuates between my entries and around 165.
If I judge that it’s accumulation, not distribution, I will close the trade early, taking a small loss or at breakeven.
________________________________________
Scenario 3 – Mini-Optimistic
Solana doesn’t even trigger the second sell.
It starts to drop, but stalls around 120-125, an important support zone as we all saw lately.
✅ In this case, I secure the profit without waiting stubbornly for the 100 target.
Important tactical adjustment:
If Solana drops below 145 (a support level I monitor), I plan to remove the second sell and adjust the stop-loss on the initial position.
________________________________________
Scenario 4 – Moderately Optimistic
Solana doesn’t fill the second order and drops cleanly to the 100 target.
✅ Full win, perfect scenario for the first trade
________________________________________
Scenario 5 – Optimistic but Flexible
Solana fills the second sell at 160, then drops but gets stuck at 120-125(support that we spoken about) instead of reaching 100.
✅ Again, the plan is to close manually at support, taking solid profit instead of being greedy.
________________________________________
Scenario 6 – The Best Scenario
Solana fills both sell orders and cleanly hits the 100 target.
✅ Maximum reward.
________________________________________
Why This Matters:
Scenarios Keep You Rational. Certainties Make You Fragile.
In trading, it's never about being "right" or "wrong."
It's about having a clear plan for multiple outcomes.
By thinking in terms of scenarios:
• You're not emotionally attached to a single result.
• You're prepared for losses and quick to secure wins.
• You're flexible enough to adapt when new information appears.
Meanwhile, traders who operate on certainties?
They get blindsided, frustrated, and emotional every time the market doesn’t do exactly what they expected.
👉 Trading scenarios = trading professionally.
👉 Trading certainties = gambling with emotions.
Plan your scenarios, manage your risk, and stay calm. That's the trader's way. 🚀

Why I Deal With Losses Before They Even Appear📉 Mastering the mindset that most traders avoid
There’s a moment that happens in every trader’s journey — not during a win, but during a loss.
A frozen moment where your mind screams, “It shouldn’t have gone this way!”
You look at the screen, your stop is hit, your equity drops, and your brain starts the negotiation:
“What if I held a bit longer?”
“Maybe the stop was too tight.”
“I need to make this back. Now.”
But the problem didn’t start with that loss.
It started long before you placed the trade.
________________________________________
💡 The Biggest Lie in Trading: “I’ll Deal With It When It Happens”
Too many traders operate from a place of reactivity.
They focus on the chart, the breakout, the “R:R,” the indicator... but they forget the only thing that actually matters:
❗️ What if this trade fails — and how will I handle it?
That’s not a pessimistic question.
It’s the most professional one you can ask.
If you only accept the possibility of a loss after the loss happens, it’s too late.
You’ve already sabotaged yourself emotionally — and probably financially, too.
So here's the core principle I apply every single day:
________________________________________
🔒 I Accept the Loss Before I Enter
Before I click "Buy" or "Sell," I already know:
✅ What my stop is.
✅ How much that stop means in money.
✅ That I am 100% okay losing that amount.
If any of those don’t align, the trade is dead before it begins.
This is not negotiable.
________________________________________
🚫 Don’t Touch the Stop. Touch the Volume.
One of the biggest mistakes I see — and I’ve done it too, early on — is this:
You find a clean technical setup. Let’s say the proper stop is 120 pips away.
You feel it’s too wide. You want to tighten it to 40. Why?
Not because the market structure says so — but because your ego can’t handle the potential loss.
❌ That’s not trading. That’s emotional budgeting.
Instead, keep the stop where it technically makes sense.
Then reduce the volume until the potential loss — in money, not pips — is emotionally tolerable.
We trade capital, not distance.
________________________________________
🧠 This Is the Only Risk Model That Makes Sense
Your strategy doesn’t need to win every time.
It just needs to keep you in the game long enough to let the edge play out.
If your risk is too big for your mental tolerance, it’s not sustainable.
And if it’s not sustainable, it’s not professional trading.
The goal isn’t to be right. The goal is to survive long enough to be consistent.
________________________________________
📋 My Framework: How I Deal with Losses Before They Show Up
Here’s my mental checklist for every trade:
1. Accept the loss before entering.
If I’m not okay losing X, I reduce the volume or skip the trade.
2. Set the stop based on structure, not comfort.
If the setup needs a 150-pip stop, so be it. It’s not about feelings.
3. Adjust volume to match my comfort zone.
I never trade “big” just because a setup looks “great.” Ego has no place here.
4. View trades as part of a series.
I expect losses. I expect drawdowns. One trade means nothing.
5. Be willing to exit early if the story changes.
If price invalidates the idea before the stop is hit (or the target), I’m gone.
________________________________________
🧘♂️ If You Can’t Sleep With the Trade, You’re Doing It Wrong
Peace of mind is underrated.
If a trade is making you anxious — not because it’s near SL, but because it’s threatening your sense of control — something is off.
And that something is usually your risk size.
Professional trading isn’t built on adrenaline.
It’s built on calm decisions, repeated for years.
________________________________________
🏁 Final Thoughts: Profit is Optional. Loss Management is Mandatory.
If you want to become consistent, start every trade with a simple, brutally honest question:
“Can I lose this money and still feel calm, focused, and in control?”
If the answer is no, you’re not ready for the trade — no matter how good the chart looks.
Profit is a possibility.
Loss is a certainty.
Master the certainty. The rest will follow.
🚀 Keep learning, keep growing.
Best of luck!
Mihai Iacob

No Setup, No Trade: Staying Sane in Gold’s MadnessToday, Gold hit $3500.
And while that may not sound like a shock on its own, what is unprecedented is the fact that in the past 10 days, Gold has climbed 5,000 pips.
That's not a normal rally.
That’s a vertical explosion.
And yes — it is looking “overextended”, but so it dit at 3300...
But then it went up another 2000 pips.
Will it drop? Probably — and hard.
When? No one knows.
Will it rise another 2000 pips before that?
Again, no one knows.
This is where most traders lose themselves — not because they don’t have tools, but because they pretend to know what’s unknowable.
________________________________________
🎯 The Strongest Skill: Admit When You Don’t Know
Every trader wants clarity.
But real professionals know when they’ve entered the fog.
The market is not obligated to give you structure just because you want to trade.
And the worst trades often happen when:
• You think it's overbought (but it keeps going)
• You think it’s due for a correction (but it doesn't care)
• You think it can't go higher (but it does)
This isn’t analysis — it’s wishful thinking.
________________________________________
🧠 Do You Actually Have Edge? Ask Yourself:
1. Do I see a structured setup, or just a reaction to “how far it’s gone”?
2. Can I define my entry, stop, and exit in advance?
3. Am I trading because I have a plan — or because it feels like a top (or simply have nothing better to do)?
If you can’t answer these — you don’t have edge.
You’re just guessing with conviction.
________________________________________
✅ The Only Thing That Matters: A Valid Trade
If you’re going to trade this madness, make sure your trade is:
• Planned (with defined risk)
• Repeatable (not emotional)
• Based on structure or volatility patterns
Otherwise, it’s just ego vs. market.
And the market always wins that fight.
________________________________________
🧘♂️ Final Thought: When Things Get Wild, Stay Sane
There’s no shame in stepping aside when things make no sense.
In fact, that’s where the real skill begins.
“Knowing when you don’t know isn’t weakness — it’s your strongest edge.”
So take a breath.
Zoom out.
And wait for the moment when you actually know what you're doing — not just think you do.
________________________________________
And remember:
No setup, no trade. No clarity, no risk. No ego, no drama.
Disclosure: I am part of Trade Nation's Influencer program and receive a monthly fee for using their TradingView charts in my analyses and educational articles.
