USOIL.. Breakout!? what's next??#USOIL.. perfectly break our area with further drop.
It market continue his drop the. It will leads you towards downside next mentioned areas.
Don't buy until any confirmation.
Good luck
Trade wisely
Tradingpatterns

EUR/JPY Trade Setup 4 Hour TimeframeEUR/JPY has formed a descending channel on the 4-hour timeframe, followed by a strong breakout and a retest.
The price is currently at the retest level, so we will be looking for buy candlestick signals from this level.
To find a suitable entry, we need to scale down to the lower timeframes to identify chart patterns and candlestick confirmations.

NVIDIA to $180Overview
It's a good mindset to be skeptical about a bull market that doesn't seem like it should exist. The GDP (Gross Domestic Product) has declined for a second consecutive quarter to a 24 month low and the Civilian Unemployment Rate is the highest it's been since Nov 2021. This leads me to believe that the current rally is being mostly fueled by two factors surrounding artificial intelligence: hype and revenue. NASDAQ:NVDA is the leading A.I. developer and hasn't experienced a decrease in quarterly revenue since November 2022.
When faced with the unknown -- which in this case would be the direction of the stock market -- people cling to what they know. I believe this will present itself in more clearly defined trading patterns and price-swing predictability.
Technicals
NVDA is setting up a pattern that resembles the 5 Elliott Impulse Waves with each wave taking between 3-4 months to develop. If accurate, the trough of the 4th wave could find the share price in the proximity of $100-115.
I utilized Fibonacci levels against the low of the 2nd wave to the high of the 3rd wave. In addition to helping find a support level for the 4th wave, the uptrend Fibonacci tool also provided a projected price target near $180. I compared the 1.618 (161.8%) micro-Fibonacci retracement to the 1.618 macro-Fibonacci retracement, which consumes the entirety of the already existing patterns.
I took the difference of $18.19 between the projected 1.618 Fib levels then created a low and high range where I believe the 5th wave will peak. I ended my projection at this point, however, it is worth noting that impulse waves are followed by correction waves which serve in the opposite trending direction.

USOIL - at support? What's next??#USOIL.. market just reached at his supporting area and importantnt thing is market closed his day candle above his supporting area.
That is around 73.90
Keep close that area because if market hold it then again bounce expected from here.
Good luck
Trade wisely

GOLD - still valid short, holds region one more time.#GOLD... perfectly moved as per our video analysis and holds our resistance 2531 to 2535
So again it's a valid region and valid short below that region.
Keep close and don't holds buying until market hold that..
Stay sharp
Good luck
Trade wisely

BTCUSDT - reached at ultimate support? What's next??#BTCUSDT.. market just reached at his ultimate supporting area n region.
That is around 57300 to 58000
Keep close that region because if market clear that region then a new selling volume can be occur.
Don't be lazy here...
Good luck
Trade wisely

GOLD - still valid short ? what's next??#GOLD - so far market perfectly holding our resistance region that was discussed in our video analysis.
and guys keep in mind that that is still valid short and until market holding our above resistance region.
IT WILL NEVER EVER BREAK OR CLEAR 2535 BEFORE ANY NEWS FROM WAR SIDE OR UNEXPECTED INTEREST RATE SIDE.
keep close and don't go for a long , yes you can do it for scalp or in shorter time frame.
stay sharp.
good luck
trade wisely

GOLD - near to his most expensive region? What's next??#GOLD... Well guys market placed 2531 around as his ATH.
And according to technical point of view from 2531 to 2535 is market strong resistance zone.
So holding of that means ATH is placed for now so far and drop expected from here.
Only only selling will be invalidate above that region otherwise not.
Stay sharp
Good luck
Trade wisely

Breakout Alert: KSM Surges as Falling Wedge Pattern Shatters!🚨 NYSE:KSM is breaking out of a Falling Wedge pattern on the 1D chart, which is typically a bullish reversal signal.
📈 Entry Point: $20.00 to $22.00
🎯 Targets:
$26.93
$33.75
$49.80
$64.13
🔄 Trading Options: NYSE:KSM is available for trading in both spot and futures markets. You can purchase it on the spot market, or if you prefer to go long on futures, consider setting a stop-loss at $18.00.
📊 About NYSE:KSM :
KSM (Kusama) is a scalable, multichain network for radical innovation in the blockchain space. It serves as a testing ground for Polkadot, offering developers the opportunity to experiment and fine-tune their projects before deploying them on Polkadot’s main network.
📢 DYOR, NFA

GBPUSD... Most expensive area of the month? Next??#GBPUSD... Market just reached at his most expensive area of the month and that is 1.2960
It's the area that is holding so many times in history you can check in week and day chart as well.
Keep close that level guys because it can change the pound next price action and overall chart point of view.
Don't hold your short above that area.
Good luck
Trade wisely

USDCAD.. support broke? What's next??#USDCAD... Market just below his major supporting area that was actually 1.3660
Keep lcose it because of market hold it now then further drop on table..
Stay sharp ..
Good luck
Trade wisely

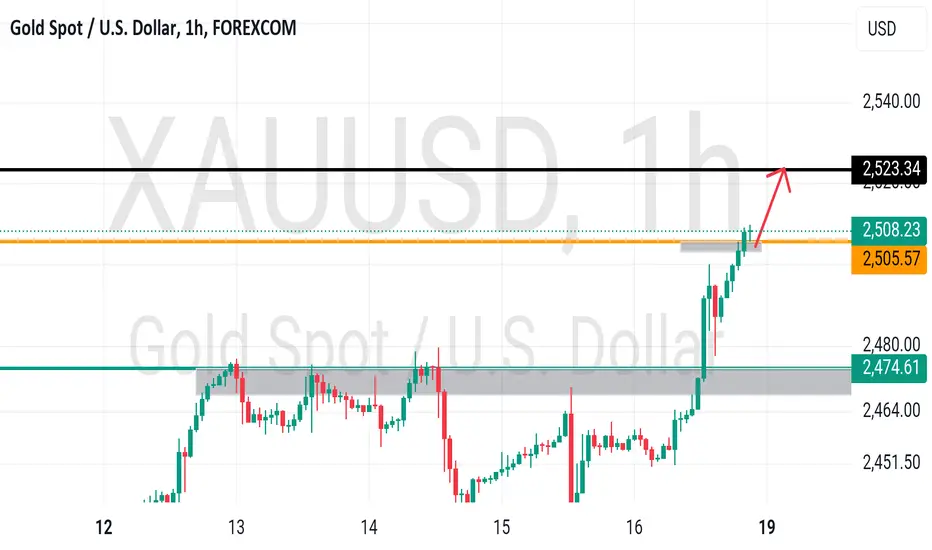
GOLD... At his one n only support? What's next??#GOLD.. after breakouy in last week market now at his immediate supporting area that is 2504 05
Keep close that level.
That is one n only support of gold for now.
And keep in mind below that cut n reverse still exist..
Good luck
Trade wisely
USOIL.. at most expensive area? What's next??#USOIL.. well market again near to his most expensive area around 72
As you can see a massive holding of this area is history and now again market at this level.
Guys it will be market most expensive breakage if breaks and holding means again upside momentum can be possible .
But cut n reverse keep in hand.
Good luck
Trade wisely

USDJPY.. at major support? What's next??#USDJPY.. market just near to his major supporting levels.
That is around 144.60 to 146 figures around 30 50 pips region is supporting region.
Market should hold it for create again upside volume.
If market hold that region in that case you can see a bounce from here otherwise not ..
Only below 144.60 can be invalidate buying otherwise not at all.
Good luck
Trade wisely

GOLD.. again bottom out here?? What's next?#GOLD.. so far perfect move as per our analysis and market trade above 2448 in asian session.
It's a good sign for buyers,
Now we have only 2448 for a support of the day and if market hold it further rising expected.
Good luck
Trade wisely
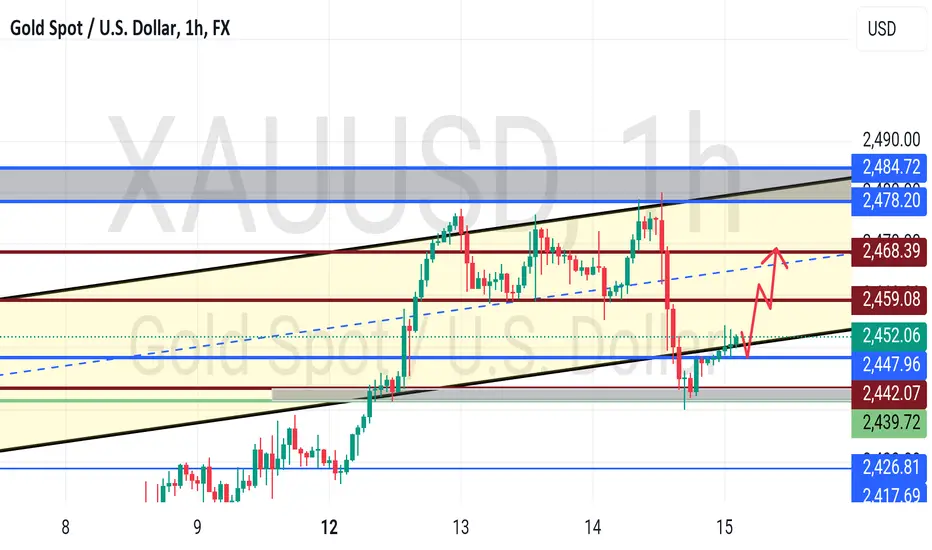
GOLD - at his ultimate resistance, holding or not??#GOLD.. so far perfect move as per our analysis, and now market at his ultimate resistance area that is around 2479 to 2484 around 5 points.
that region can change the scenarios of gold.
keep close it because if market it in that case you can see a drop towards your further downside areas that's are mentioned.
but keep in mind above resistance region keep cut n reverse in hand.
good luck
trade wisely

GOLD 1H CHART ROUTE MAP UPDATEHey Everyone,
Another piptastic day on the charts with our trading idea playing out perfectly!!
After completing all the open targets yesterday, we advised that we were now looking for ema5 to lock above 2459 to open 2475 and failure to lock above this level will follow with a rejection to find support on the lower Goldturns.
- We got the cross and lock above 2459 opening 2475 with plenty of time and gap to get in for the action and BOOOOOM!!! This was hit perfectly respecting the Goldturn.
We will now look for ema5 to cross and lock above 2475 to open 2488 and potentially 2500 or failure to lock above this level will follow with a rejection into the lower Goldturn support levels for bounces.
We will keep the above in mind when taking buys from dips. Our updated levels and weighted levels will allow us to track the movement down and then catch bounces up.
We will continue to buy dips using our support levels taking 30 to 40 pips. As stated before each of our level structures give 20 to 40 pip bounces, which is enough for a nice entry and exit. If you back test the levels we shared every week for the past 24 months, you can see how effectively they were used to trade with or against short/mid term swings and trends.
BULLISH TARGET
2434 - DONE
EMA5 CROSS AND LOCK ABOVE 2434 WILL OPEN THE FOLLOWING BULLISH TARGET
2446 - DONE
2459 - DONE
EMA5 CROSS AND LOCK ABOVE 2459 WILL OPEN THE FOLLOWING BULLISH TARGET
2475 - DONE
BEARISH TARGETS
2421
EMA5 CROSS AND LOCK BELOW 2421 WILL OPEN THE FOLLOWING BEARISH TARGET
2408
2396
EMA5 CROSS AND LOCK BELOW 2396 WILL OPEN THE SWING RANGE
SWING RANGE
2380 - 2360
As always, we will keep you all updated with regular updates throughout the week and how we manage the active ideas and setups. Thank you all for your likes, comments and follows, we really appreciate it!
Mr Gold
GoldViewFX

BTCUSDT.. at most expensive support, hold or not??#BTCUSDT.. well guys market at his most expensive supporting area around 58k
Keep close that region in yellow that will be your area.
As you can see market holding this area from last sessions.
If market clear that level then further drop expected towards our next areas.
Good luck
Trade wisely

GOLD.. reached at resistance? What's next??#GOLD... well guys market perfectly moved as per our analysis and now market at his most important resistance area that is from 2427 to 2431 around.
Means that 3 or 4 points region can change the story.
Because if market clear that area means it will again enter in your channel and then it can move up to channel top again. But it will happen only above your resistance zone.
Keep close that region because I'd market hold it then again drop expected from here.
Good luck
Trade wisely

Intel - Is this for real?NASDAQ:INTC created a top formation and is dropping hashly ever since - be careful!
Click image above to see detailed analysis
Catching falling knifes will go wrong 9 out of 10 times and you will cut yourself very badly. Just in a couple of months, Intel is down about -65% and is not slowing down at all. This honestly seems like the possibility of bankruptcy is not that far away and investors and trader should be extra careful. We have support coming soon, but the question is: will it stabilize price?
Levels to watch: $18
Keep your long term vision,
Philip - BasicTrading

GOLD - very expensive area, will hold or not??#GOLD... Market perfect moved as per our video analysis in yesterday.
Guys keep in mind and note that area or region is one n single that 2372 73 around.
Keep close that area because that's the that can change the overall scnerio.
Only holding of that level means you can see anytime bounce in gold price.
But in case market clear that level then scene will change at immediately basis.
So CUT N REVERSE keep in hand only below 2372 73..
Don't be lazy here
Good luck
Trade wisely

GOLD - at his one n only support, hold or not??#GOLD.. after Friday sell off market now at his one n only supporting area that is 2437 around .
Keep close that area because if market hold in that case you can see again bounce from here otherwise not at all.
Only short below that support.
Keep close it and don't be lazy here .
Good luck
Trade wisely

EUR/USD Trade Setup on 4-Hour TimeframeEUR/USD has formed a descending channel on the 4-hour timeframe, characterized by lower lows and lower highs following a strong breakout.
currently waiting for a retest of the broken lower high structure level, which is also aligning with the Fibonacci retracement level.
Once price has reached this level we will scale down to the lower timeframe of 30 mins to find our entry based on candlesticks patterns
