GOLD - cup formation? Holding or not??#GOLD.. it was perfect move as per our video analysis and now market is in cup formation.
Keep close it because until market didnot break cup neck line don't short..
Only short below neck line.
Good luck
Trade wisely
Tradingpatterns

TRBUSDT..near support ? Holding or not?#TRBUSDT... Well guys market perfectly break 91 and placed rece t lows.
Now market have 77.20 around supporting area, that will play key role in next move.
Keep close it because eif market hold it in that case you can see again bounce from here otherwise below that area next areas are mentioned on chart.
Don't be lazy here.
Good luck
Trade wisely

SILVER.. at today supporting area? hold or not???#SILVER.. perfectly placed day low according to our video analysis and keep close that region because its our today most importnat region as a supporitng area.
if market hold it that only case you can see again bounce from here other not.
that region is 30.90 around.
good luck
trade wisely

APOLLO HOSPITAL / SWING TRADE # GOOD STRONG CLOSE
#TRADING OUTSIDE A CONSOLIDATION ZONE
# SL 6300
ALWAYS TAKE RISK REWARD IN TO ACCOUNT .IT IS THE CORE STRENGHT OF TRADING.
NO MATTER WHAT END OF THE DAY WHAT YOU EARN - WHAT YOU LOSE =RETURNS
"Investing in the stock market involves balancing risk and reward. Higher potential returns typically come with higher risk, while safer investments may offer lower returns. It's essential to assess your risk tolerance and investment goals carefully. Diversifying your portfolio can help manage risk. Remember, informed decisions and a long-term perspective are key to navigating the complexities of the market."

SYNGENE / SWING TRADE# STOCK TRADING ABOVE TRIANGLE PATTERN IN 30 MIN CHART
# TAKING SUPPORT FROM SMA 21
#SL 705
ALWAYS TAKE RISK REWARD IN TO ACCOUNT .IT IS THE CORE STRENGHT OF TRADING.
NO MATTER WHAT END OF THE DAY WHAT YOU EARN - WHAT YOU LOSE =RETURNS
"Investing in the stock market involves balancing risk and reward. Higher potential returns typically come with higher risk, while safer investments may offer lower returns. It's essential to assess your risk tolerance and investment goals carefully. Diversifying your portfolio can help manage risk. Remember, informed decisions and a long-term perspective are key to navigating the complexities of the market."

GOLD WEEKLY CHART MID/LONG TERM/RANGE ROUTE MAP Hey Everyone,
Please see update on our mid to longer term weekly chart idea.
Last week we advised that the channel half line is a crucial level of support on this chart and as long as ema5 remains above the channel half line, we should be able to continue to buy dips. A break and lock below the channel half line will open the range test for the channel bottom.
- This played out perfectly allowing us to use our smaller timeframe to buy dips and now seeing price head towards the channel top with a long range/term target at 2434 above the channel and 2505 long range axis target. We will also keep in mind the potential for temporary short term resistance at the channel top.
The levels within the channel will provide the bounces inline with our plans to buy dips in true level to level fashion using our smaller time-frames. Buying dips allows us to safely manage any swings instead of chasing the bull from the top.
Thank you all for your likes, comments and follows, we really appreciate it!
Mr Gold
GoldViewFX

PO3 possibilities on BTCUSDTGeneral Overview
Time Frame: The chart displays price movements in a 1-hour (1h) timeframe.
Current Price: The current price of Bitcoin is around 57,619.99 USDT.
Previous Movements: There are two main downward trends followed by recovery movements evident on the chart.
Technical Analysis Elements
Descending Channels (Yellow Channels): The yellow descending channels indicate Bitcoin's downward trend.First Descending Channel: Represents a longer and broader downtrend.
Second Descending Channel: A shorter-term downtrend, followed by an upward movement in price.
Support and Resistance Levels (Horizontal Lines): Support Levels: Identified around 56,858.28 USDT and 53,400 USDT.
Resistance Levels: Identified around 58,379.08 USDT and 61,997.53 USDT.
Box Patterns: These indicate areas where the price has consolidated before breaking out. Each box shows that after a period of sideways movement, the price has broken either upwards or downwards.
Trend Lines and Moving Averages (Blue Lines): These lines determine the average movement of the price and the general trend direction. The blue line indicates that the price is recovering following a decline.
Potential Scenarios
Upward Scenario: If the price breaks the 58,379.08 USDT resistance level, the next target could be 61,997.53 USDT.
A movement toward 66,000 and 67,534.95 USDT levels may be observed if it holds above this level.
Downward Scenario: If the price drops below the 56,858.28 USDT support level, the next support could be at 53,400 USDT.
If this level is broken, a further decline to lower levels might occur.
Conclusion
This chart is used to analyze the short-term price movements of Bitcoin. Technical analysis attempts to predict future movements based on past price actions. Investors can use such charts to support their trading decisions. However, it's important to remember that cryptocurrency markets are highly volatile, and such analyses may not always yield accurate results.

UNIUSDT.. only area, hold or not ??#UNIUSDT.. well guys market bounced back and now at his one n only area 8.25 you can say resistance.
Keep close it it's our pattern level with a trend line.
If market hold it then drop expected from here.
Don't be lazy here ... Only selling invalidate above 8.25 closings.
Good luck
Trade wisely

BTCUSDT - only one support, holding or not?#BTCUSDT.. well guys market again at his most awaited and most important support of monthly and weekly chart.
That is around 58000
Keep close it.
In first go market perfectly hold it and now in 2nd go market again at 58000
That is only support of Bitcoin that can change the scnerio.
If market hold it then all ok but if market clear that level the. It will be very expensive.
Good luck
Trade wisely

AUROPHARMA/SWING TRADE # STRONG CANDLE CLOSE
#TRADING WITHIN A PATTERN
# SL 1200
ALWAYS TAKE RISK REWARDS INTO ACCOUNT. IT IS THE CORE STRENGTH OF TRADING.
NO MATTER WHAT END OF THE DAY WHAT YOU EARN - WHAT YOU LOSE =RETURNS
"Investing in the stock market involves balancing risk and reward. Higher potential returns typically come with higher risk, while safer investments may offer lower returns. It's essential to assess your risk tolerance and investment goals carefully. Diversifying your portfolio can help manage risk. Remember, informed decisions and a long-term perspective are key to navigating the complexities of the market."

World gold prices soared as the USD cooledWorld gold prices soared as the USD cooled after US Federal Reserve Chairman Jerome Powell made less hawkish statements on monetary policy.
Fed Chairman Jerome Powell expressed satisfaction with the pace of cooling in US inflation over the past year. This is a less hawkish signal about monetary policy.
The DXY index - measuring the greenback's fluctuations against six major currencies - fell from 106 points to 105.4 points on the US market. Gold prices immediately increased.
Investors are betting on the possibility that the Fed will have to consider the possibility that cutting interest rates too late could affect the recovery and growth of the US economy.

EURUSD analysis week 29 GBPUSD analysis week 29Even as the PCE inflation report hurts the USD, EUR/USD may still struggle to mount a decisive recovery, as investors hold back while waiting for the Euro's expanding strength before the first round of elections in France.
EUR/USD turned sideways last week, capping a dismal trading week after there was little reason to push the pair to trade in a downtrend that was the main trend of the pair. Present. German import prices and labor figures generally missed targets, and US Personal Consumption Expenditures (PCE) price index inflation failed to gain significant momentum despite meeting forecasts. .
Next week, European inflation figures will hit the market at the start of the week with German Harmonized Consumer Price Index (HICP) figures on Monday, followed by EU-wide HICP inflation on Tuesday. Next week also marks the next release of US Nonfarm Payrolls (NFP) labor data, expected next Friday.
Fiber came face-to-face into technical hurdles on Friday, sinking at the 200-hour Exponential Moving Average (EMA) at 1.0715. The pair continues to battle the 1.0700 handle and so far, the bidders have been unable to pattern lower highs in the short term.
The EURUSD pair is still struggling with resistance at 1.075 and support at 1.067 As buyers continue to show signs of exhaustion, a break of the 2024 low at 1.0600 becomes increasingly likely. go out.
In case EUR/USD falls below the sideways band, 1.0610 could be set as the next downside target. On the positive side, 1.0750 last week's broad band resistance would serve as interim resistance before 1 ,0800.
Support: 1,067-1,061
Resistance: 1,075 - 1,080
BUY EURUSD zone 1.061-1.059 SL 1.057
SELL EURUSD zone 1.079 - 1.081 SL 1.083

US500 - at today support? placed??#US500 - well guys market just trade near his today supporting area, keep close it because market have 5440 around as today final supporting area if market hold it then bounce expected from here,
buying invalidate below 5440
good luck
trade wisely

PEPEUSDT - at his resistance? Holding or not??#PEPEUSDT.. that coin was boomed in last couple of months.
And now is going to hold his resistance and ready for a drop..
We have upside resistance around 0.00001280
Keep close it and if market hold it then drop expected from here.
Good luck
Trade wisely

GOLD - where is support now? holding or not??#GOLD.. what a perfect move as per our video analysis and congratulations to all.
now on chart we have 2341 around as a immediate supporting area now. guys keep close 2341 now.
if market continue trade above 2341 then again a bounce expected to further day high,keep close you supporting area and dont short until market hold 2341
stay sharp..
good luck
trade wisely

GOLD - one n only support, holding or not??#GOLD... a perfect move is going on according to our video analysis and as you can see market perfectly hold 2 times 2331 32 and dropped.
and our last day supporting area 2321 is still valid guys don't take it easy,
a triangle is also on table. keep close the tringle.
TECHNICAL:
2321 is one of the most important on chart in hour and 4 hours chart. in yesterday market perfectly hold it and now again hat is your area, short only below that area with mentioned tp's
good luck
trade wisely

GOLD - there is only single support, hold or not??#GOLD... a perfect move is going on according to our video analysis and as you can see market perfectly hold 2 times 2331 32 and dropped.
and our last day supporting area 2321 is still valid guys don't take it easy,
TECHNICAL:
2321 is one of the most important on chart in hour and 4 hours chart. in yesterday market perfectly hold it and now again hat is your area, short only below that area with mentioned tp's
good luck
trade wisely

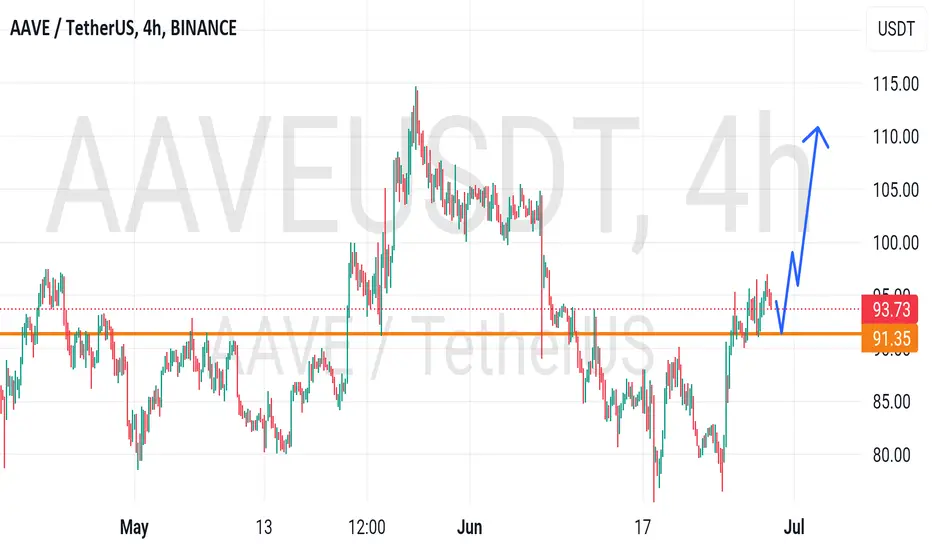
AAVEUSDT - there only single area, hold or not??#AAVEUSDT.. well guys according to technicals market have one n single area on table that is 91.30
Keep close it guys.
That will play key role in further move to anyside.
And if market hold it then. You can see a bounce from here ..
Good luck
Trade wisely
GOLD - one n single support, hold or not??#GOLD... Month closed with doji candle.
And on hour chary we have only 2321 as immediate supporting area. And it will play key role in next move.
Keep close it and don't hold your buying positions below 2321.
Only stay in buying above 2321.
Good luck
Trade wisely

US500 - breakout resistance? What's next??#US500.. overall bullish trend and you can see every time market made an area then consolidate below that after that breakout and new high,
If market continue his pattern then now we have 5486 as resistance area.
If that is breakout then above that level a further bull run expected.
Keep close 5486 around ..
Good luck
Trade wisely

GOLD - at resistance ? What's next??#GOLD.. what a perfect move as per our video analysis.
And now market at his current resistance area that is 2327 28 around
If market hold it then again you can drop from here.
Downside areas are mentioned. Buying invalidate above 2329
Good luck
Trade wisely

GOLD - only one area, what's next??#GOLD -well guys a perfect move done by gold as per our video analysis, and now market at his monthly, weekly and daily region.
keep close that region hat from 2291 to 2293 around.
that region can change the overall scenarios of gold.
if market hold it in that case you can see again bounce from here, and keep in mind below 2291 cut n reverse on table.
good luck
trade wisely

TRBUSDT - near his resistance, what's next??#TRBUSDT.. well market very smooth hold his downside area that was discussed in my previous idea about TRBUSDT.
And now upside we have 105.80 around
Keep close it because if market break it then it can go further upside.
Good luck
Trade wisely
