SILVER - its breakout? whats next??#SILVER.. perfect move as per our video analysis and now market just break his major support that is 29.02 around.
that is most important support actually, if this is clear breakage then be ready for a smooth drop towards your furhter supporting areas.
dont be lazy here and keep close 29.02
good luck
trade wisely
Tradingpatterns

GOLD - at today support ? Hold it not ??#GOLD... perfect move as per our video analysis..
Now market have 2321 as today one of tha important area on hour chart.
Only stay in buying above that area.
Keep close it if market clear that area the. Downside further drop on table..
Good luck
Trade wisely

BTCUSDT - at his most awaited area, will hold it or not??#BTCUSDT... first of all congratulations to all,
the rest moved exactly as i was expecting and this market area 58000, if tell you about it , it can be the swing area of the market.
if market hold that area then well and good but if the market break it then there is a long sell below.
so guys watch this area carefully and never hold your buying's below this area.
good luck
trade wisely

BTCUSDT - one n only area, what's next??#BTCUSDT. what a move from 66400 as we discussed in our last idea and congratulations to all followers.
We already discussed about 64450 in our last couple of ideas, you can check our last ideas about btcusdt.
So guys that level have much importance on chart specially in weekly and daily chart if you can see.
So keep close that level 64450
If market clear that level then you can see a smoothly drop a d it will leads you towards 62k , 60k n up to 58k
Don't be lazy here.
Good luck
Trade wisely

TRBUSDT - at cutt n reverse area? What's next??#TRBUSDT.. well guys market perfectly hold you area in our perveious idea.
And now we have 91 as major supporting area for now.
Overall 2 areas 91.00 and 105 around
You can check history for 91 market hold it so many times.
So now again keep close that area because If market hold it then again bounce expected
BUT KEEP IN HAND YOUR CUTT N REVERSE BELOW 91
Good luck
Trade wisely

TRBUSDT - at MAKE IT or BREAK IT level. what's next?? #TRBUSDT.. in first go market very smooth hold your area 91 and now again market just near your swing area 91
keep close it because its your MAKE IT OR BREAK IT level, only only hold your buying's above that level and as i told you in my last idea about #TRBUSDT that below 91 CUT N REVERSE in hand.
good luck
trade wisely

GOLD - at fresh resistance, what's next ?? #GOLD... market moved perfectly as per our expectation,
now market have 232728 as immediate resistance area, keep close it because if market hold your region then again drop expected from here, keep close your region 2327 28 around and don't be lazy here.
good luck
trade wisely

SILVER - at today support? holding or not??#SILVER.. so guys market from morning trade choppy and now we have 29.57 58 as today most important and day support.
keep close it because if market break that area then downside it will leads you towards further supporting areas,
29.57 58 keep close it.
good luck
trade wisely

GOLD - where if today resistance? whats next??#GOLD.. well guys market bounced back from his last week and friday low and now market at near his today resistance area.
keep close guys 2329 is your area now.
below that you can expect again drop towards today low.
keep close
good luck
trade wisely

BTCUSDT - one n only support for today, holding or not??#BTCUSDT. perfect move as per our last couple of ideas and congratulations to all followers,
now market have one n only area for today that is your most important supporting area 62400
that area can create a massive volume to any side. keep close it.
if market clear that level then it will leads you towards downside further areas which is 60000 and up to 58000
don't be lazy here.
good luck
trade wisely

TRBUSDT - at cutt n reverse area? What's next??#TRBUSDT.. well guys market perfectly hold you area in our perveious idea.
And now we have 91 as major supporting area for now.
Overall 2 areas 91.00 and 105 around
You can check history for 91 market hold it so many times.
So now again keep close that area because If market hold it then again bounce expected
BUT KEEP IN HAND YOUR CUTT N REVERSE BELOW 91
Good luck
Trade wisely

GOLD- bull run exhaust ? What's next?#GOLD... Well guys market placed 2365 plus as day high in yesterday.
That is our channel neck line as we discussed in our last idea,
And that is our cut n reverse area as we discussed in our video analysis.
So keep close it if market hold it then drop expected from here.
In case market break that area then selling will invalidate and as I told you above 2365 is your cut n reverse area.
Good luck
Trade wisely

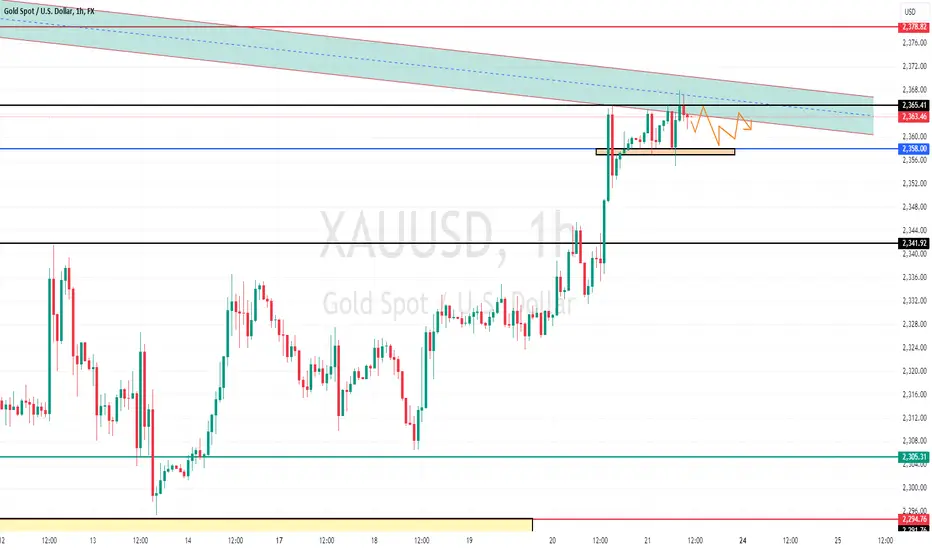
GOLD - if trade in range then expected range. #GOLD.. we guys market perfect move as per our video analysis.
and now we have 2 areas and if market will trade in range then that is your range.
upside we have 2365 66 in hourly chart and downside we have 2358 in hourly chart as well.
no doubt flash services and flash manufacturing PMI data on table but if market will trade in range then these areas is your range area..
until market closed either side.
good luck
trade wisely
GBPUSD - CPI and only one single area on table.#GBPUSD... As you know guys tomorrow is POUND CPI day and we have one n single area on chart.
That is 1.2670
Keep close that area, it's only area that can change the overall scnerios.
Don't hold your buying positions below that area.
Only buy above that otherwise not at all.
Good luck
Trade wisely

TRBUSDT - single supporting area, holding or not??#TRBUSDT.. well market near to his one of the most important supporting area that is around 77 - 78
You can see in history market very smoothly hold it couple of times.
This time if market hold it again then you can see again bounce from here.
But one thing more is very important that below that level you should cutt n reverse in hand.
Don't be lazy here
Good luck
Trade wisely

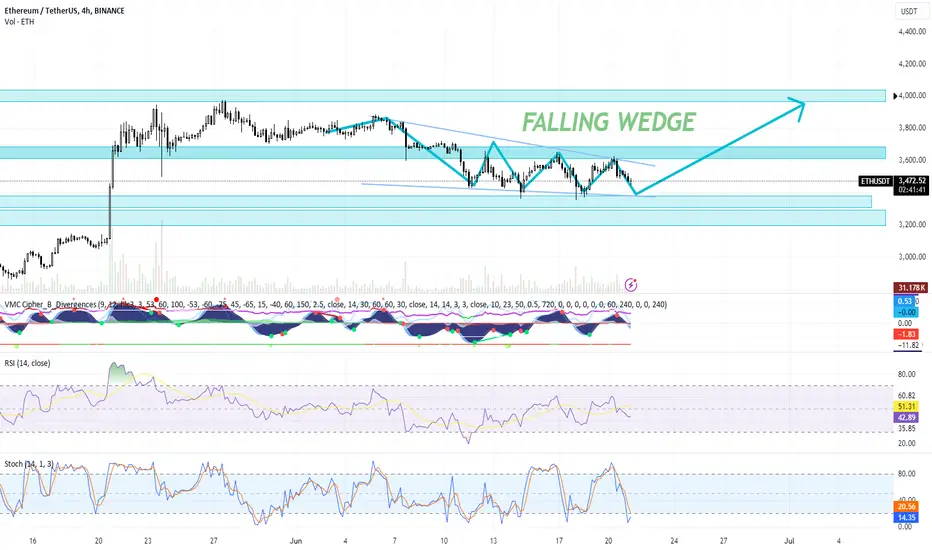
Technical Analysis of Ethereum (ETH/USDT) by Blaž FabjanTechnical Analysis of Ethereum (ETH/USDT)
Chart Overview:
The chart depicts the ETH/USDT price action on a 4-hour timeframe, showcasing a falling wedge pattern, which is generally considered a bullish reversal pattern. Here are the key observations:
Falling Wedge Pattern:
The falling wedge is marked clearly, indicating a potential upward breakout. The pattern is confirmed by the higher lows and lower highs converging towards the apex.
Support and Resistance Levels:
Resistance Zones: $3,600 - $3,800 and $4,000.
Support Zones: $3,200 - $3,400.
Volume: The volume is relatively low but picking up near support zones, which is a typical characteristic before a breakout.
Indicators:
VMC Cipher B: Showing potential divergences with green dots indicating possible bullish momentum.
RSI (14): Currently at 42.06, suggesting the market is not overbought and has room to move up.
Stochastic RSI: Showing oversold conditions, which could indicate a buying opportunity as it crosses upwards.
Trading Plan
Intraday Trading
Strategy: Use support and resistance levels for quick trades.
Entry: Buy near the support zone ($3,200 - $3,400) when confirmed by bullish indicators (e.g., green dots on VMC Cipher B).
Target: Sell near the first resistance zone ($3,600 - $3,800).
Stop Loss: Place a stop loss below $3,200 to manage risk.
Scalping
Strategy: Take advantage of small price movements within the support and resistance zones.
Entry: Buy on minor pullbacks within the wedge near $3,300 - $3,400.
Target: Aim for small profits at $3,450 - $3,500.
Stop Loss: Place tight stop losses around $3,280 to minimize losses on quick trades.
Swing Trading
Strategy: Capitalize on the potential breakout from the falling wedge.
Entry: Buy once price breaks and retests the upper trendline of the wedge around $3,500 with confirmation from volume increase.
Target: First target at $3,800, with a potential move to $4,000.
Stop Loss: Place a stop loss below the retest level, around $3,400.
Conclusion and Advice
Given the technical indicators and the falling wedge pattern, Ethereum (ETH) is showing signs of a bullish reversal. Traders should consider the following:
Long Positions: Favorable for all trading strategies (intraday, scalping, and swing trading) as the pattern and indicators suggest an upward movement. Enter positions near support levels and on confirmed breakouts.
Short Positions: Not advisable at this stage unless there's a confirmed breakdown below the support zone of $3,200, which could invalidate the bullish pattern.
Recommendation: Based on the chart, a long position is recommended with careful attention to the support and resistance levels. Monitor the indicators for any shifts in momentum and adjust the trading strategy accordingly. Always use stop losses to manage risk effectively.
GBPUSD - at his weekly Supoort? What's next??#GBPUSD.. well guys pound bank rate unchanged as expected.
And market at his weekly and daily supporting area.
Keep close your region 1.2660 to 1.2670
If market hold it then again bounce expected from here .
And keep in mind that 1.2660 is your cut n reverse area .
Good luck
Trade wisely

GOLD - today resistance ? whats next??#GOLD.. market very well hold your area and bounced as we discussed,
now market have 2358 as today 2nd resistance area, keep close it because if market hold it then drop expected from here,
above 2359 hour closing means invalidate selling.
keep close and dont be lazy here.
good luck
trade wisely

BTCUSDT - at his mysterious area, what's next?? #BTCUSDT. well market very well holding his supporting area as we told you. and now market is at his today resistance area 66400 around.
keep close it that is your mysterious area for now.
if market hold it then again drop expected from here.
good luck
trade wisely

BTCUSDT- at support? Holding or not??#BTCUSDT.. market at his major support of the week that is 64450
This area have much importance on current chart and in history as well.
And now again it is our most important area for now.
If there is any kind of buying turn is exist in BTC then that is your support.
But if market clear that level then gradually you can see a drop up to 5800 around plus minus.
So keep close it as a major supporting area.
Good luck
Trade wisely

SILVER - back for again top? Or not??#SILVER .. in yesterday our area was 29.60 to 29.65
And you can see market hold it for 3 or 4 times.
And then market broke that level and placed around 29.80 as day high
As you know that yesterday was bank holiday in USA means no major data or no major move.
Now we have 29.90 as a important major resistance for silver.
29.90 will play key role in today with important data's in table.
So keep close 29.90 it will your area for tomorrow.
If market hold it then a drop expected from here.
And if not then not at all.
Only area 29.90
Good luck
Trade wisely

GOLD - at today support? Holding or not ?#GOLD.. perfect move as per our video analysis and now market place a day low near today supporting area.
That is 2305 around.
Keep close it if market hold it then again bounce expected from here.
But keep in mind below 2305 cutt n reverse keep in hand.
Good luck
Trade wisely

SILVER - there is one n only area, again holding??#SILVER - perfect move as per our videoanalysis and first of all congratulationsand now price again at your one of themost important support for today.
That is 29.02 03
Keep close it we told you again n againabout that supporting area if marketclear that level then a smooth dropexpected below that.
Otherwise not at all.
Don't float your buyings below that area.
Good luck
Trade wisely
