SILVER - where is next target? pattern change?#SILVER.. market perfect move as per our video analysis, and now market still in hi pervious pattern and continue.
but there is some change in current pattern, if market hold your mentioned area then you can say it will again follow your previous pattern and continue buying again. but if market break your area then market will control by sellers,
keep close your region and only only short below that region.
good luck
trade wisely
Tradingpatterns

GOLD - at today resistance? whats next??#GOLD.. perfect move as per our video analysis and congratulations to all.
now market at his today one of the most important resistance 2330 around,
keep close that area because if market hold it then you can see again a drop from here,
dont be lazy here,
good luck
trade wisely

SILVER - where is today support? repeat or not??#SILVER.. perfectly holding his pattern so far as we discussed in our video analysis, watch kneely that pattern ,
its market 3rd time, it will again follow at 3rd time or not,
what ever market done but you should have to keep close your channel area and upside our last day resistance,
if market follow his pattern in that cast you can see again bounce from here, other wise not at all.
good luck
trade wisely

GOLD - Pin bar bullishA bullish pin bar has formed on the gold chart, suggesting a potential rise in gold prices. If the price breaks above the 2325 resistance level, this would confirm the bullish trend. It is advisable to set a stop-loss in the 2310-2305 range to manage risk in case of a breakout.

GOLD - near today resistence? whats next??#GOLD. a perfect holding of your area as we discussed in our video analysis,
now keep close that level again guys, 2317 n 2320
if market hold that area then again drop expected from here.
only selling invalidate above 2320 otherwise not.
good luck
trade wisely

#SILVER.. where is next target??#SILVER.. as you can see market holdthat channel 2 times and now that is 3rd
time.
Keep close the channel that is
mentioned on chart.
If market hold it in that case you canexpect drop from here.
Good luck
Trade wisely

Foreign exchange trading skills worth collecting (Part 2)
Continuing from the previous article;
25. Observe the magnitude of market changes: When the market falls (rises) with the same small amount every day, it may be a signal of a rebound (fall).
26. The dense area is likely to form a support belt or pressure belt: The dense area can be regarded as an obstacle to slow down the market price fluctuations. Once the trading range is broken, the price will make progress. Generally speaking, the longer the trading range lasts, the greater the price movement after the breakout.
27. Significant price rises and falls are often accompanied by key reversals: When the price hits a new high on high trading volume, then falls and closes lower than the previous day, it is usually a reversal phenomenon in the uptrend. The reversal in the downtrend is that the price first goes down, then rebounds strongly on the same day, and finally closes at a higher closing price than the previous day.
28. Pay attention to the head and shoulders pattern: When a head and shoulders pattern is formed on the price chart, it is usually a signal of a big rise. The appearance of the head and shoulders will not be clear until the second shoulder rebounds or pulls back to the level.
29. Pay attention to the highest point of "M" and the lowest point of "W": When the market trend forms a large M on the price chart, it suggests that you can sell. When it forms a W, it suggests that the price will rise.
30. Buy and sell at three highs and three lows: When the market climbs to a peak for the second or third time, it is a bearish signal; otherwise, it is a bullish signal.
31. Observe changes in trading volume: When trading volume rises with price, it is a buy signal. When trading volume increases and prices fall, it is a sell signal, but when trading volume decreases, no matter how the price moves, it is a wait-and-see or expecting a reversal signal.
32. The amount of open contracts can also provide intelligence: If open contracts increase when prices rise, it is a buy signal, especially when trading volume increases at the same time. Conversely, if open contracts increase when prices fall and trading volume is large, it provides sell information.
33. Pay attention to the fact that things will turn around when they reach their extremes, and good times will come after bad times: when a rising trend is very strong, pay attention to the implicit downward trend and pay attention to negative factors at any time; when a falling trend is very weak, pay attention to the implicit recovery information, pay more attention to positive news, and beware of market reversals.
34. Carefully judge the news effect: first, judge the authenticity of the news; second, understand the timeliness of the news; third, analyze the importance of the news; and finally, study the indicative nature of the news.
35. Retire before the delivery period: Commodity prices will have relatively large fluctuations in the delivery month. Commodity trading novices should move to other commodities before this to avoid this additional risk. The potential profits during the delivery period should be sought by experienced spot market traders.
36. Buy and sell when the market breaks through the opening price: This is a good hint of price trends, especially after a major news report. A breakthrough in the opening price may indicate the trend of trading that day or in the next few days. If the market breaks through the upper limit of the opening price, buy; if the breakthrough point is at the lower limit of the opening price, sell.
37. Buy and sell at the previous day's closing price breakthrough point: Many successful traders use this rule to decide when to establish new contracts or increase contracts. It means buying only when the transaction price is higher than the previous day's closing price; or selling when the transaction price is lower than the previous day's closing price.
38. Buy and sell at the previous week's high and low price breakthrough points: This rule is similar to the daily rule mentioned above, but his high and low prices are predicted based on the high point of the week. When the market breaks through the highest point of the week, it is a buy signal; when the market breaks through the lowest point of the week, it is a sell signal.
39. Buy and sell at the previous month's high and low price breakthrough points: The longer you observe, the more market momentum your decision will be based on. Therefore, the price breakthrough point of each month is a stronger hint of price trend, which is more important for futures commodity traders or hedge traders to make or break.
40. Establish pyramid trading: When you add contracts, do not add more contracts than the first one. This is a dangerous trading technique because as long as the market reverses slightly, all your profits will be wiped out. In the inverted pyramid trading, the average cost is close to the market price, which will hurt you.
41. Be careful with stop loss orders: The use of stop loss orders is a simple self-discipline; it can help you stop losses automatically. An important factor is: when you place an order, you must also set a stop loss point at the same time. If you don’t do this, you will lose more money and increase your losses in vain.
42. The retracement in a bull market is not the same as the bear market: conversely, the rebound in the bear market is not a bull market. Most investors like to short in a bull market and believe that it will definitely retrace, and vice versa. Change the rhythm and learn to buy in the retracement in the bull market and short in the rebound of the bear market. You will get more profits.
43. Buy and sell when the price is out of the track: Some successful traders use this rule most often. They buy and sell when prices are out of the norm or beyond general expectations. If ordinary buyers and sellers believe that market prices are rising, but in fact they are not, it is usually a good sell signal, especially after important information is released. Successful traders will wait for the general public to lean to one side, and then choose the time to buy and sell in the opposite direction.
44. The market will always fluctuate in a narrow range after violent fluctuations: when the market stabilizes after a sharp rise or a heavy fall, you must observe when the actual buying or selling begins to increase steadily, so that you can understand whether the market is ready to start, and take the opportunity to get on the train and wait to earn a wave of market.
45. When the bulls are rampant, the rise will slow down: if the market is filled with strong bullish arrogance, the price will not rise easily. Why is this so? When everyone is bullish and enters the market to do more, who can buy again and push the market up? Therefore, the price can only continue to rise after the people who originally did more can't stand the price softening and exit the market.
46. Buy and sell at the breakout points of rising and falling wedges: Any trend has its own process of brewing, generation, and development. When recorded on a chart, it will take on a certain shape. Once a certain pattern is formed, it usually has a considerable enlightenment effect on the future market development. Although it is not absolute, it has a high probability and has its reference value.
47. Don't buy and sell multiple commodities at the same time: If you try to pay attention to the pulse of many markets, that is, if you want to grasp the news of several markets at the same time, you will hurt yourself. Few people can succeed in both the stock index and the grain market at the same time because they are affected by irrelevant factors.
48. Don't add to the losing commodities: No matter how confident you are, don't add contracts to the commodities that have already lost money. If you do that, it shows that you can no longer keep up with the market, but some traders disagree with this rule and prefer to believe in a price averaging technology.
49. In a bear market, put aside the statistical reports: In a bear market, you must be able to ignore all the statistical figures and focus on the market trend. You must understand that the figures to be published reflect the past, not the future. The figures to be published in the future are the results of the present and the near future.
50. The market can only give you so much, so don't hold unrealistic expectations: Some operators always hope to make every penny in the market; trying to squeeze the last drop of profit in the market, the time and energy spent are not worth it; a fish is divided into three parts: the head, the body, and the tail, and the largest part is the body; the operator only needs to find a way to eat the fish meat, and leave the head and tail for others to eat.
I hope it helps you. The rest will be updated in new articles. If you need it, you can check it on the homepage after following it.

XAUUSD (GOLD) | 4H | TECHNICAL CHART | 0.618 LONG |Hello traders, I have determined the formation target on the chart. I wish everyone success.
Like and comment if you find value in our analysis.
Feel free to post your ideas and questions at the comments section.
Thank you for considering my analysis and perspective.
Good luck

long ETH ETH bounced off the support level and broke the descending trendline to the upside. Bullish movement to $3200 is expected to happen.

27 Articles That Helps You to Avoid MONEYGONE PatternAre you tired of feeling like your money disappears into thin air? Say goodbye to the ' MONEYGONE ' pattern with our collection of 27 articles packed with tips and tricks to keep your finances on track.
In #VestindaTips we've put together this big guide all about how prices move and patterns in trading.
Whether you're new to trading or you've been doing it for a while, we want to give you helpful info to understand the ups and downs of the financial world. So, let's learn together and get ready to navigate those tricky markets!
Dynamics of Bull Market Cycles:
Understanding the ebbs and flows of bull markets is essential for capitalizing on upward trends. Dive into the intricacies of bull market cycles to identify opportunities and optimize your trading strategies.
Dynamics of Bear Market Cycles:
Conversely, bear markets present unique challenges and opportunities.
Explore the dynamics of bear market cycles to mitigate risks and maximize profits during downward trends.
Diamond Pattern: How-To Guide:
Uncover the secrets of the diamond pattern and learn how to recognize and interpret this rare yet powerful formation in trading.
Drawing Trendlines: A Practical Guide:
Master the art of drawing trendlines with precision and accuracy. This practical guide offers valuable tips and techniques to identify trends and make informed trading decisions.
Think You Know Candlestick Patterns?
Delve deeper into the realm of candlestick patterns and refine your understanding of these fundamental tools for technical analysis.
What is a Bearish Pennant Pattern?
Decode the mysteries of the bearish pennant pattern and discover how to spot this bearish continuation formation in the market.
Market Gaps: Strategies, Types, Fills, and Crypto:
Explore the phenomenon of market gaps and uncover effective strategies for navigating these price discontinuities across various asset classes, including cryptocurrencies.
Three White Soldiers:
Learn to recognize and interpret the significance of the three white soldiers pattern, a bullish reversal formation that signals a potential shift in market sentiment.
Bullish Pennant Pattern:
Gain insights into the bullish pennant pattern and harness its predictive power to identify lucrative trading opportunities in the market.
How to Island Reversal Pattern:
Navigate the waters of the island reversal pattern and understand its implications for trend reversal and market sentiment.
The Triangles: With Real-Life Examples:
Explore the various types of triangle patterns, including symmetrical, ascending, and descending triangles, with real-life examples illustrating their significance in technical analysis.
Cracking the Short Squeeze:
Demystify the phenomenon of short squeezes and learn how to capitalize on these explosive market dynamics for potentially substantial gains.
Hammer of Trend Change:
Discover the hammer candlestick pattern and its role as a potent signal for trend reversal, providing traders with valuable insights into market dynamics.
Basics of Elliott Wave Theory:
Unlock the foundational principles of Elliott Wave Theory and leverage this powerful tool for predicting market cycles and trends.
The Core Confirmations Every Trader Must Know:
Equip yourself with essential trading confirmations to validate your analysis and make well-informed trading decisions with confidence.
What are Tweezer Top and Bottom Patterns?
Unravel the mysteries of tweezer top and bottom patterns and learn how to interpret these candlestick formations for identifying potential trend reversals.
How to Altseason Cycle || Cheat Sheet || Bitcoin Dominance:
Navigate the altseason cycle with ease using this comprehensive cheat sheet, complete with insights into Bitcoin dominance and its implications for the broader cryptocurrency market.
Rising and Falling Wedges Explained:
Understand the characteristics of rising and falling wedges and learn how to effectively trade these patterns for profit.
How to Head and Shoulders:
Master the head and shoulders pattern, a classic reversal formation that can provide valuable insights into market trends and potential trend reversals.
Double Top vs. Double Bottom Patterns:
Distinguish between double top and double bottom patterns and learn how to identify and trade these reversal formations effectively.
Triple Top vs. Triple Bottom Patterns:
Explore the nuances of triple top and triple bottom patterns and their implications for market trends and price action.
DIVERGENCE CHEATSHEET:
Decode divergence patterns with this comprehensive cheat sheet, providing invaluable insights into market dynamics and potential trend reversals.
Supply and Demand Zones: Buying Low, Selling High:
Master the art of identifying supply and demand zones to capitalize on optimal entry and exit points in the market.
Ascending Channels: The Guide:
Navigate ascending channels with confidence using this comprehensive guide, complete with strategies for trading within these bullish formations.
Wyckoff Accumulation & Distribution:
Unlock the secrets of Wyckoff accumulation and distribution phases and learn how to spot these market manipulation tactics for profitable trading opportunities.
The Cup and Handle Pattern in Trading:
Discover the cup and handle pattern, a classic bullish continuation formation that can signal significant uptrends in the market.
The ABCD Pattern: from A to D:
Explore the ABCD pattern and its role in identifying potential entry and exit points in the market, providing traders with a structured approach to trading.
With all the cool stuff you've learned from our guide on price action and patterns, you'll be ready to tackle the twists and turns of the financial world like a pro! It doesn't matter if you're just starting out or you've been at it for a while, getting the hang of these basic ideas is super important for making good trades and winning big. So, go ahead and dive in! Happy trading, everyone!

GBPJPY: Japanese Yen increased, USD JPY exchange rate hit a 3-weThe Japanese yen steadied on Friday, with USDJPY hitting a three-week low after a sharp drop this week that traders largely attributed to government intervention.

GBPAUD: UK February ILO unemployment charge better than expected
UK February ILO unemployment charge: 4.2%
Expected: 4.0%
Previous: 3.9%
Job change: -156k vs. 58k expected
Previous: -21k
Average weekly earnings: +5.6% 3m/y vs +5.5% expected
Previous: +5.6%
Average weekly earnings (except for bonuses): +6.0% 3m/y vs +5.8% expected
Previous: +6.1%
Change in March salary: -67k
Previous: 20k; changed to: -18k
This is a particularly combined document as employment numbers are vulnerable whilst wages stay high. The revision of the February payroll indicates that the United Kingdom exertions marketplace constantly stated poor payrolls withinside the first quarter. That is an indication that the activity marketplace is loose, with the unemployment charge additionally rising.
From that perspective, it facilitates give a boost to the case in the direction of slicing hobby rates. But with the warmer payroll numbers, the BOE might also additionally sense vindicated in persevering with to strengthen marketplace expectancies for August`s move.

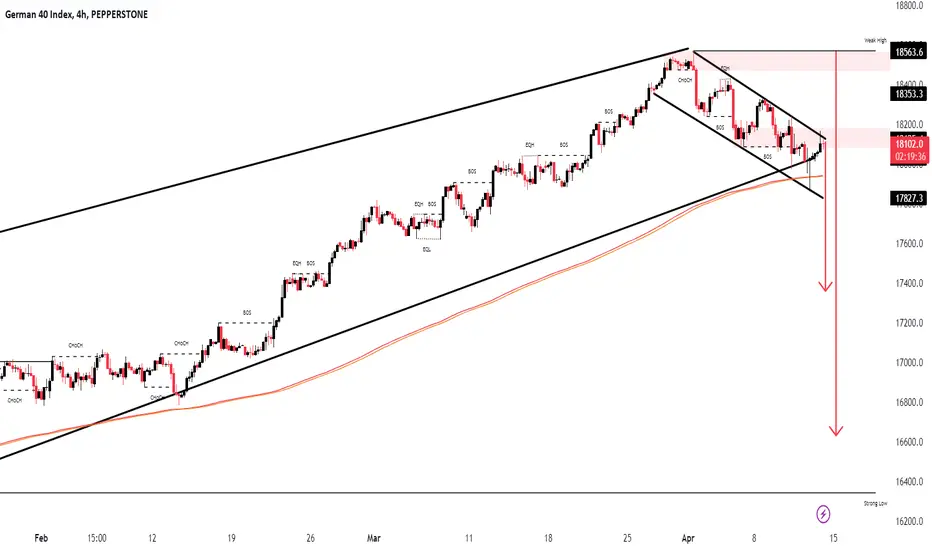
Germany 40 IndexPair : Germany 40 Index
Description :
Rising Wedge as an Corrective Pattern in Long Time Frame and Breakout of Lower Trend Line
Break of Structure
RSI - Divergence
Lower Lows - Lower Highs
Bullish Channel in Short Time Frame
XAUUSD Gold Next ImpulsePair : XAUUSD ( Gold / U.S Dollar )
Description :
Completed Impulsive Waves " 12345 " and " ABC " Corrective Waves
RSI - Divergence
Break of Structure
Rising Wedge as an Corrective Pattern in Short Time Frame
S / R Level

EURJPY: the euro weakensIn Europe, EUR/USD fell 0.3% to 1.0789, near a five-week low, after data released earlier on Thursday showed German Retail Sales unexpectedly fell 1.9 % over February, illustrating the difficulties Europe's largest economy is suffering in the first quarter.
European Central Bank officials have become very dovish of late, with board member Piero Cipollone the latest to hint at an interest rate cut as soon as June.
“Wage growth appears to be on a gradual adjustment path over the medium term towards a level consistent with our inflation and productivity growth targets, in line with our inflation and productivity growth targets,” Cipollone told an event in Brussels on Wednesday. consistent with predictions".

Germany 30 Trend Reversed ?Pair : Germany 30
Description :
Bullish Channel as an Corrective Pattern in Short Time Frame and Rejection from Upper Trend Line
Higher Highs - Higher Lows
Break of Structure
RSI - Divergence

AAPL: Time for PutsFirstly I'm a huge NASDAQ:AAPL fan when it comes to their products, however, I believe the time has come to buy some Put Options.
Trend Analysis
Utilizing the 1D chart, I found a double-top "M" pattern and at the time of this idea we are currently sitting a little under the second peak. The descent can be steep according to a macro-Fibonacci tool where the $125 share price rests around a 50% retracement level. Support at this level has been strong since May 2021.
I used two micro-Fibonacci tools to identify areas of minor support during the descent. I believe the use of both is necessary as some traders will be using the uptrend retracement (green) and others will use the downtrend retracement (red). I believe that there is a good possibility for reversal at the 61.8% downtrend Fib retracement as this level has been a key area of support and resistance since August 2021; see image below. It goes without saying that by the time the share price reaches this level, the double top pattern will already be considered valid so it's my opinion that a catalyst in the form of bad news will be required to see further declines.
Fundamental Analysis
According to the Q3 Earnings Call (Annual Report), Apple has only utilized 17.67% of its $90 billion dollar share repurchase program authorized in May '23. According to a later footnote, Apple repurchased $76.6 billion of its shares during 2023 which leads me to believe there is either a mistake in the report or that most of the $76.6 billion satisfies an earlier repurchase program. On the 10K form, see bottom of page 18 - note 1 and bottom of page 20.
Cash on-hand has increased by 27% since September 2022.
Current ratio (current assets/current liabilities) is 0.99 which is concerning from a financial standpoint. However, this is an improvement from September 2022 when its current ratio was 0.88.
Retained earnings, while still in a deficit, has improved by 93% since September 2022. These deficits were self-inflicted as Apple spent most of its net income on stock repurchases the last three years.
Sentiments
I didn't find anything that changed my opinion on the current market trend for Apple. While the company does appear to be improving it is still in a rough spot. The aggressive repurchasing of its own stock and placing itself into a deficit doesn't make sense to me as a long-term plan. I understand that companies will do this to raise their EPS and benefit their shareholders but it also says that the company doesn't plan on expanding in the foreseeable future.

GOOGL to Low $100s?Overview
Google ( NASDAQ:GOOGL ) is in the dangerous territory of a double top formation. I've discovered this same macro-pattern with a few other assets as well. In combination with a rise in long-term Treasury Yield Curve rates since December 2023, I think a rush of selling pressure could be around the corner.
Technical Analysis
Utilizing Fibonacci retracement levels along with historical supports & resistances, the $126-136 range appears to be a key level in the share price. The double top formation is a bearish reversal pattern that resembles the letter "M" and, when valid, the second peak is greeted with significant selling pressure. According to technical indicators GOOGL is beginning to reveal the symptoms of a bearish reversal.
The share price has risen on dwindling volume, Money Flow Index (MFI) is approaching overbought territory, and the On-Balance Volume (OBV) is still under a ceiling created in March 2022. A rising wedge is also visible on the hourly charts with a micro Head & Shoulders in development. Should a high volume breakdown occur then I believe a price target range between $109-126 is probable, however, I am expecting adequate support around $126 as it correlates with both a 61.8% Fibonacci level and has history as a key area of support & resistance.
Speculations
Earnings season is a great time to profit from derivative trading, however, it can also be more treacherous due to the volatility most stocks experience in the days leading up to and immediately following their Quarterly Releases. Because GOOGL is having their Earnings Call in the next few days, I would not be surprised to see sharp price movements in either direction regardless of the current trends. Concrete stop-losses and price targets should be determined before entering any positions.

Gold pair price test New resistance levels 2230 drop 💧 2140 ⤵⤵Hello traders what you think Gold pair NES resistance levels 2230 📉📊📈⤵
Gold pair technical analysis
Gold pair take new resistance levels of 2230 pullback Berish support levels 2140
Follow risk management
Safe trade don't forget like this analysis

Fantom ... put this on your radar #ftm Fantom ... put this on your radar
Set Alert at 1.1673
stop loss 1.0325 target 1.5995
Market Cap 2.9B Layer 1 / DeFi
Possible Parabolic Curve
Not Financial Advice

Germany 30 19/03Pair : Germany30 Index
Description :
Bullish Channel as an Corrective Pattern in Short Time Frame and Rejection from Lower Trend Line
Completed " 123 " Impulsive Waves
Break of Structure
Fibonacci Level - 261.8%

MRCB Breakout From DT Line - Good Price to EntryThis undervalued construction and property player in Malaysia, MRCB has shown good performance recently. Pullback from the 52Wk high at 0.705, the price now stabilize around 0.56 to 0.59.
The intrinsic value for Malaysian Resources Corporation Berhad is RM9.91 based on Discounted Cash Flow Valuation, that is discounted 94.2% from current price.
Price now recently break from downtrendline (refer chart) and need to break MID BB (MA20) at daily timeframe to confirm the uptrend mood. My price target using fibo is at TP1 D: RM0.795, TP2 D: RM1.03
Hold for long term investment! cheers

germany 30Pair : Germany 30
Description :
Completed " 12 " Impulsive Waves
RSI - Divergence
Break of Structure
Double Top
Resistance Level
Bullish Channel as an Corrective Pattern in Short Time Frame
