Look First, Then LeapIn trading, how you prepare matters more than how you react. The phrase “Look first, then leap” reminds traders to avoid impulsive decisions and instead focus on proper analysis, planning, and risk control. Whether you're trading stocks, forex, crypto, or commodities, this principle can save you from painful losses and build a foundation for long-term success.
Let’s break down what it really means to “look first,” and how applying this mindset can improve your trading discipline.
✅Preparation Beats Emotion
Before entering any trade, a trader should ask: What is this trade based on? Logic or emotion?
🔹 Control Impulsive Decisions
Most losing trades happen when people act on gut feelings, FOMO, or after seeing a sudden price spike. But excitement is not a strategy; analysis is.
🔹 Check the Basics First
-What is the market trend? (uptrend, downtrend, or sideways?)
-Are you trading with or against the trend?
-Are there any upcoming news events that might impact the market?
Taking a moment to “look first” gives clarity and filters out low-probability trades.
✅ Trade Only When There’s a Setup
The best trades often come from waiting for the right moment, not forcing entries.
🔹 Identify Clear Patterns
Before jumping in, confirm your strategy setup:
-Is it a breakout or a fakeout?
-Are key support/resistance levels respected?
-Is volume supporting the move?
🔹 Use Confirmation Tools
Indicators like RSI, MACD, and moving averages can support your decision. Price action and patterns like triangle, channel, and flag also provide valuable clues.
Look first means not reacting to the first move; wait for the follow-through.
✅ Always Define Risk and Reward
Entering a trade without a defined stop-loss or target is like jumping into water without checking its depth.
🔹 Use a Risk-Reward Ratio
Before leaping into a trade, ask yourself:
-What am I risking?
-What can I gain?
Aim for a minimum risk-reward ratio of 1:2 or 1:3 to stay profitable even with a lower win rate.
🔹 Position Sizing Matters
Know how much of your capital to allocate. Using 1-2% of your capital per trade helps manage losses and avoid emotional pressure.
✅ Adjust for Market Conditions
Just because you’ve seen success in one type of market doesn’t mean your strategy will always work.
🔹 Trending vs. Ranging Markets
-Trend-following strategies work well in strong trends.
-Mean-reversion or breakout-fade strategies work better in sideways markets.
🔹 Check for Major News or Events
Earnings reports, central bank meetings, or geopolitical events can change everything in seconds. Before entering a trade, look at the calendar.
Adapting to market conditions is part of looking first.
✅ Use a Trading Plan, Not Just a Feeling
Every trade should follow a plan, not just “I think this will go up.”
🔹 What Should Your Plan Include?
Entry and exit rules
-Stop-loss and take-profit levels
-Criteria for valid setups
-Timeframes and trading hours
A plan brings structure and consistency, reducing emotional decisions.
✅ Journaling and Reviewing Trades
Looking first also means learning from the past.
🔹 Keep a Trading Journal
Log every trade entry, exit, reason, emotion, and outcome. This helps you spot mistakes and patterns in your behavior.
🔹 Review Regularly
After a drawdown or losing streak, review your last 10–20 trades. Was your strategy sound? Were you disciplined? Did you look before you leaped?
Improvement comes from reflection and correction.
✅ Be Mentally Ready Before Every Trade
Looking first also means checking your internal state.
🔹 Ask Yourself Before Trading:
-Am I calm and focused?
-Am I trying to recover a loss?
-Am I trading because I’m bored or emotional?
If your mindset is off, step away. A bad state leads to bad decisions—even with a good strategy.
✅Backtest and Practice Before Going Live
Before risking real money, test your setup thoroughly.
🔹 Why Backtesting Helps
It lets you see how your system performs on historical data. This builds confidence and filters out weak strategies.
🔹 Demo Trading Is Smart, Not Weak
Trading in a demo account before going live helps you learn execution, order management, and emotional control—without financial damage.
✅ Protect Capital First, Trade Second
Your first goal isn’t to make money, it’s to stay in the game.
🔹 Survive First, Then Thrive
Big losses can take weeks or months to recover. That’s why looking first is critical—it prevents careless trades that damage your capital.
✅Final Word: Be the Trader Who Waits
The market rewards those who are patient, disciplined, and prepared. Anyone can open a trade, but only those who look first truly understand what they’re doing.
Before your next trade, ask yourself:
“Do I have a clear reason, a defined risk, and the right mindset? Or am I just reacting?”
Because in trading, it’s not how many trades you take, it’s how many good trades you wait for.
In trading, success doesn't come from speed; it comes from clarity, preparation, and discipline. The principle “Look first, then leap” serves as a constant reminder to slow down, observe, analyze, and plan before taking action. It’s a mindset that separates the disciplined trader from the emotional speculator.
Every trade you take should be backed by logic, not impulse. Whether it’s identifying the right setup, managing your risk, or simply being patient enough to wait for confirmation, looking first gives you control in a world that thrives on chaos.
In the end, trading isn’t about making quick money—it’s about making the right decisions consistently. So before your next trade, take a breath, do your research, and ask yourself:
“Am I truly ready to leap, or do I need to look one more time?”
That one extra moment of reflection could be the difference between a lesson and a profit.
Cheers
Hexa🧘♀️
Chart Image Credit: TradingView
Tradingplans
The Power of Confluence: Building Trade Setups Using 3 Indicator🔵 INTRODUCTION
Many traders fall into the trap of relying on a single indicator to make trading decisions. While one tool might work occasionally, it often leads to inconsistent results. The key to consistency lies in confluence — the strategic combination of multiple indicators that confirm each other.
In this article, you'll learn how to build high-probability trade setups by combining three essential components: trend , momentum , and volume .
🔵 WHY CONFLUENCE MATTERS
Confluence refers to multiple signals pointing in the same direction. When different indicators agree, your trade idea becomes much stronger. It helps reduce noise, avoid false signals, and increase confidence in your entries.
Think of it like crossing a busy road: you wait for the green light, check both sides, and make sure no cars are coming. The more confirmations you have, the safer your move.
🔵 WHAT IS CONFLUENCE IN TRADING?
Confluence means agreement. In trading, it’s when different methods, indicators, or tools all point toward the same outcome.
Think of it like this:
One green light? Maybe.
Two green lights? Worth watching.
Three green lights? That’s a trade worth considering.
Imagine you're planning a road trip. You check the weather forecast (trend), Google Maps traffic (momentum), and ask a local for advice (volume). If all three say “go,” you’re more confident in your decision. Trading works the same way — using multiple tools to validate a setup reduces risk and removes guesswork.
Important: Confluence is NOT about cramming 10 indicators onto your chart. It’s about using a few that each offer different types of information — and only acting when they align.
🔵 THE 3-STEP CONFLUENCE SETUP
1️⃣ Identify the Trend (Using EMAs)
Before entering any trade, you need to know the market direction. You can use:
Moving Averages (e.g., 21 EMA and 50 EMA crossover)
Structure-based analysis (e.g., higher highs = uptrend)
Trade only in the direction of the prevailing trend.
2️⃣ Check Momentum (Using RSI, MACD, or Stochastic)
Momentum tells you whether the market supports the current trend or if it's weakening.
RSI above 50 → Bullish momentum
MACD histogram rising → Acceleration
Stochastic crossing above 20 or 80 → Momentum shifts
Avoid entering when momentum is fading or diverging from price.
3️⃣ Confirm with Volume (To Validate Participation)
Volume reveals the strength behind the move. A breakout or trend continuation is more reliable when it's backed by volume.
Look for:
Volume spikes at breakout points
Increasing volume in the direction of the trend
Volume confirmation after pullbacks or retests
No volume = no conviction. Watch how the market "votes" with actual participation.
🔵 EXAMPLE TRADE SETUP
Let’s say you spot a bullish trend with 21 EMA above 50 EMA. RSI is above 50 and rising. A pullback forms, and volume picks up as price starts to push higher again.
That’s trend + momentum + volume lining up = a confluence-based opportunity.
🔵 BONUS: HOW TO ENHANCE CONFLUENCE
Add price action patterns (flags, wedges, breakouts)
Use support/resistance zones for cleaner entries
Combine with higher timeframe confirmation
Wait for retests after breakouts instead of chasing
Confluence doesn't mean complexity — it means clarity.
🔵 CONCLUSION
The best traders don’t guess. They wait for the market to align. By combining trend, momentum, and volume, you filter out weak setups and focus only on the highest-probability trades.
Start testing confluence-based setups in your strategy. You’ll likely find more consistency, fewer fakeouts, and greater confidence in your execution.
Do you trade with confluence? What’s your favorite trio of indicators? Let’s talk in the comments.

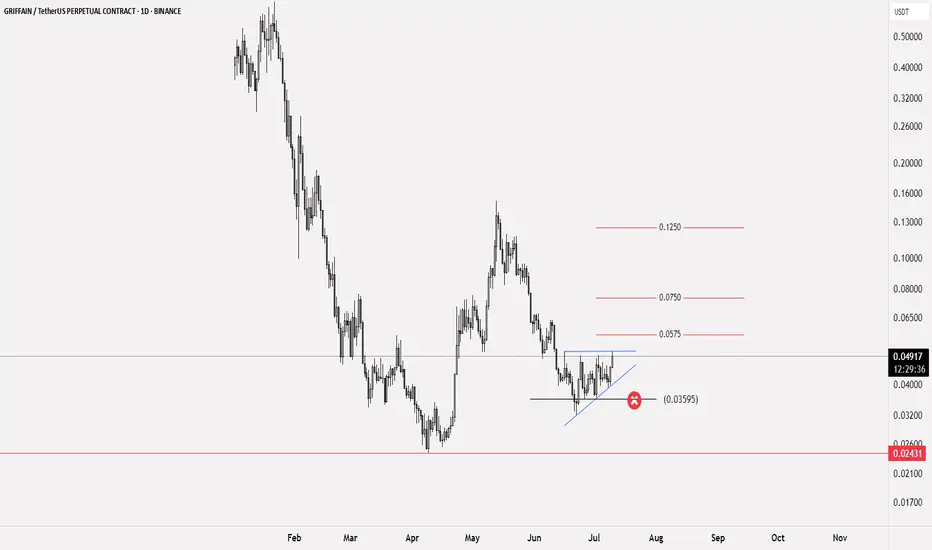
GRIFFAIN trading plan🟢 Available trading deal
📝 Currency $GRIFFAIN
✅ Entry points for the currency: at the current price of 0.04955 and the reinforcement will be at 0.04335
🔴 Stop loss is below 0.03595
💹 Potential targets: First target 0.0575 and if the currency enters a bullish wave, the target will be towards 0.0750 reaching up to 0.1250
📊 The profit-to-loss ratio is 5:1
📝 This idea is based on Elliott Waves analysis, especially after the rebound from 0.02431, the currency's low, and gaining support at 0.03595, which is a signal that Wave 2 has been formed, especially if the price action remains above the mentioned level
❤️ Good luck to everyone - do not enter any currency before studying the risk ratio you will undertake
The Market Rewards the PatientLast week was probably one of the slowest weeks I’ve ever had. I found two setups, but neither one truly materialized. They just didn’t meet all the conditions in my plan. It was tough. I won’t pretend it wasn’t tempting to drop my rules and chase other strategies just so I could be in the market.
But deep down, I knew exactly what I wanted. I want to be consistent . I want to trade like a professional . So I held back. All week, I watched and waited. No trades taken. It was boring, honestly . But that boredom protected my capital.
Instead of forcing trades, I spent the entire weekend backtesting , drilling into my strategy even more. I wanted to be sure that when my moment came, I’d recognize it without hesitation.
Then this week started. I didn’t know if it would be any different, but I trusted my process and stayed ready. Eventually, one clean setup appeared. I shared it here on TradingView. I managed my risk properly , took half my usual size at just 0.5%, and let the trade run. It almost hit my stop, but I didn’t touch it. It was simple: either TP or SL .
And this time, it hit TP. A clean 1:4.
This was a powerful lesson. Following my plan didn’t just lead to a winning trade. It protected my capital all of last week when the market wasn’t offering quality setups. That patience and discipline paid off.
That’s how you build consistency. That’s how you survive long enough to catch the trades that truly matter.

THE KOG REPORT THE KOG REPORT
In last week’s KOG Report we said we would be looking for price to attempt the high, fail and make the move downside. This worked well in the early part of the week giving traders a fantastic capture for the short trade into the red box target levels which were all complete. During the week we update trades with the plan to long, and although there was a break from the red box, our lower red box bounced price giving the long trade completing the move.
It was only towards the end of the week where we started ranging that we only managed to capture short scalps on the upside move before the suggesting we call it a day, thankfully before the small decline from the level.
So, what can we expect in the week ahead?
We have a key level here of 3310-6 which has been a previous pivot in this range and is holding price down at the moment. This now make a crucial support region forming at the 3280-5 level with extension of the move into 3275. If this level holds and the red box reacts, we can see price push up from here and attempt to target the 3400 level again, which is towards the top of the range.
It’s this lower red box that needs to be watched for the break, as a break here will target the 3250-55 region initially and then go for the potential swing low around the 3210-2- region which in this scenario maybe the ideal long trade.
As always, we’ll update traders through the week with our analysis and red box target levels but for now, let’s see if we gap on open. Please remember, the market gaps with intention, the intention is usually to get traders in chasing the gap as soon as they see immediate exhaustion, this hardly ever works on gold and BTC especially. We’ve back tested the stretch, so please play caution on chasing gaps.
More choppy and ranging price action expected!
KOG’s bias of the week:
Bullish above 3285 with targets above 3306, 3310, 3321 and 3335
Bearish below 3285 with targets below 3267, 3255 and 3240
RED BOXES:
Break above 3290 for 3297, 3306, 3310, 3320 and 3330 in extension of the move
Break below 3280 for 3277, 3270, 3267 and 3255 in extension of the move
Many of our followers and traders have seen the power of the red boxes, Imagine this on your own TV screen, 4H for swing trading, 1H for day trading and 15min for scalping. Any pair on any chart 23hrs a day. Add to that the Knights indicator giving you swing points, key levels and retracement levels and our custom volume indicator telling you when to long, when to short and when to stand back from your trades.
LEARN AND GENERATE YOUR OWN SIGNALS. You don't need any of us to guide you.
KEY LEVEL 3237!
Please do support us by hitting the like button, leaving a comment, and giving us a follow. We’ve been doing this for a long time now providing traders with in-depth free analysis on Gold, so your likes and comments are very much appreciated.
As always, trade safe.
KOG

NQ Breakdown Plan: 3 Targets, 1 Setup, No Chasing🧠 NQ Short Plan – NY Open Game Plan
Price has pulled back into a key structure zone, and I’m watching closely for a sell setup during the first two hours of the New York session tomorrow.
📌 My trade plan is simple:
I want a solid pullback first — not chasing here.
If I get a clean sell trigger (candle confirmation or momentum flush), I’m in.
Break-even gets locked in once we break the 21,349 area.
From there, I’ll take profits in three stages and trail the stop behind price if we get momentum.
🔐 Break-Even Lock: 21,349
✅ TP #1 – 21,200
✅ TP #2 – 21,050
✅ TP #3 – 20,800 (final leg if sellers step in hard)
The rising trendline break could be the domino. If it cracks, we roll.
But if bulls defend again, no trade — discipline first.
📅 Session Focus: Only trading this setup if it unfolds in the first 2 hours of NY open. After that, I’m out.
No chasing. No revenge. Just execution.
💬 Let me know if you’re watching this level too — or if you see something different. Always open to alternate perspectives.

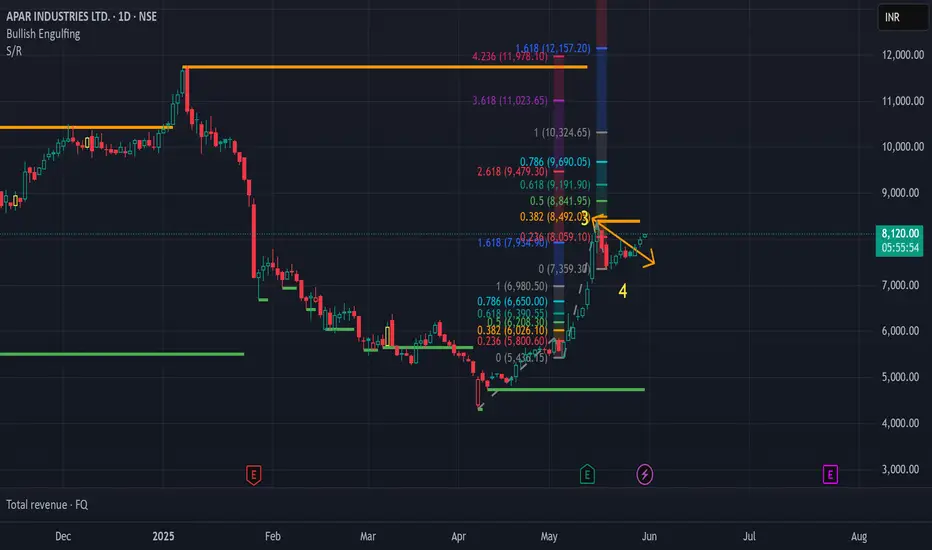
APAR Industries Trading IdeaNSE:APARINDS is on the Move and we can have an Immediate Target for 8450. On the Risk Reward Part, we can Target for 10,200, if Market conditions are good, with Trailing stoploss.
OTHERS 200MA – Next Attempt: If and When?
On the Others daily chart, there’s a formed inverse head and shoulders. The base of the formation acted as support during the last drop after rejection from the 200MA.
Now, price is attempting to push through the BB center, with SMA and MLR helping from underneath. Additionally, there’s a clear ascending trendline that continues to act as dynamic support.
Only price action will confirm the next move toward the 200MA.
Posts come from time to time—interactions help with visibility.
Manage risk—it’s the only constant

Update on gold for week A brief update that allows us to know about the next movement of gold vs usd .
we can notice the rejection from the bottom and the spring that we have , if the 3330 fvg is breaked with 4 hour candle with retest under it closing then we can confirm sell with sl above 3350 the tail and 1st tp will be nearly 3270

AAPL Trade Plan – 2025 Outlook📊With global markets reacting to renewed tariff talk from Trump, Apple (AAPL) NASDAQ:AAPL could face short-term volatility—but that’s also opportunity. As fears of a trade war ripple across Asia and Europe, AAPL may temporarily dip, especially with supply chain exposure in China.🍏📉📈
📌 Entry Zones (Buy the fear, not the panic):
1️⃣ 194 – Light entry as weakness sets in
2️⃣ 180 – Strong support historically
3️⃣ 166 – High-conviction zone if macro panic escalates
🎯 Profit Targets (Scale out as strength returns):
✅ 209 – Quick recovery zone
✅ 230 – Pre-fear valuation
✅ 260+ – Full macro recovery with bullish momentum
📈 Strategy: Let the news create emotion. You trade the levels.
⚠️ DISCLAIMER: This is not financial advice. Just sharing my personal trading plan based on current macro trends and technicals. Always do your own research and manage your risk.

Two Shots at NQ: Because One's Never EnoughAlright, here’s the game plan – because let’s be honest, the market loves nothing more than pretending to break out, then snapping back just to mess with us.
🔥 The Setup:
I’m eyeing the Micro E-mini Nasdaq-100 Futures (June 2025), and I’m giving myself two shots at this breakout. Yeah, I know – ambitious. But the market’s been playing hard to get lately, so I’m hedging my enthusiasm.
💡 Why Two Long Entries?
Because, let’s face it, the first entry will probably get stopped out. I like to think of it as a “testing the waters” trade. If it works, great – I’m a genius. If not, well, it was just practice.
First Entry (The Optimist):
I’m jumping in if it breaks out, keeping the stop tight – because nothing says confidence like a cautious stop loss.
Second Entry (The Realist):
If the first entry faceplants, I’ll wait for the market to freak out and then calm down. Then, I’ll slide back in when it looks like it’s actually serious this time.
🧠 Managing the Chaos:
Short-Term Target: The last high – because if it doesn’t clear that, what’s the point?
Long-Term Target: The equal move – assuming the market doesn’t chicken out halfway.
Stop-Loss: Snug and sensible, because I’d rather not watch my account do a disappearing act.
Take profit targets are set where the equal move would complete – assuming the market cooperates for once.
💭 The Thought Process:
I’m not here to pretend I can predict the future – if I could, I’d be on a yacht, not posting on TradingView. But this setup gives me two chances to be right, which is at least one more than usual.
🔥 Your Thoughts?
If you’re also giving your trades a second (or third) chance, drop a comment. Or just let me know how your latest breakout fake-out went – because misery loves company. 😅

VEA - Hits Target with PrecisionToday, price tapped the target perfectly.
This setup played out exactly as forecasted — clean market structure, precise entry zone, and strong momentum

Gold: Bearish Shooting Star Reversal?The trend in gold is higher and no doubt it can go higher still.. BUT
There is a possible short setup
because:
A) It's very overbought relative to its weekly average
B) A Weekly shooting star reveral pattern took place on the weekly chart
C) The daily chart shows a possible breakdown
Thoughts?

Tyree Thomas Jr Buy GBP/CAD Bias 4/8/25I looked at GBP/CAD and checked the pair with the key points of my trading strategy. My trade idea is to enter a buy when the pair breaks out of the Fibonacci Retracement tool and then take profit at the first green line of the Fibonacci Extension tool. My name is Tyree Thomas Jr, and this is my bias of GBP/CAD for a buy.

Tyree Thomas Jr USD/JPY Bias 4/7/25I believe that U/J will sell to my take profit at the green Fib extension. I will be posting my trade ideas every evening. I use the Fibonacci Retracement tool, the Fibonacci Extension tool, Six EMA's, Market Structure, and the TDIGM in my trading strategy to create my Bias.

TESLA Always Pay YOURSELF! Tsla Stock were you PAID? GOLD Lesson
⭐️I want to go into depth regarding the this topic but it is a long one with PROS & CONS for doing and not doing it.
Every trader must choose what's best for them but you will SEE when I finally get to the write up that MANY OF THE PROS are NOT FINANCIAL but PSYCHOLOGICAL❗️
Another of 🟢SeekingPips🟢 KEY RULES!
⚠️ Always Pay YOURSELF.⚠️
I know some of you chose to HOLD ONTO EVERYTHING and place your STOP at the base of the WEEKLY CANDLE we entered on or the week priors base.
If you did that and it was in your plan GREAT but... if it was NOT that is a TRADING MISTAKE and You need to UPDATE YOUR JOURNAL NOW.
You need to note EVERYTHING. What you wanted to see before your exit, explain why not taking anything was justified to you, were there EARLY exit signals that you did not act on. EVERYTHING.
🟢SeekingPips🟢 ALWAYS SAYS THE BEST TRADING BOOK YOU WILL EVER READ WILL BE YOUR COMPLETE & HONEST TRADING JOURNAL ⚠️
📉When you read it in black amd white you will have YOUR OWN RECORD of your BEST trades and TRADING TRIUMPHS and your WORST TRADES and TRADING ERRORS.📈
✅️ KEEPING an UPTO DATE JOURNAL is STEP ONE.
STUDYING IT IS JUST AS IMPORTANT👍
⭐️🌟⭐️🌟⭐️A sneak peek of the LESSON after will be HOW & WHEN TO ENTER WHEN THE OPEN BAR IS GOING THE OPPOSITE WAY OF YOUR IDEA.👌
🚥Looking at the TESLA CHART ABOVE you will see that we were interested in being a BUYER when the weekly bar was BEARISH (GREEN ARROW) and we started to consider TAKE PROFITS and EXITS when the (RED ARROW) Weekly bar was still BULLISH.🚥

Snipper plan ideeas before NFP and Powell Speech - April 4th📌 Macro & Market Context
Gold remains in a strong HTF bullish market structure, with recent highs around $3,160 acting as a key resistance.
NFP data, Unemployment Rate and Powell's speech will add increased volatility later today.
The market is currently correcting after liquidity grab above $3,160, showing signs of distribution.
📊 Market Structure Overview (4H & 1H)
Bullish/Sell bias remains neutral, but a temporary retracement is underway.
Premium supply zones are positioned above $3,140–$3,160.
Discount demand zones are around $3,080–$3,050.
📍 Setup 1 SELL
Scenario: Bearish retest to this zone
Entry: $3,135 - $3,145 (if price returns to this zone).
Confirmation: Rejection wick + Bearish Engulfing on 15M or 5M.
Stop Loss: Above $3,153
TP1: $3,125
TP2: $3,110
TP3: $3,090
📍 Setup 2 SELL
Scenario: Wait for price to push back into 3,091–3,095 zone (M5 imbalance retest).
Entry: 3091-3095
Confirmation: Entry on rejection + BOS or CHoCH M1/M5.
Stop Loss: Above 3,096
TP1: 3066
TP2: 3054
TP3: 3040
📍 Setup 2 BUY
Scenario: If price retraces to key demand zones $3,080–$3,070, look for a long entry.
Entry: Buy at $3,080–$3,075.
Confirmation: Liquidity grab + Bullish engulfing on LTF (1M, 5M).
Stop Loss: Below $3,070.
TP1: $3,100
TP2: $3,120
TP3: $3,135
📍 Setup 3 BUY
Scenario: Bounce/reversal confirmation near 3,054 (last demand block + imbalance edge).
Entry: Buy at 3048-3055
Confirmation: Entry only if M1/M5 shows CHoCH + volume.
Stop Loss: Below 3048
TP1: 3085
TP2: 3115
TP3: 3128
📌 Important Notice!!!
The above analysis is for educational purposes only and does not constitute financial advice. Always compare with your own plan and wait for confirmation before taking action.
If you find the ideas contribute to your views on the market be kind to press boost🚀/like button. Your support is appreciated.

Sniper Entry Activated: Post-Unemployment Claims Liquidity SweepGOLD JUST HIT $3,055—🥶 deep dive mode unlocked!
Alright, this is crunch time. We’re officially in the $3,050–$3,057 "DO OR DIE" buy zone.
Updated Game Plan:
🟢 Buy Setup (High-Risk Reversal Zone)
📍 Entry: $3,050 – $3,057 (we’re IN IT)
📍 Trigger: M1/M5 CHoCH + rejection wick + engulfing candle
📍 SL: Below $3,047 (tight but necessary)
📍 TP1: $3,074
📍 TP2: $3,089
📍 TP3: $3,100
🚨 If $3,047 breaks CLEANLY… expect $3,033 – $3,038 next, followed by $3,021.
📌 What’s happening?
✔️ This is a major liquidity sweep—smart money hunting stops before reversal? 🤔
✔️ If we get a strong rejection here, NY could send it back above $3,074.
✔️ If we see NO bullish reaction, it's bear town until $3,033.
📌 Important Notice!!!
The above analysis is for educational purposes only and does not constitute financial advice. Always compare with your own plan and wait for confirmation before taking action.

GOLD DAILY CHART MID/LONG TERM UPDATEGOLD Daily Chart Update: 24th FEB 2025
Hi Everyone,
Here’s the latest update on the GOLD daily chart, which we've been closely monitoring and trading. Below, we break down recent price movements, updated key levels, and provide actionable insights for the days ahead.
Recap of Recent Chart Success!
Gold recently achieved a record high of $2,954.80. Our analysis has consistently highlighted that after reaching each target level, prices tend to reverse by over 40+ pips to the GoldTurn level. This pattern was evident when, after hitting TP3 at $2,933, the price retraced more than 40+ pips to the GoldTurn level at 2870, which acted as a support, before rebounding bullishly to surpass resistance and reach the all-time high of $2,954.81.
Current Outlook: Bullish or Bearish?
Presently, gold's price is oscillating between a resistance gap at $2,990 and a support gap at $2,933. The $2,990 level serves as a key resistance, while $2,933 acts as support. Additionally, the Fair Value Gap (FVG) offers support at $2,920.
In summary, while the long-term outlook remains bullish due to factors like central bank demand and economic uncertainties, short-term fluctuations between the $2,933 support and $2,990 resistance levels are expected. Traders should monitor these key levels and indicators closely to inform their strategies.
KEY LEVEL: 2870
Resistance Levels: 2990, 3052
Support Levels (GoldTurn Levels): 2933, 2870, 2801, 2744, 2671, 2595
EMA5 Behavior:
* Or If EMA5 crosses and locks above 2933, it strengthens the bullish case.
* If EMA5 fails to hold above 2933, cross and lock below this level 2933, expect a pullback to key GOLDTURN levels below.
Recommendations:
* Capitalize on Dip Opportunities: Use smaller timeframes (1H, 4H) to trade around GOLDTURN levels, targeting 30–40 pips per trade.
* Stay focused on shorter trades in this range-bound market to manage volatility effectively.
Long-Term Bias:
Maintain a bullish outlook while viewing pullbacks as buying opportunities.
Accumulate positions near key support levels for a safer approach instead of chasing highs.
Final Note:
Trade with confidence and precision. Our analysis ensures you’re well-prepared to navigate the evolving market landscape. Stay updated with our daily insights across multiple timeframes for deeper clarity.
Thank you for your continued trust! Don’t forget to like, share, and comment to support our work.
Best regards,
The Quantum Trading Mastery Team

Gold prices remain on the riseLast week, the world gold price surpassed the historical peak of over 3,057 USD/ounce but quickly decreased due to profit-taking pressure from investors. However, the price remained above the psychological support level of 3,000 USD/ounce - a level that many experts predicted would be an important support in the coming time.
The general sentiment in the market is still leaning towards optimism. Many central banks continue to increase their gold reserves as a way to diversify away from the USD. Meanwhile, individual investors and ETFs have also begun to return to the gold market.
Data from the SPDR Gold Shares fund shows that the amount of gold held has increased by more than 37 tons this year, to 910 tons. Although this figure is still lower than in 2020, the upward momentum is returning due to concerns about inflation and escalating trade tensions.

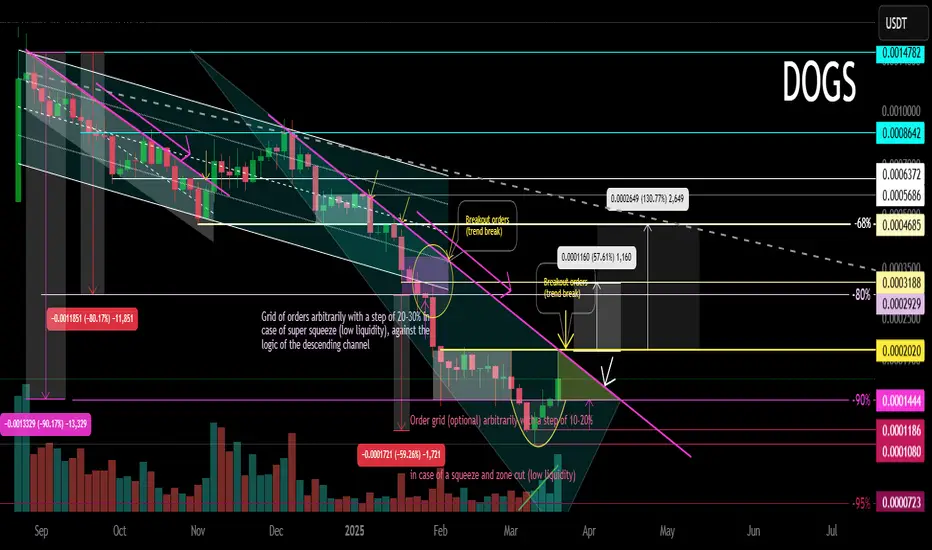
DOGS Main Trend. Tactics of Working on Risky Crypto 03 2025Logarithm. Time frame 3 days. Tactics of working on super-risky cryptocurrencies of low liquidity, which are always sold (without loading the glass), by the creators of “nothing”. In order to increase sales, of course, when they rationally reverse the trend and make pumps at a large % and marketing positive news "have time to buy". On such assets with such liquidity, “killed faith” (at the moment), and control of the emission in “one hand” it is not difficult. Something like in BabyDOGE.
On such assets you should always remember:
1️⃣ allocate a certain amount for work in general on such assets from the deposit as a whole.
2️⃣ distribute money (potential reversal and decline zones) from this allocated amount to each similar asset in advance.
3️⃣ diversify similar assets themselves (5-10 cryptocurrencies), understanding that sooner or later they will scam. The scam of one of them should not be reflected significantly on the balance of the pump/dump group of low liquidity. It is impossible to guess everything that does not depend on you, and it is not necessary. Your miscalculations (what does not depend on you) are smoothed out by your initial trading plan and risk control, that is, money management (money management).
4️⃣ Set adequate goals. Part of the position locally trade 40-80% (not necessary, but this sometimes reduces the risk).
5️⃣ Work with trigger orders and lower them if they did not work and the price falls.
6️⃣ Remember that in consolidation and cut zones in assets of such liquidity, stops are always knocked out, so the size of the stop does not really matter. It will be knocked out, especially before the reversal.
7️⃣ Before the reversal of the secondary trend, as a rule, they first do a “hamster pump” by a conditionally significant %, when everyone is "tired of waiting". They absorb all sales. Then the main pumping without passengers by a very large % takes place to form a distribution zone. As a rule, it will be lower than the pump highs, that is, in the zone when they are not afraid to buy, but believe that after a large pump, the highs will be overcome significantly.
8️⃣ Remember that assets of such liquidity decrease after listings or highs by:
a) active hype, bull market -50-70%
b) secondary trend without extraordinary events -90-93%
c) cycle change -96-98% or scam, if it is a 1-2 cycle project (there is no point in supporting the legend, how it is easier to make a candy wrapper from scratch without believing holders with coins).
9️⃣In the capitulation zone, there can be several of them depending on the trend of the market as a whole and rationality, the asset is of no interest to anyone. Everyone gets the impression that everything is a scam. That is, on the contrary, you need to collect the asset, observing money management, that is, your initial distribution of money and the risk that you agreed with in advance. As a rule, in such zones people "give up" and abandon their earlier vision.
🔟 After the entire position is set (pre-planned, according to your money management), stop and do not get stuck in the market and news noise. Wait for your first goals.
Remember, people always buy expensive, and refuse to buy cheap ("it's a scam", they try to "catch the bottom"), when "the Internet is not buzzing". This all happens because there is no vision, and as a consequence, no tactics of work and risk control . Many want to guess the “bottom”, or “maximums”, and refuse to sell when they are reached. The first and second are not conditionally available, on assets of such liquidity and emission control. But, there are probabilities that you can operate and earn on this, without getting stuck in the market noise. And also in the opinions of the majority (inclination to the dominant opinion and rejection of your plan and risk control), from which you must fence yourself off.
Most people, immersed in market noise and the opinions of others , choose for themselves the price movement, which is beneficial to them at the moment , and to which they are inclined, but do not provide themselves with the tactics of work. This is a key mistake, and the main manipulation that the conditional manipulator achieves, who, by the way, is sometimes not on the asset, to form an opinion and, as a consequence, the actions of the majority.
Because, in essence, most people do not have the tactics of work. Where the news FUD (inclination to the dominant opinion), “market noise” (cutting zones and collecting liquidity), the opinion of the majority, is directed, that is what they are inclined to.
When the price goes in the other direction, it is disappointment.
If these are futures — liquidation of the position. Zeroing out due to greed.
If this is spot — "proud random holders" , without the ability to average the position (no money), to reduce the average price of the position set as a whole, and as a result increase the % of profit in the future.
A trading plan and risk control are the basis, not guessing the price movement. If you do not have the first “two whales” of trading in your arsenal, then you have nothing. It doesn't matter how much you guess the potential movement, as the outcome of such practice is always the same, and it is not comforting.
BTC FOMC FLASH CRASH / LIQUIDATION IDEAThe FOMC data this week could be a conduit that sticks the price to play down these two trend lines.
We can see the mass liquidity on the chart in these low zones.
Bitcoins consistent rise since late 2022 has been leaving a train of long stop loss orders (leveraged sell orders) underneath - think of the mechanics of “why it’s possible” as a massive chain reaction of stop losses getting fired off and creating mania and hysteria for further fear based selling.
If we see drops to these low zones, I’m presenting the TA evidence of it so that we know it’s not the bottom - but a liquidation move.
The worst thing people could do is sell at massive losses thinking BTC is going to zero.
I see this move occurring and following that over the next years, a BTC pushing upwards of those $140-$200k zones.
The market is interested in reclaiming this liquidity - we are awaiting the conduit or event to justify it.
This is my personal trading plan.
Happy trading to all and be safe out there.

AUD/USD Forex Analysis – Trading Update for March 2025The AUD/USD pair has been exhibiting interesting price action over the past week. Following a strong bullish movement that took place on March 4th, 2025, the pair has entered a wedge formation. This bullish push was triggered by the announcement of tariffs, effective starting on March 3rd, 2025.
Key Price Action:
The high of the bullish move was marked at 0.63640, after which the price retraced to test a previous key support level at 0.62730. This level proved to be significant, as it was tested five separate times.
During the retest, the market formed lower lows and lower highs, indicating a shift in market structure. To visualize this, a bearish trendline was drawn, capturing the declining momentum.
Break and Retest:
The move we were anticipating was a break of the bearish trendline, followed by a retest of this trendline. This occurred on March 13-14, 2025, confirming the bearish structure.
After this retest, the weekly close showed a bullish push back to the 1-hour previous high at 0.63286, indicating some bullish interest around this price level.
Current Market Structure:
The pair is now trading within a defined range:
Low: 0.62582
High: 0.63288
We are monitoring the 0.63000 level closely, as it is a critical point of interest. A breakout above or below one of the boundaries of this range will provide further confirmation on the pair's next move.
Next Steps:
If the market respects the 0.63000 level and remains within the range, we will continue to observe price action for any further setups. A break above 0.63288 or below 0.62582 will offer more clarity on the pair’s next directional move.
