THE KOG REPORTTHE KOG REPORT:
In last week’s KOG Report we said we would be looking for price to attempt the push up, go into resistance where we wanted to short the market into the order region, and then look for the long trade back up from there on the RIP into the levels above. This went extremely well giving us a pin point move from level to level. During the week we updated the idea, which was already going to plan with a new bullish bias level and trade the new Excalibur activations upside into just below where we are now.
Plan worked well again giving an almost pip to pip, level to level reaction from our levels and following our bias and analysis posted pre-hand.
Well done to those that followed not only gold but the numerous other pairs we trade in Camelot which also gave us fantastic results for the week.
So, what can we expect in the week ahead?
This week we would say caution on long trades unless we get a pullback into key level support where we feel it’s worth a test, unless the higher levels aren’t taken on or during the early sessions of the week. We have an order region sitting above 2425-35 which is a large region, and if we see price attempt and give us a clean reversal there, we feel an opportunity to short the market is available for traders back down into the 2400 and below that 2385 price region which is where they may want to start to accumulate again. The issue we have here is that 2445-65 level which is a clean region of liquidity if they want to take it and stretch the sellers even more, so here we will caution again, as that level is the extension of the move, be prepared!
So, in practice what do we do?
Because we’re back in uncharted territory again, we’ll have to treat this as level to level play, we’ll look lower in the highlight region to go long, unless broken, and if they continue to take us up, we’ll trade it level to level looking for the ultimate short trade following our trusted guide.
KOG’s Bias for the week:
Bullish above 2395 with targets above 2430-35 and above that 2447
Bearish on break of 2395 with targets below 2375
It’s going to be a difficult week with potential of gaps on opening due to a Powell speech later, be fore market open! There is a lot of geopolitical news driving the markets and fear is present, although it’s looking like we’re going higher we would say caution over the week as a sudden turn will be extreme!
Please do support us by hitting the like button, leaving a comment, and giving us a follow. We’ve been doing this for a long time now providing traders with in-depth free analysis on Gold, so your likes and comments are very much appreciated.
As always, trade safe.
KOG
Tradingplans

THE KOG REPORTTHE KOG REPORT:
In last week’s KOG Report, we said if support held after the open we felt we would get a push to the upside into the order region and if the market held the region we felt an opportunity to short the market was available. That short trade worked well and after partials were taken it was protected. During the week we suggested traders trade caution and we would be looking to target that order region again on the long trade. Again, that trade worked well for us giving a fantastic pip capture half way through the week. We than said we would protect all trades as a break above that order region will then give traders the opportunity to long the market into the 2370-75 region where we would then likely see a reaction in price.
Both these moves presented themselves, although the long wasn’t taken due to it being early session, the short at the end of the week was identified.
The pip capture on gold was immense, not to mention the numerous other pairs we trade and analyse in Camelot.
So, what can we expect in the week ahead?
This week we’ll keep it simple, we’re looking for the market to open and hold these resistance levels so we can continue with a move back down into the order region to start with. So we have the resistance levels of 2360 and above that 2365, which if held could present an opportunity to short the market back down into the order region of 2350-55 with extension into 2345 which is where we’re expecting a temporary bounce in price. We need to be careful here as if this level is held during the early part of the week, we could see a complete correction of the move from Friday back into the 2343-35 region before any opportunity to swing low and then take the long trade back upside which we will monitor.
The levels are on the chart as is the illustration, we’ll update as we always do during the week. Please note, it’s another big week this week funds wise and with the geopolitical cloud above us expect more extreme swings and whipsawing price action. Your SL is your friend, it’s the difference between you having an account to trade or not having one!
Short report this week team so we'll keep it provisional for now.
Please do support us by hitting the like button, leaving a comment, and giving us a follow. We’ve been doing this for a long time now providing traders with in-depth free analysis on Gold, so your likes and comments are very much appreciated.
As always, trade safe.
KOG

THE KOG REPORT THE KOG REPORT
In last week’s KOG Report, we said we would only be looking for one move and that was to short the market into the levels illustrated on the chart. We had the initial opportunity from the intra-day resistance level giving the move breaking through the order region temporarily giving us the bounce to long back up into resistance where we said we wanted to monitor price to establish another short opportunity. Both these worked well although not as straight forward as we had hoped.
During the week, we gave the FOMC Report highlighting the levels to long up into the resistance level and then short the market from higher up, this move however, was a point to point, level to level move continuing the fantastic week we had on Gold, completing over 8 targets activated. Well done to the team again, not only on Gold but the numerous other pairs we trade giving us over 800pips combined captures.
So, What can we expect in the week ahead?
After NFP and FOMC last week, this week we have a bank holiday in the UK which may give us some thin volume to start the week. NFP caused a lot of confusion amongst traders and only managed to whipsaw them back into where the price started. Support now stands at the 2295-7 region, which in our opinion, If held in the early session could give us a push upside towards the order region above, targeting the resistance levels of 2310 initially and above that 2320. Now, what we want to see here is if market can hold this order region again and give us the opportunity to get that short again. If we get the short from above we’ll be looking for the lower levels to be targeted and hopefully we can complete the move.
There are a couple of curveballs here this week, 1) this could open and continue the move downside, if so, we’ll look for the retracements to get in and we’ll target our Excalibur targets upon activation. 2) staying below that 2330-40 order region is important for us to carry out this plan and continue with the move downside. In our opinion, the decent long trades will come from lower down for the ideal swing.
That’s all for this week’s report, simple plan again, not going to over complicate it with numerous what’s and if’s. As usual, we’ll update traders through the week with the daily report, KOG’s bias of the day and the daily levels.
Please do support us by hitting the like button, leaving a comment, and giving us a follow. We’ve been doing this for a long time now providing traders with in-depth free analysis on Gold, so your likes and comments are very much appreciated.
As always, trade safe.
KOG

+290 Pips on CAD/JPYThis is a quick update on the CAD/JPY. I mentioned this in the Weekly analysis I did yesterday.
Apologies for the sound.

$Algo #Algorand Algorand EURONEXT:ALGO #Algo
Is currently caught between the support at $0.15 range and the now resistance above at the $0.18 range.
If we get a follow up pullback with the rest of the market on further war i.e. middle east drama, then I would watch for the next support range to come in at the $0.12 range.
I've purposely given you the same chart and layout but on two different time frames to help newer traders coming into this cycle see how different things can look on a daily vs a weekly time frame.
I think that this can really help speed up learning for many and to open their minds to variables.
As you see the daily can easily in this case look much more instantly bullish and give you the greater feeling of FOMO #Fomo to jump in. Whereas the weekly can give you more of a tactical view and help with your approach being so.
Hopefully some of you find this chart helpful during this stressful pullback/flush that I'm aware has really beaten down and or killed many portfolios for traders.
I've fallen off on posting/sharing my charts these last few months while I was trading ALOT myself and on multiple platforms and various ideas. However, during these more stressful times I will try and stay more active with updating what community I have.
For my birthday without cause or warning X shutdown my larger account @RareBreedOG so I'm starting over fresh with almost no followers now for the algorithm. That being said I would greatly appreciate help with you hitting the like /Follow/share buttons as much as possible if you find these charts helpful at all or even just want to help me rebuild my following after getting Fu**ed by X. For this reason, I don't plan to pay for a checkmark this time around either, but you can all help give me reason to keep sharing and not just leave to other platforms.
Everyone stay safe and trade wisely and be careful with leverage in these uncertain times.
Biggest goal is to not be liquidated before the real top comes and or worst-case scenario have positions worth holding until the next cycle if we really did just have an early cycle Rare Triple Top.

AUDCAD - WEEKLY FORECASTForecast: Start of Bullish Trend (Daily)
Invalidation Level: 0.87222
Only buy when the price is close to these levels: 0.88893; 0.87992.

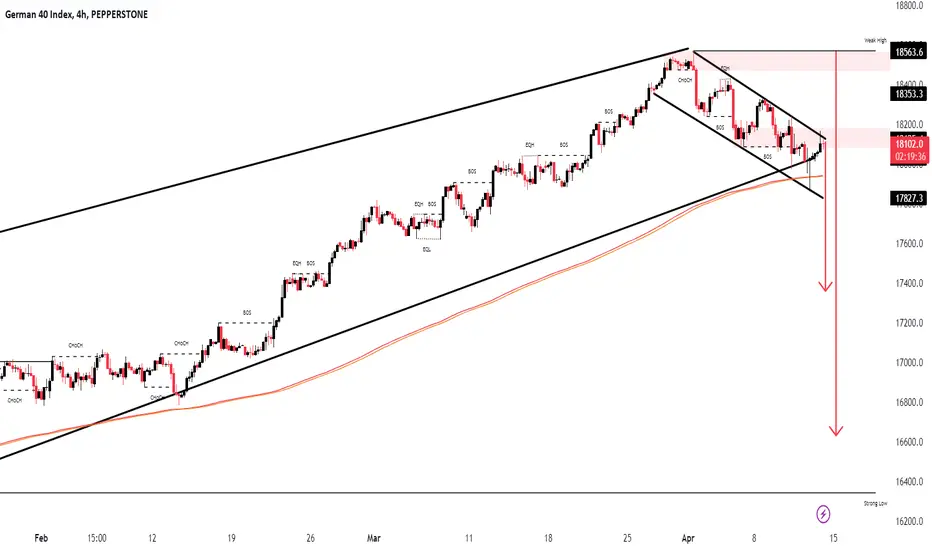
Germany 40 IndexPair : Germany 40 Index
Description :
Rising Wedge as an Corrective Pattern in Long Time Frame and Breakout of Lower Trend Line
Break of Structure
RSI - Divergence
Lower Lows - Lower Highs
Bullish Channel in Short Time Frame
Don't Be a Trigger-Happy Trader: Patience is the Ultimate WeaponThe allure of the markets is undeniable. Charts dance across the screen, promising riches for those who can decipher their secrets. But amidst the flashing indicators and exhilarating wins, a forgotten weapon often lies dormant: **patience**.
Imagine yourself as a skilled sniper in the financial jungle. Your prey? Lucrative trades. But unlike the movies, a hail of bullets (read: impulsive trades) rarely leads to victory. It's the patient stalk, the careful aim, the shot taken only when the target is in perfect sight, that brings down the prize.
**The Peril of the Noisy Market:**
Sometimes, the market is like a crowded carnival. Conflicting signals, false breakouts, and choppy price action create a cacophony – a confusing noise that makes discerning a clear direction nearly impossible. This is no place for a trigger-happy trader. Jumping in and out based on fleeting signals is a recipe for disaster.
**The Power of Selective Strikes:**
A skilled trader understands the importance of waiting for **high-probability setups**. These are situations where the technical indicators align, fundamental factors support a move, and the risk-reward ratio is attractive. These clear signals are your sniper's scope, ensuring your shot hits the mark.
**The Virtue of Empty Holsters:**
There will be days, even weeks, where the market offers no clear setups. This isn't a personal failing! It's the market's way of saying, "Hold your fire, soldier." Accepting these quiet periods and **resisting the urge to trade** is a sign of strength, not weakness. It allows you to conserve your capital and mental energy for when the truly lucrative opportunities arise.
**Trading is a Marathon, Not a Sprint:**
Building long-term trading success requires discipline. It's about waiting for the right opportunities, even if it means sitting on the sidelines for a while. Remember, **patience is not passivity**. It's actively managing your emotions, protecting your capital, and waiting for the perfect moment to strike.
**Taking a Break is a Sign of Strength:**
If the market continues to offer no clear signals, and the lack of action is affecting your focus or creating frustration, consider taking a break. Step away from the charts, clear your head, and come back refreshed. A well-rested mind is a sharp mind, better equipped to identify those high-probability setups when they finally appear.
**Remember:** The market will always be there. Don't fall victim to the need for constant action. By embracing patience, you become a more disciplined, strategic trader, and ultimately, a winner in the financial jungle. So, put down that trigger finger, sharpen your focus, and wait for the perfect shot. Your financial future will thank you for it.

THE KOG REPORT - Update (what a day on Gold)End of day update from us here at KOG:
Following on from the KOG Report published yesterday, what a move on Gold, point to point, level to level, as we like it here at KOG. Early session straight into support giving the short, then the RIP which was expected straight into the order region, and to top it off, the RIP from the order region for the short. Pip capture, unbelievable! We've been using the red box strategy for the rest of the move which has given us opportunities to capture the scalps 50-60pips a go in between.
To be honest, that should be the week all done and dusted in terms of trading.
So, what now?
We have immediate support below 2315-10 which will need a forceful break to go lower, otherwise, any attempt on support could result in another RIP to take away the liquidity now sitting above 2350! For that reason, unless you're already short from the region given and protected, caution on shorting low in this range unless we confirm the break. Resistance now stands at 2330-35 with a break taking us higher before we then attempt to target lower pricing again. They're not going to make it easy, so stay disciplined and control lot sizes, the trade will come!
Please do support us by hitting the like button, leaving a comment, and giving us a follow. We’ve been doing this for a long time now providing traders with in-depth free analysis on Gold, so your likes and comments are very much appreciated.
As always, trade safe.
KOG

THE KOG REPORT THE KOG REPORT:
In last week’s KOG Report, what can we said during the early part of the week we wouldn’t be looking to long the market, instead, we would look for a high to form and then short the market back down in to 2230 and below that 2220. We got the short into the initial levels which is where we suggested during the week that traders take the trades and wait for a RIP. We gave the bias level targets as bullish above 2220 and long trades to be take into 2250 and above that 2286 on the bounces, which as you can completed. Then came NFP and the long trade from the support level, again giving us a great capture enabling us to have traded this down and then up again level to level almost pip to pip entry and exit.
Please be aware, these levels are not small captures, you only need to look at the chart posted to see the distance that has been covered in this play.
Great week for us in Camelot, not only on Gold, but on the numerous other pairs we trade. Hit rate was amazing, pip capture through the roof!
So, what can we expect in the week ahead?
Quick and simple KOG Report this week. Caution again on going long too high up as any movement like we’ve seen in the opposite direction will not give you time to manage your trades. Keep your lot sizes in check and make sure you're risk model is up to scratch. This is no normal market, we're in unprecedented times and markets reacting in extremes!
For this week, we’re looking at a potential stretch on gold so please be careful! These levels are to be tested, but one more little move to the upside to get the ideal entry would be perfect for us. So, we have the initial resistance right here on the close 2230-35, if held there is an opportunity to short the market back down into support regions 2310-05 which is where we want to see what happens and look for a potential RIP. A break here is what is needed for the price to continue downside, otherwise one more swing higher into the order region 2345-50 could be available which is where the ideal short may come from! Longs higher up are risky as the turn can be sudden and will leave traders left hanging a region where data is lacking, so caution please unless you’re scalping for quick captures from the intra-day levels we posts as well as the red boxes.
Use the levels on the chart and use the intra-day levels, don't marry the trade, don't marry the position. When you trade like this, it doesn't matter where the market goes, you trade it, take what it gives and come back again when your set up is right.
It’s really as simple as that this week, price goes up into our levels, we want to test the shorts, comes down we’ll either test the longs, or wait for the potential stretch and then short it from higher up.
KOGs bias for the week:
Bearish below 2350 with targets below 2310 and below that 2280
Bullish again on break of 2350 with targets above 2365 and above that 2372
Range in play – Support 2255 / Resistance 2372
Please do support us by hitting the like button, leaving a comment, and giving us a follow. We’ve been doing this for a long time now providing traders with in-depth free analysis on Gold, so your likes and comments are very much appreciated.
As always, trade safe.
KOG

GOOGL to Low $100s?Overview
Google ( NASDAQ:GOOGL ) is in the dangerous territory of a double top formation. I've discovered this same macro-pattern with a few other assets as well. In combination with a rise in long-term Treasury Yield Curve rates since December 2023, I think a rush of selling pressure could be around the corner.
Technical Analysis
Utilizing Fibonacci retracement levels along with historical supports & resistances, the $126-136 range appears to be a key level in the share price. The double top formation is a bearish reversal pattern that resembles the letter "M" and, when valid, the second peak is greeted with significant selling pressure. According to technical indicators GOOGL is beginning to reveal the symptoms of a bearish reversal.
The share price has risen on dwindling volume, Money Flow Index (MFI) is approaching overbought territory, and the On-Balance Volume (OBV) is still under a ceiling created in March 2022. A rising wedge is also visible on the hourly charts with a micro Head & Shoulders in development. Should a high volume breakdown occur then I believe a price target range between $109-126 is probable, however, I am expecting adequate support around $126 as it correlates with both a 61.8% Fibonacci level and has history as a key area of support & resistance.
Speculations
Earnings season is a great time to profit from derivative trading, however, it can also be more treacherous due to the volatility most stocks experience in the days leading up to and immediately following their Quarterly Releases. Because GOOGL is having their Earnings Call in the next few days, I would not be surprised to see sharp price movements in either direction regardless of the current trends. Concrete stop-losses and price targets should be determined before entering any positions.

HP to $60Overview
This is a very brief price prediction for HP that will require further review, however, I found the opportunity too affordable to pass up and wanted to share my thoughts. Bottom line: the call options are very cheap and HPQ's chart screams potential for a lucrative trade.
Trading Pattern
HP ( NYSE:HPQ ) has formed a bullish flag on the 1D chart and it appears close to breaking out as the descending wedge is completely developed.
Technical Indicators
MFI is approaching oversold territory while MACD has a sharp positive slope above its signal line.

PBFintech - Mapping a script using Pivots, CPR and MoneyFlow Hey Pivster's
Here, I have tried to demonstrate how you can use the money flow in the market to map the script alongside its basic price action which eventually leads us to some interesting zones in the journey which are being classified as the 'buyers' or 'sellers' zone depending upon the situation of the price and money flow statistics present at that very juncture!
Moreover, due to limited time we quickly dived in to see the confluence of these zones (current stop) along with Pivot Points of multiple timeframes in a single tab which give us an additional boost to our analysis and make the trade refined apart from the standard information available in the market.
NSE:POLICYBZR (MTF PIVOT CHART) -
NSE:POLICYBZR (CPR TRAILS CHART) -
NSE:POLICYBZR ( DAILY TF CHART ) -
Thank You!

THE KOG REPORT - FOMC The KOG REPORT – FOMC
This is our view for FOMC, please do your own research and analysis to make an informed decision on the markets. It is not recommended you try to trade the event if you have less than 6 months trading experience and have a trusted risk strategy in place. The markets are extremely volatile, and these events can cause aggressive swings in price.
Today’s FOMC may bring a curveball with it, so we’re going to use the extreme levels as usual, but, we’re going to say please play caution on the markets. The trade always comes after the event, patience will pay on this one!
We have the support level below 2150-55 as mentioned through the week, with resistance above 2175 which are both either side of range play at the moment. Our bias is still active, but, due to the volatility that may present itself, we’ll stick with the higher levels as potentials regions for a RIP. So, if price does carry up towards the 2175-85 region and we can see a clean set up, an opportunity to short the market back down initially into the 2155 levels and then on the break, below that 2148 and further down could be available.
Please note, that breaking above will invalidate this and we are likely to see higher pricing through the rest of the week. There was a level of 2210 in extension of the move, which is extreme volume enters is a possibility, so if you’re going to risk it, your risk model better be up to scratch!
On the flip. Rejection around this 2165 region, we can see price attempt the support 2145 and upon the break we will be looking for this to go lower, initially into the 2135 region and then below that potentially 2120! If we get that move to the downside, we will be looking to carry any open trades down into the given regions if we get a clean set up, and only long for the scalps and quick captures from the given levels.
In all honesty, right now thoughts are we would rather let this play out and let the take the price to where they want. We’ll still with the plan for now on the KOG Report which has worked well, but any trades should be protected and a majority taken.
Please do support us by hitting the like button, leaving a comment, and giving us a follow. We’ve been doing this for a long time now providing traders with in-depth free analysis on Gold, so your likes and comments are very much appreciated.
As always, trade safe.
KOG

Germany 30 19/03Pair : Germany30 Index
Description :
Bullish Channel as an Corrective Pattern in Short Time Frame and Rejection from Lower Trend Line
Completed " 123 " Impulsive Waves
Break of Structure
Fibonacci Level - 261.8%

REDTONE DIGITAL BHD MYS - Good Sign, Ready to enter MA Low ZoneTrading style: BBMA
The stock rose and formed a white bullish candle last Friday, breaking out above
its 3-week long triangle pattern. The breakout was supported by a higher trading
volume which indicates a renewed buying interest after the stock’s consolidation
from the 52-week high. More upside is likely to follow after the said breakout,
underpinned by the rising EMAs.
I think that aggressive traders may want to go long now with a stop-loss set
at RM0.970. For today, price may go down to MA Low in Daily and 4H timeframe, that is a good sign to buy now.
Follow-through buying may lift prices to test the historical
resistances at RM1.10 and RM1.15. My target price using fibonacci is at RM1.28

How I caught 100 pips on EUR after my analysis got INVALIDATED!In my last analysis, we were expecting EURUSD to retrace to the golden zone where I was looking for buying opportunity.
Unfortunately, the price broke the highs and continued moving to the upside. Our main goal was to buy EURUSD targeting areas above 1.090.
So what we did was that we waited price to come back to an area where we had at least two confluences.
1. Uptrend
2. 61.8 fibonacci level
Using the Fibonacci tool from the last low to the last high, we were able to catch EURUSD at a good level ( 1.087 ) targeting the 1.098 level ( +100 pips )
Price will always come back and give you the best opportunity so no need to FOMO and panic!
This is an explanation of how we can find a high probability trade like the one above

CHZ LOOKING GOODCHZ found support at 100DMA AND at 200DMA, a cross also happens, which is bullish. Acceptance into the zone (May 13, 2022 - June 7, 2023) is a big deal.
Wait for the retest, if the price manages to hold 0.93 and a little lower, the way is open to 0.208, which is 110% profit.
The market is currently in a period where leverage should not be used, pure DCA.
If you like this free content feel free to like for support.

germany 30Pair : Germany 30
Description :
Completed " 12 " Impulsive Waves
RSI - Divergence
Break of Structure
Double Top
Resistance Level
Bullish Channel as an Corrective Pattern in Short Time Frame

XRP/USDT BULLRUSH BEFORE THE FLUSH???Looking at the XRP/USDT Daily Time Frame, we can get an idea where and WHY price is moving the way it is:
We see that ALL previous buyside has been swept.
This should indicate BULLISH order flow.
Every bullrun hits it's breaking point but where will that be???
We see that there's more Buyside that's yet to be swept and I'm thinking it will sweep them soon in the near future.
But WAIT .... There's More!
Right above the highest high, there is a GORGEOUS Daily SIBI resting right above.
Sadly, it hasn't been tapped yet :(
If it gets tapped, will XRP rise or will that be it's Downfall???
There's only one way to find out ;)
I'm patiently waiting for potential opportunities that allow a solid 2:1 RR trade to be taken.
(DISCLAIMER) THIS IS NOT FINANCIAL ADVICE! THIS IS MY PERSONAL OPINION AND I COULD BE 100% INACCURATE IN MY ANALYSIS. DO YOUR OWN RESEARCH AND ANALYZE YOUR OWN CHARTS. TRADING IS EXTREMELY RISKY SO BE CAUTIOUS AND TRADE AT YOUR OWN RISK!!!

THE KOG REPORTTHE KOG REPORT
In last week’s KOG Report we said we were on the flip again so would be looking for price to target that 2030-28 level at some point early week before then looking for an opportunity to long the market into the 2040-45 region with extension into 2050. It was this region we said we would ideally want to hold any short trades down if we got the reaction that we wanted, however, during the move into resistance, we suggested traders trade it level to level as the reaction was controlled and exit at the support level. It was here, after taking the move down, then up and scalping it down again, identifying the perfect opportunity to long, we unfortunately put a risk on longs due to the news release on Friday. So although we did well on Gold, we missed the final move up to where we closed, better to be safe than sorry I guess.
So, what can we expect in the week ahead?
This week we would say caution on the markets, they’re extreme and stretched with sentiment also approaching extreme levels. We’re a bit high here to even consider going long in the early sessions, so for that reason, we would suggest looking for the price to target the higher order region and looking for a reaction in price, if there is a confirmed set up, we feel an opportunity to short the market into the 2070 and below that 2065 region are available. It is this support region 2060-65 and below that 2055 that need to be monitored, holding above should allow us to get in on the swing into the higher levels firstly 2095 and them above that 2120!
What we want to see this week is if the order region 2085-80 becomes a support level for gold for the coming weeks. If so, it’s likely we’re to see higher pricing with the higher target levels not a huge distance away. This is something that can only be monitored on the structure and formations of the market when it opens and settles, otherwise we will need to trade the immediate levels and take it how we see it as we usually do.
Simple on this week, on open, look higher for the short trade, if we support below at the intra-day levels, it's a long, if we break, we correct the whole move!
KOG’s bias for the week:
Bullish above 2065 with targets above 2093, 2095 and above that 2120
Bearish on break of 2065 with targets below 2045
Please do support us by hitting the like button, leaving a comment, and giving us a follow. We’ve been doing this for a long time now providing traders with in-depth free analysis on Gold, so your likes and comments are very much appreciated.
As always, trade safe.
KOG

GOLD / USD; Analysis & Trading Plan (05-MAR-24)Hello Traders !! Here is my Gold Analysis & Trading Plan
GOLD in term of structure has been completed. ONLY SELL setup from now on.
Trade With Care,
WAVE HUB FX
----------
Please follow me and like if you agree or this idea helps you out in your trading plan
Disclaimer: This is just an idea. Please do your own analysis before opening a position. Always use SL & proper risk management.
Market can evolve anytime, hence, always do your analysis and learn trade management before following any idea.

$0.000015 In Sight?Shiba Inu token has been grabbing momentum as of late. On the 1W and 1D charts, a distinct W is beginning to form with us being a little above the second trough at the time of this idea. I drew a crude Fibonacci retracement -- it is crude because I am not 100% that I am using the retracement tool accurately BUT there are three fibonacci retracement levels that show strong correlation to prior resistances and supports -- 78.6%, 50%, and 23.6%.
If Shiba Inu's price can break through the resistance presented at 23.6% then the next major resistance appears to be at the 50% Fibonacci level, then the 78.6%, and then finally arriving at a bountiful price target around $0.00001587. According to the chart's timeline, this could take up to three months to complete at its current pace which presents two possibilities:
Bitcoin ETF gets rejected and the crypto market experiences a news-propelled crash. Corrections will be inevitable in any market but, in my opinion, the Bitcoin ETF getting rejected could send us back to prior lows or at least close to it.
Bitcoin ETF gets approved and the prior price target of $0.000015 may arrive sooner as well as be too conservative.
Traders should remain cognizant of macroeconomic news and Bitcoin ETF updates as they can render a trading pattern invalid at any moment. However, should everything remain status quo and the market outlook remain positive, it is my personal opinion that this trade can benefit both short and medium term holders.
Traders should practice good habits by increasing Stop-Losses with market gains and watching the volume to avoid entering or exiting a trade too soon.
COINBASE:SHIBUSD
