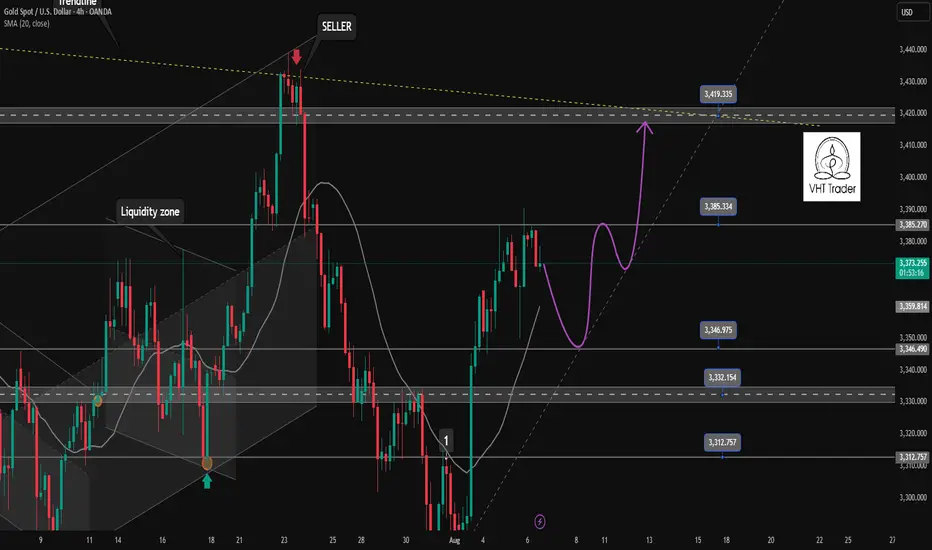
Correction in Tokyo, London session. And return go up in NewYork✏️Gold prices saw some selling pressure in the Tokyo session. Yesterday's US session saw strong buying pressure, leading to a psychological profit-taking session early today. The possibility of a correction in the Asian and European sessions today and the buying pressure will return in the London session. The SELL signal is triggered at the moment and the Target is aimed at the reaction of buyers at the support areas for the BUY strategy.
📉 Key Levels
SELL now 3375 (Scalping)
BUY trigger: Price rejection at the support areas 3346-3333-3315
Target 3420
Leave your comments on the idea. I am happy to read your views.
Tradingrange
HH HL intact.FLYNG Closed at 50.80 (25-05-2025)
HH HL intact.
No Bearish Divergence yet on bigger tf.
54- 56 is the resistance for now.
If this level is crossed with Good Volumes,
we may witness further New Highs around 60+
On the flip side, 49 - 49.50 & then 47 - 47.50
may act as Good Support Levels.
However, breaking 45 will bring more Selling Pressure
towards 42 - 44

GOLD WEEKLY CHART MID/LONG TERM ROUTE MAPHey Everyone,
Here’s our latest weekly chart update. Once again, the Goldturn Channel continues to prove its reliability, with price action unfolding just as anticipated.
Last week, we noted multiple failed attempts to break above the channel top, each confirmed by the EMA5 being unable to close through resistance. This led to a pullback as low as 3189, nearly touching the 3094 level right near the channel's half line, a key support zone we've been closely monitoring.
We caught an early bounce off that half line, supported by confluence on our 1H and 4H setups, and that momentum has carried through into this week.
This week, we saw that bounce continue firmly off the half line, pushing price back up toward the channel top. Price has now closed above both the 3281 axis and the channel top, confirming a strong breakout and leaving an open gap toward 3387. This move not only validates our strategy but also reinforces the strength of the Goldturn system in capturing high probability swings.
As long as price remains above the channel half-line and especially now above 3281, we will continue looking for dip buying opportunities on retracements, using our intraday levels for targeted 20–40 pip moves. If the price pulls back below these key levels, we’ll reassess for potential downside toward the lower boundary of the channel.
This is exactly why we stick with our Goldturn Channel methodology our proprietary system based on weighted averages. It cuts through the market noise, distinguishes real breakouts from fake outs, and empowers us to trade with confidence and clarity.
Thanks again for your continued support, your likes, comments, and follows mean a lot.
MR GOLD
GOLDVIEWFX

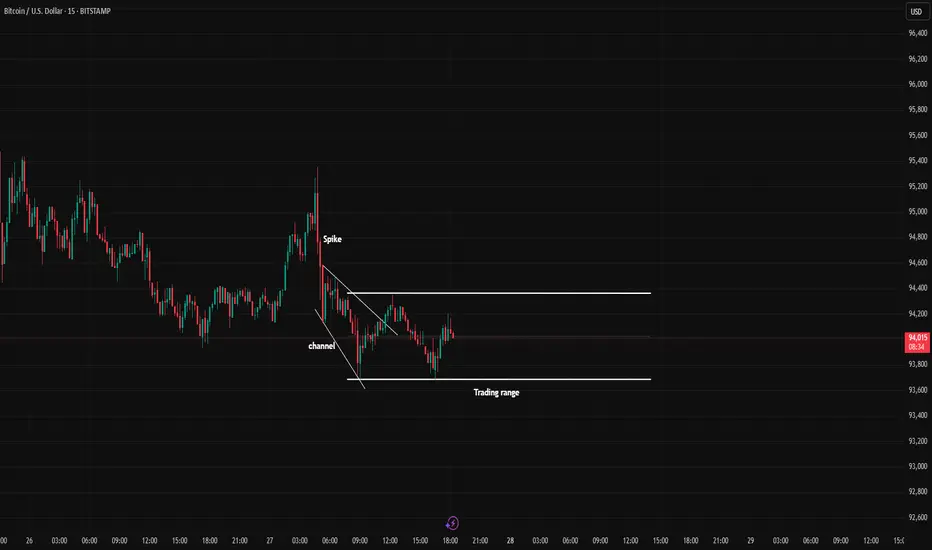
BTC cycleIn the 5-minute timeframe, you can sell at the top of the trading range and buy at the bottom of the trading range (by observing reversal candles and patterns).
Alternatively, you can wait for a breakout and enter in the direction of the breakout.
Be mindful of fake breakouts
Us30 Upward or downward?In the 5-minute timeframe, you can sell at the top of the trading range and buy at the bottom of the trading range (by observing reversal candles and patterns).
Alternatively, you can wait for a breakout and enter in the direction of the breakout.
Be mindful of fake breakouts

INTC 20 Mar 2025 Analysis
INTC remains in a 158-day trading range (yellow box).
Attempt to breakout above the trading range on 18-Feb lacked follow-through buying and failed.
The recent strong move up to the March 18 high looks like a Buy Vacuum and bull leg within a trading range.
To see the definition of a Buy Vacuum, see the comment section on the tagged related post on the 20 Mar SPX analysis.
For now, because the market remains in a trading range, traders will BLSH (Buy Low, Sell High).
That means buying from around the lower third and selling in the upper third of the trading range.
Traders will continue to do this until there is a breakout from either direction with follow-through buying/selling.

AUD/USD Forex Analysis – Trading Update for March 2025The AUD/USD pair has been exhibiting interesting price action over the past week. Following a strong bullish movement that took place on March 4th, 2025, the pair has entered a wedge formation. This bullish push was triggered by the announcement of tariffs, effective starting on March 3rd, 2025.
Key Price Action:
The high of the bullish move was marked at 0.63640, after which the price retraced to test a previous key support level at 0.62730. This level proved to be significant, as it was tested five separate times.
During the retest, the market formed lower lows and lower highs, indicating a shift in market structure. To visualize this, a bearish trendline was drawn, capturing the declining momentum.
Break and Retest:
The move we were anticipating was a break of the bearish trendline, followed by a retest of this trendline. This occurred on March 13-14, 2025, confirming the bearish structure.
After this retest, the weekly close showed a bullish push back to the 1-hour previous high at 0.63286, indicating some bullish interest around this price level.
Current Market Structure:
The pair is now trading within a defined range:
Low: 0.62582
High: 0.63288
We are monitoring the 0.63000 level closely, as it is a critical point of interest. A breakout above or below one of the boundaries of this range will provide further confirmation on the pair's next move.
Next Steps:
If the market respects the 0.63000 level and remains within the range, we will continue to observe price action for any further setups. A break above 0.63288 or below 0.62582 will offer more clarity on the pair’s next directional move.

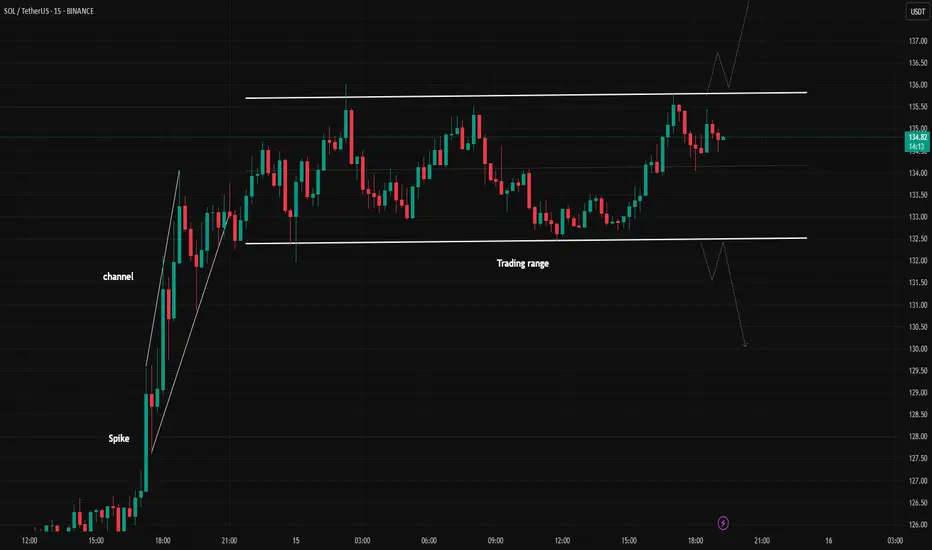
SOLUSDT Upward or downward?Hello,
In the 5-minute timeframe, you can sell at the top of the trading range and buy at the bottom of the trading range (by observing reversal candles and patterns).
Alternatively, you can wait for a breakout and enter in the direction of the breakout.
Be mindful of fake breakouts.
May your trades be profitable!
Gold in a tradingranget seems that gold has entered a tradingrange and is not breaking out for now.
Switch to the 5-minute timeframe; you can enter a trade when you spot reversal candles at the top and bottom of the trading range.
There is a high probability of the channel extending.
Good luck!

A dirty rangetrading!!!A dirty tradingrange!!!
Lower highs are visible on the chart.
There is a possibility that the tradingrange may break downward with a strong candle.
Or will the price rise to the top of the tradingrange?
Share your thoughts in the comments.

gold still is in trading range and we should BLSHI mean buy at low of trading range and sell at high of trading range

When you're Dancing on the ceiling; Short then LongWe recently broke-out of a trading range, to the Upside. Short now for Temporary Profits, or, Wait for the price to follow the grey line I drew in illustrating the likely Anticipated move. Buy long, at-or-near the Pullback (top Dashed line).
Should go (up) Down Upppp!
For your added Confidence, i recommend Waiting for a Bullish Candle After the retest to Pullback Level; you Want to See a Green candle after touching that Dashed line.

SPX SPY Trading Range or BO? Daily Chart Analysis - 5 Mar 2025
• The market traded lower earlier in the day. The market then reversed higher for most of the day around noon time. The SPX then pulled back off its high in the final 30 minutes of the day.
• The bulls see the market trading in a broad bull channel and want the move to continue for months. They want an endless pullback bull trend.
• They want a retest of the all-time high (Dec 6) followed by a breakout and trend resumption. They see the current move as a bull leg within the trading range.
• They want a reversal from a double bottom bull flag (Jan 13 and Mar 4) and a wedge (Feb 25, Feb 28, and Mar 4).
• They hope the bottom of the 22-week trading range will act as support. They want a failed breakout below the January 13 low.
• At the least, they want a retest of the middle of the trading range (around the 20-day EMA).
• If the market trades lower, they want the November 4 or October 3 low to act as support.
• The bears got a reversal from a higher high major trend reversal, a wedge top (Dec 6, Jan 24, and Feb 19), and a smaller double top (Jan 24 and Feb 19).
• They see the market as being in a 22-week trading range.
• They hope to get a bear leg to retest the January 13 low followed by a breakout below. They got it yesterday (Mar 4).
• Next, the bears want a breakout below the January 13 low, followed by a measured move based on the height of the 22-week trading range.
• If the market trades higher, they want the bear trend line or the 20-day EMA to act as resistance.
• They want at least a small second leg sideways to down to retest the March 4 low.
• So far, the market is trading in a 22-week trading range.
• The SPX broke below the January 13 low yesterday (Mar 4) and traders want to see if there are any follow-through selling.
• Or will the market form a pullback, followed by a second leg sideways to down to retest the March 4 low after that?
• Traders may BLSH (Buy Low, Sell High) within the trading range until there is a breakout from either direction with follow-through buying/selling.
• The bears must create a strong breakout below the January 13 low with follow-through selling to convince traders a breakout could be underway.

Bullish Breakout for Sonic – Ideal Entry Levels to Watch!SET:SONIC (previously FTM) has broken above $0.733, confirming bullish momentum. However, a short-term pullback toward $0.645 - $0.618 could offer a better entry before the next move higher.
If support holds, the price may target $0.85 - $1.00, while a drop below $0.55 could weaken the bullish outlook. Patience is key for an optimal risk-reward setup.


ALPHAOFSOL/USDT NEW INCREASE VOLUMEALPHAOFSOLUSDT can show na ew volume increase in the coming time frames.

bch range"🌟 Welcome to Golden Candle! 🌟
We're a team of 📈 passionate traders 📉 who love sharing our 🔍 technical analysis insights 🔎 with the TradingView community. 🌎
Our goal is to provide 💡 valuable perspectives 💡 on market trends and patterns, but 🚫 please note that our analyses are not intended as buy or sell recommendations. 🚫
Instead, they reflect our own 💭 personal attitudes and thoughts. 💭
Follow along and 📚 learn 📚 from our analyses! 📊💡"

GOLD WEEKLY CHART MID/LONG TERM ROUTE MAPHey Everyone,
Please see update on the weekly chart idea we have been tracking for over a month now and still playing out, as analysed.
Previously we stated that the channel top was continuing to provide support like we stated for the past few weeks and. as long as we see no ema5 cross and lock below into the channel, we can safely continue with our plans to buy dips in this range.
- This is continuing to play out perfectly. You can see although we had many breaks into the channel with candle over the last few weeks, ema5 failed to break inside, confirming the rejection and providing support above the channel like we stated.
Last week we stated that the bounce from the channel was playing out, as analysed and now heading towards our 2729 AXIS gap target above.
- This was hit perfectly completing this target. We now have a candle body close above 2729 opening long range/term gap at 2856 and will need ema5 lock to further confirm this.
This is the beauty of our channels, which we draw in our unique way, using averages rather than price. This enables us to identify fake-outs and breakouts clearly, as minimal noise in the way our channels are drawn.
Thank you all for your likes, comments and follows, we really appreciate it!
Mr Gold
GoldViewFX

eth midterm range"🌟 Welcome to Golden Candle! 🌟
We're a team of 📈 passionate traders 📉 who love sharing our 🔍 technical analysis insights 🔎 with the TradingView community. 🌎
Our goal is to provide 💡 valuable perspectives 💡 on market trends and patterns, but 🚫 please note that our analyses are not intended as buy or sell recommendations. 🚫
Instead, they reflect our own 💭 personal attitudes and thoughts. 💭
Follow along and 📚 learn 📚 from our analyses! 📊💡"

GOLD ROUTE MAP UPDATEHey Everyone,
Another great day on the charts today with our analysis playing out perfectly inline with our plans.
After completing 2717 and 2737 bullish targets yesterday, we stated that we will now look for ema5 to lock above 2737 for a continuation into 2753. We got the lock confirmation giving us plenty of time to get in for the action and then BOOOOM!!! 2753 was hit completing this target.
We now have a break above 2753 leaving 2768 open. However, we will not chase this from the top due to potential corrections and as always safer for us to buy from dips using our Goldturn support levels.
We will keep the above in mind when taking buys from dips. Our updated levels and weighted levels will allow us to track the movement down and then catch bounces up.
We will continue to buy dips using our support levels taking 30 to 40 pips. As stated before each of our level structures give 20 to 40 pip bounces, which is enough for a nice entry and exit. If you back test the levels we shared every week for the past 24 months, you can see how effectively they were used to trade with or against short/mid term swings and trends.
BULLISH TARGET
2717 - DONE
EMA5 CROSS AND LOCK ABOVE 2717 WILL OPEN THE FOLLOWING BULLISH TARGET
2737 - DONE
EMA5 CROSS AND LOCK ABOVE 2737 WILL OPEN THE FOLLOWING BULLISH TARGET
2753 - DONE
EMA5 CROSS AND LOCK ABOVE 2753 WILL OPEN THE FOLLOWING BULLISH TARGET
2768
EMA5 CROSS AND LOCK ABOVE 2768 WILL OPEN THE FOLLOWING BULLISH TARGET
2786
BEARISH TARGETS
2696 - DONE
EMA5 CROSS AND LOCK BELOW 2696 WILL OPEN THE FOLLOWING BEARISH TARGET
2675
EMA5 CROSS AND LOCK BELOW 2675 WILL OPEN THE RETRACEMENT RANGE
RETRACEMENT RANGE
2661 - 2647
EMA5 CROSS AND LOCK BELOW 2647 WILL OPEN THE SWING RANGE
SWING RANGE
2632 - 2618
As always, we will keep you all updated with regular updates throughout the week and how we manage the active ideas and setups. Thank you all for your likes, comments and follows, we really appreciate it!
Mr Gold
GoldViewFX

AUD/USD Analysis, Key Points, and Trading PlanKey Points:
Strong Support/Resistance: .63000
1 Hour Breakthrough & Retest Point: .61800
Next Target: .60000
AU is overall bearish in a trading range of .63000-.60000
We can potentially see a retest to .61800 before seeing more bearish momentum.
I will keep you updated on new information given throughout the week.

Nonfarm Forecast This WeekendUS Treasury yields rose to their highest since May last year, which has been a factor in the decline in gold prices. In contrast, the US dollar index fell sharply today due to concerns about the country's ballooning debt burden, which also supported gold's highs. In a new development, President-elect Donald Trump denied that he would ease new trade tariffs. Mr. Trump dismissed a Washington Post report citing his aides as saying that the new president might be more selective about new tariffs.
After rising 27% in 2024, Goldman Sachs recently dropped its forecast for gold to reach $3,000 an ounce by the end of 2025, instead forecasting 2026 due to expectations that the US Federal Reserve will cut interest rates less.
Investors are now looking ahead to Friday's nonfarm payrolls data, which is expected to help shape expectations for the Fed's interest rate path this year. Market watchers are also looking to private sector employment data and the minutes of the Fed's most recent policy meeting for further details.
🔥 XAUUSD SELL 2640 - 2638🔥
💵 TP1: 2630
💵 TP2: 2620
💵 TP3: OPEN
🚫 SL: 2647

GOLD 1H CHART ROUTE MAP & TRADING PLAN FOR THE WEEKHey Everyone,
Please see our updated 1h chart levels and targets for the coming week.
We are seeing price play between two weighted levels with a gap above at 2639 and a gap below at 2617. We will need to see ema5 cross and lock on either weighted level to determine the next range.
We will see levels tested side by side until one of the weighted levels break and lock to confirm direction for the next range.
We will keep the above in mind when taking buys from dips. Our updated levels and weighted levels will allow us to track the movement down and then catch bounces up.
We will continue to buy dips using our support levels taking 30 to 40 pips. As stated before each of our level structures give 20 to 40 pip bounces, which is enough for a nice entry and exit. If you back test the levels we shared every week for the past 24 months, you can see how effectively they were used to trade with or against short/mid term swings and trends.
BULLISH TARGET
2639
EMA5 CROSS AND LOCK ABOVE 2639 WILL OPEN THE FOLLOWING BULLISH TARGET
2666
EMA5 CROSS AND LOCK ABOVE 2666 WILL OPEN THE FOLLOWING BULLISH TARGET
2691
EMA5 CROSS AND LOCK ABOVE 2691 WILL OPEN THE FOLLOWING BULLISH TARGET
2719
BEARISH TARGETS
2617
EMA5 CROSS AND LOCK BELOW 2617 WILL OPEN THE FOLLOWING BEARISH TARGET
2593
EMA5 CROSS AND LOCK BELOW 2593 WILL OPEN THE SWING RANGE
SWING RANGE
2570 - 2551
As always, we will keep you all updated with regular updates throughout the week and how we manage the active ideas and setups. Thank you all for your likes, comments and follows, we really appreciate it!
Mr Gold
GoldViewFX
