The EURUSD "over-extended" AugustI have said it several times I remain an EURUSD Bearish bias - long-term - due to the monetary policies divergence, on top of the fact that market unlikely have fully priced it in (hence there could be more move to the downside). To the shorter term however, I am pretty much Bullish bias because of the following :
1) EURUSD has had a strong sell-off in which it reached the average monthly range and exceeded it roughly by 50%. The market belief that I have (among others) is when a trading range for a particular timeframe has been exceeded, it has a high probability of the price to "take a break" (moving sideways without a definite trend in relation to the timeframe you are looking) before continuing it's trend or retraces/reverses.
2) In H4, my personal trend identifier have turned into bullish (not specified nor illustrated in the chart) and the weekly range High suits the minimum size that qualifies as a retracement leg
3) No risk event moves (economic data) that potentially could affect the Euros and Dollar today, so technical moves can be expected (i.e buying/selling at significant levels, profit taking, its Friday)
How will I determine my entry? : When any of these three levels (marked with a circle I have drawn) are tested and the reaction following to that are W patterns or Bullish Engulfing candle
target : Today's projected daily range High though I won't be surprised if the weekly range high could be reached today, but I won't hold my breath
Setups other than this (that is not even near to my setup), will be ignored.
Give me a follow if you like the writeup.
Tradingrange

OIL Buy to Extenstion Level & Measured Move Break (Daily)Channel line represents key resistance area with pricing holding at that level.
Possible scenarios:
Target 1 represents 1.272 extension which coincides with lower pivot high
Target 2 represent measured move break of prior trading range which also coincided with highest high
S/L: Around 10 pips below wick of strongest bear candle @65.54
T/P: At pivot highs and extension levels @72.56 & @74.04

Daily Range - EURUSD exampleSome of the typical occurances in the day week in week out. Here's what needs to be taken note :
1. Price hit the range has high probability for the price to reverse or move sideways (especially after London closes)
2. If price hit the range, sometimes it is followed by a "final" push (breaking the range) before a reversal happens. Some like to call it Market Maker manipulating the market or stoploss hunt or the usual "fake breakout"
3. If price exceeds the range by significant amount, most likely the following day its gonna be a quiet market (paying the market in advance).
4. Price exceeding the range more often than not a result of price not hitting the range by significant amount in the last 2-3 days (paying back the market)
This is NOT a trading strategy, just another analysis tool like you would in analysing Support and Resistance or Supply and Demand.
If you like the writeup, give me a follow, find me at youtube 'Sufian FX Trading", reach me at twitter sufian_fx for discussion or questions. Thanks

AUDCAD Buy As Price Heads Towards Confluence Zone (Daily)Target area represents 0.618 retracement and mid zone of trading range
Price broke past mid zone of inner channel and 0.886 retracement
S/L below bullish prior signal bar on 2hour time chart @0.96697
T/P at confluence zone @0.97627 area
RSI confirming upward price strong momentum
Risk/Reward 1:3
(Sorry for the messy chart hehe)

Sell GOLD From Resistance Area & Channel TopYou can either wait for gold to reach the top of the channel to initiate sell position or for a strong bearish signal from resistance area shown - indicating a shift of the market to the bears. Target is previous low which coincides with measured move of prior trading range break and midline of the channel.
Risk/Reward 1:2.5

Buy EURGBP Heading Towards 1.618 Extension (DAILY)Price bounce from mid trading range and channel zone heading towards 1.618 extension of lowest low and following higher high.
1.618 extension is also upper resistance.
1.272 extension turned into support from previous resistance
You can take the buy and set your target to that area or wait for price to reach that point and watch for potential sell reversal set-up.
Higher probability of the big boys pushing price to that area for that exact reason.
Negative correlation with EURUSD as it heads down - link to related EURUSD idea below.
Risk/Reward 1:1.5

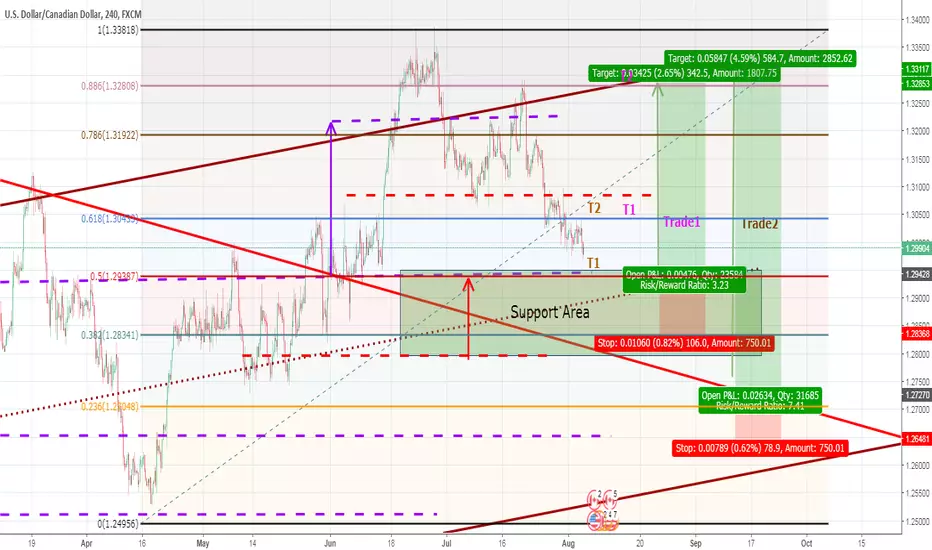
USDCAD Potential Buy Setups For The Week AheadTrade 1: Wait for price to reach median trading range line/near top of support area and enter on bullish momentum
Risk/Reward to Target 2: 1/3
Trade 2: Wait for price to reach major trend line/near bottom of support area and enter on bullish momentum
Risk/Reward to Target 3: 1/7
USDCHF Buy To 0.618 ZoneUSDCHF support area confirmed with mid range line and 50 fibonacci retracement
Target area 0.618 fibonacci retracement matches with mid channel line
Risk/Reward 1:2

My Wickoff Updated and Refurbished on Bitcoin In previous Analysis I was explaining a lot about our accumulation Zone and all the details that it required to be explained. Thus, I think I made a mistake on timing the market, and since I always update my analysis, when I checked my Chart I realize one thing, THE VOLUME, I know I have been talking about volume a lot, but I wasn't seeing correctly the volume in phase b, the thing is that we never had a spring, that was ST, but the reason because I didn't see it is because BTC found the bottom lower than the SC, because Selling Pressure really got exhausted at that point, and apparently in th 6kish and 5.9kish there is not a lot of supply, that's why volume decreases in each dump, and now I can expect a real Spring in Support Lines A-B area once again before moving upwards, The Creed matches like a mirror from schematic #1 but it fits more likely, it doesn't really matter.
If this is correct, it would match with previous analysis where I see a mark up in July for the short term, and maybe we can get to retest trend line, this doesn't mean reversal, just means that a shakeout is needed. Well let's see what happens now in the upcoming days.
SPANISH
En Análisis anteriores he estado explicando mucho sobre nuestra Zona de acumulación y todos los detalles que requería explicar. Por lo tanto, creo que cometí un error en la sincronización del mercado y, dado que siempre actualizo mis análisis, cuando revisé el Gráfico me di cuenta de una cosa, EL VOLUMEN, sé que he estado hablando mucho sobre el volumen, pero no estaba viendo correctamente el volumen en la fase B, la cosa es que nunca tuvimos un Spring, este era un ST, pero la razón porque no lo vi es porque BTC encontró el fondo más bajo del SC rodando los soportes mas abajo y, porque la presión de las Ventas realmente se agotaron en ese punto y, aparentemente en los 6k y 5.9k no hay mucha oferta, es por eso que el volumen disminuye en cada declive (Dump), y ahora puedo esperar verdadero Spring en las Líneas de Soporte A-B una vez más antes de movernos al alza. El Creed se ve como un reflejo del que se muestra en el esquema #1, pero es más compatible, realmente no importa, funciona.
Si esto es correcto, coincidiría con un análisis previo donde veo un movimiento alcista en julio para el corto plazo y, tal vez podamos volver a testear la línea de tendencia, esto no significa inversión de tendencia, solo significa que se necesita una sacudida. Bueno, veamos qué pasa ahora en los próximos días.

BTC/USD Wyckoff AccumulationUsing Wyckoff's schematic 1 Accumulation,we can analyse the volume to the price action and structure. The description worth mentioning is written on the chart :P.

ADA, broken thru support, on to plan BNow that ADA has had a break to the downside of support and corrective structure at (3), it is starting to look like we are in a large trading range (1). The box at (2) is a false break of that level but may also be the bottom end of the range--it is a little unclear where buyers will come in. The trend isn't super consistent across time frames so I plan on being nimble with bullish trades and keeping holding times short.
So now that I am viewing this a potential trading range, whats the strategy? Get long near the bottom of the range (0.13-0.18), get short (if your exchange allows you to do so) at the top of the range, and stay neutral in the middle.
Also, keep in mind that while the long-term trend for the crypto-market in general is still bullish, there is still a good chance that this range will break to the downside eventually--so keep an eye out for signs of weakness--weak bounces, lower highs, reactions with shallow angles.
Also, a break below the lows at (2) would definitely switch my bias to bearish.
*I am mostly just thinking out loud in these posts--I wouldn't consider this a suggestion on how to trade

Bitcoin Monthly chart, fib support, trading range for 2018 bearThe massive bull run of 2017 gives some context for the slow bleed of BTCUSD in 2018.
While the failure of the parabolic advance in '13-'14 retraced more than 80%, the 2018 bear market has only retraced 61.8%, providing an argument for BTCUSD sinking further to $4000 as the bears continue to show dominance.
I am not an expert, and this is not investment advice.

OptionsAction's MIchael Khouw's Bearish TSLA TradeOn Friday's Options Action, the crew analyzed the performance of Tesla (TSLA) stock. Tesla has traded within a range for over 3 years before breaking higher towards its $375 highs. Recently, TSLA has started to trade back into the range after a heavy selloff a few weeks ago. Coupled with lower Model 3 delivery numbers and dwindling cash reserves, risks are skewed to the downside. Expecting TSLA to trade lower after their earnings announcement, Michael Khouw suggests Selling a May 18 250/280 Put Ratio 1x2 for a $2.00 Debit.
We've structured this trade in OptionsPlay so you can analyze and view this trade along with the supporting technical chart at your convenience.
View this trade in OptionsPlay: app.optionsplay.com
Cost: $230
Max Reward: $2,770
Max Risk: $22,230
POP: 34.68%
Breakevens: $222.30, $277.70

EOSUSD Trading rangeWe're trading inside a range right now. Here's how this trade should be done:
1) ABSOLUTELY NO POSITIONS SHOULD BE TAKEN ON THE GREY MIDDLE AREA. This area is way too far from both stop-losses, causing it to be non-profitable.
2) You should trade based on your "belief"/analysis: "is the market bearish"? If your answer is "yes", only short positions should be taken (or very low leverage long positions).
3) You should use an indicator to base your entry on. For example: RSI + MACD gives you a "bullish sign" around 5.55. Then, you should entry long if you so desire. If your indicators didn't give you any trading signs, DON'T OPEN A POSITION.
4) Take your profits based on your indicators as well. Don't wait for the market to hit the top of the trading range (it might as well never do it).
The areas I've highlighted on the chart are based on fibonacci retracements and risk reward ratios.
5) Take full profits if the price hit the opposite side of the trading range. For example: if you get in at 5.45 and the price hits 6.23, close your position. Trading in a range is dangerous.
6) Take your stop-loss if you need it.
My opinion: trade short mostly, and if you wanna trade long, take full profits on bearish signs from indicators.
Don't follow my strategy blindly, I'm nothing but an amateur. Feel free to give me some critics.

4H EUR/USD: Range Trading
Range strategies are used when the market lacks direction
Find support and resistance to define your range
With any strategy manage your risk in the event of a breakout
Support @ 1.218
Resistance @ 1.25ish

Historical Bear Run, today's Trend LinesDear Traders,
As we continue to analyze the previous bear run of 2013/2014 on today's market we can only marvel on its beauty and the quantity of similarities that are flourishing.
My Trading Ranges are: Max (11,4-11,9), Min (9,6-10,2).
Due to strong bullish signals from my favorite indicators (specially today's Ichimoku (10,30,60,30) TK_Cross) I'm still skeptical on the idea that the previous bear run can give us such a predictable path. But until we don't see a change of character on the BTCUSD market I will continue to keep an eye on this graph.
Have fun and take care out there, it's a dangerous land.
S.

The Trend: EP8 -- Building SupportsHowdy Yall!
On this episode of The Trend we take a look at how an asset sets up a foundation for further moves. Its important to understand some of the psychology which applies to both traders and investors when evaluating an asset. Here we look at BTC and its current trading area along with historical trading area's for comparison. Several times throughout the video I use terminology which is "borrowed" from Wyckoff analysts. I would like to clarify that I am using these terms as "explanatory" terms and not necessarily as the professional definitions for them (although most do fit, just by nature). Thanks for taking a look!
I hope you all muck up a chart showing off what you think will happen, and feel free to post that chart back here!

Deviatrix oscillator strategy for trading Bitcoin by JomySomething I spun up last night. Why "Deviatrix"? It sounds sexy and it's based around price trading range deviation. Buy signal is when green is over red. Red is designed to meet green quickly when it senses changes (danger) in the trading range and hopefully get you out of long positions a day before the quick dump offs. It's been tuned to trade bitcoin, and there are no guarantees this will ever work for you or keep working if it does work, but it might be fun to try. It may work on 4h bars too, but 1d is best. For entertainment purposes only.

Quantum rally or dumpQuantum was trading in a range. It broke out and has a good potential. It is now testing the upper part of the previous trading range. A few scenarios now are moon or dump. If it closes below the yellow line it could go back to the lower end of the previous trading range. If the upper end of the trading range supports it, then quantum could go to the following targets. mid term and long term. so the next 2 hours are decisive on the 4h chart.
purple: resistance
yellow: trading range
orange: uptrend
arrows: targets, mid term and long term
trade smart!

Short USDCAD in trading rangeGreat opportunity to go short on USDCAD Daily chart.
USDCAD is moving in a trading range, let's try to earn from this situation!
Nice risk reward ratio

GBP/USDIt appears that a solid bull trend is forming on GBP/USD, ending the trending renge between the 1.33 and the 1.30 area started in October. The brakeout of the 1.33 area will be the signal for the buy. Then the next two resistance will be at 1.346 and 1.362.

USDJPY : Trading Above Resistance USDJPY has broken out from trading range of last 7 Days.
One can initiate long position around 111.85 with Stop Loss of 111.50 for Target of 112.35-112.50.

GOLD Trading Forecast UpdateGold almost touched our target at 1193, managing to bottom around 1194 area.
Looks like trend is going up already.
Happy trading everyone!
