Oil is Ranging. So Where Will it break? Oil has been in a range towards the end of last year and price is fighting against pushing below the 75 lvl and staying below it. It makes sense as the news is mixed because there are positive and negative news for Oil. Check out the following:
Positives for Oil:
-China economy recovering and demand increasing
-Russia plans to cut Oil exports by 25% and cut oil production by 500,000 barrels
-EU ban on Russian Oil
-OPEC maintaining production cuts
-JP Morgan looking at $90 a barrel for Oil in the middle of the year
Negatives for Oil:
-to the FED increasing rates for the next three meetings
-a possible global recession as majority of the G7 nations increase rates
So, what will win out? The negatives or the positives. I am thinking Oil will be able to push higher in the short term (next few months) and eventually fall as interest rates push higher and higher. If inflation does not drop as fast the FED wants, it will need to crank up the the heat on inflation, by doing it through interest rates. In 2025, I think Oil is going to push back up to $100, maybe higher and if this does happen, it would be good if I am still in the GBP/CAD as price would likely be around 1.45. On a side note, there is a big push to renewable energies and electric vehicles, but this requires a lot of resources to produce on a massive scales and in the interim Oil will be needed. If this massive push does happen, in the beginning, Oil will increase exponentially until renewables take over. In the next couple years, lets see if I am correct:
-price by the end of the year $80
-price in the beginning of 2024 (first 6 months) $70 - $80 and end of 2024 (last 6 months) $95
-price in 2025 $100+ (I keep thinking production is going to go off the rails with what's going to come out and the new technology)
Tradingrange

Bitcoin Swing perspectiveHello guys.
Hope you all have good time.
Today im going to share you my opinion about BTC in 4H timeframe.
As you can see in my chart the price consolidate around a strong longterm Trendline
for about 10 days and wait for FED decision about Rate hikes and Inflation Data.
I think the economic information are stable for now and Price action do the best thing!
So when the price try to break this trendline , Sellers come in strongly and
move price down till 27000 level.
In my view price cant break this line and 29000 level for this time and
the price will down to 24000 level and after a rest there , it again start to increase
in hope of reaching 30000 level.
Its a good time for BLSH(Buy Low Sell High) until the price break the triangle and move in a direction.
I hope you enjoy my view.
PLEASE dont forget to set an appropriate StopLoss and manage your Risk , Because
Nobody Knows about 1 second later and these views are all possibilities.
In another word ,We Trade Possibilities Not Realities.
Share me your opinion and TEACH me something new.
Love you all

Quick Bitcoin Scan in the Morning Good morning everyone
Grab yourself a cup of coffee and enjoy this quick scan on Bitcoin!
Bitcoin has been consolidating overnight, shedding a lot of volatility, and opening up a window of opportunity for a Long and Short scenario on the coin.
Make sure to check the video out so that you don't miss a potential entry on Bitcoin!
Also, please leave a comment and share if you like videos like that.
Many thanks and have a fantastic one legends
All the best
CH

Bitcoin Shorting Scenario Hi Traders!
With a lot of bad news in the market covering crypto-affiliated banks going underwater, I think it makes a lot of sense to look at potential shorting scenarios for Bitcoin. Please note: In my weekend analysis post from yesterday, I was laying out a potential long scenario for Bitcoin as we are still range bound between 20k and 25k. Seeing how the market holds up over the weekend is giving me somewhat confidence that Bitcoin could see a leg higher. Before you dabble into this idea, be sure to understand that Bitcoin has also a good chance of recovering from here.
Here are my prerequisites for this trade:
- Legacy markets need to be open
- Legacy markets need to trade in the same direction, this is because we could potentially see Bailouts for SVB or takeovers that could relieve the banking crisis
- Bad news spiral continues on Monday
Here is my Game Plan:
- Bitcoin needs to fall below 20300
- Fast move setting a new low in the 19800 area
- Rebound and touch on 19950
- Retreat to new low and consolidate on the low
- Entry upon break of the new low
- Target 1 19500
- Target 2 18500
Big influencing news can make an impact on your trading strategy, but it is important to understand that macro news is not necessarily a good indicator you should trust, detach yourself from the breaking news world and trade pure price action, cut out the Bullshit and you will see a clear picture.
Please make sure to check out my Bitcoin Long Post and my Market Analysis for a better understanding of where I see Bitcoin going next week.
Thanks for tuning in and enjoy your Sunday!
Best
CH

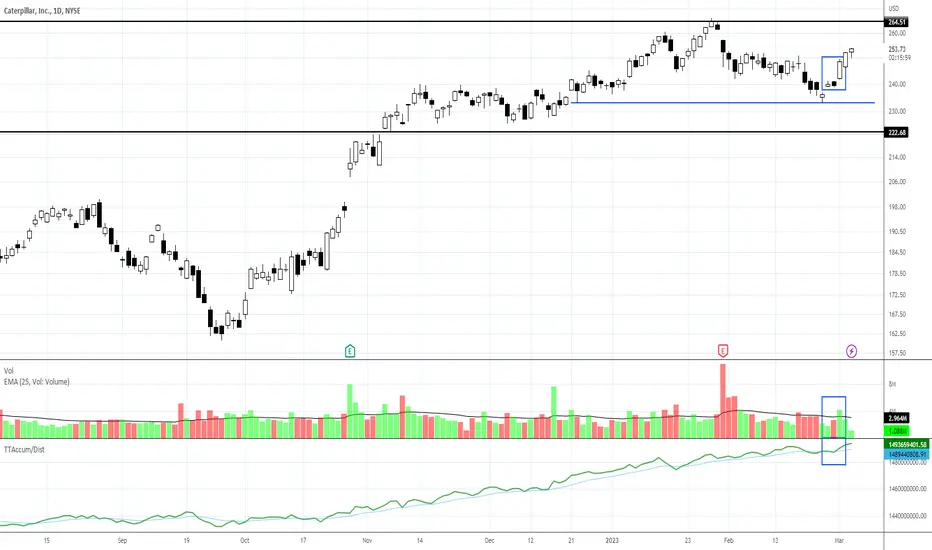
CAT: Range Bound Swing TradingCAT developed one of the entry signals I teach this week. The stock rebounded from testing the lows of the trading range. Hybrid indicators suggest large-lot buying is triggering in the lows of the range.
Point gain potential may be limited by the sideways trading range developing, but swing trading can be done within the range if you can catch the entry early in the upswing from the lows and plan to exit near the highs.
This trading range will need to compress near the highs to sustain a breakout to the upside.
ETC USDT LONG IDEAETC/USDT has reached its own support line in TR and has received a good response .we can see doji and Entrybar .It is your responsibility to open this position.
Good luck
tp1:22.07
tp2:22.47
tp3:22.78
tp4:23.22
sl:20.30
Good luck


Bitcoin is now expected to reach levels 23.8K - K22.4 - K21.5The first target was reached by Bitcoin yesterday, by a slight difference, and the price bounced from it, and it is expected to return to touching this level, and it is considered a minor and weak support, and it can be broken easily
Today, it is expected to break 22.8K, and head towards the second support levels at 22.4K, and it is likely to be broken if the rise continues on Dominance Tether..

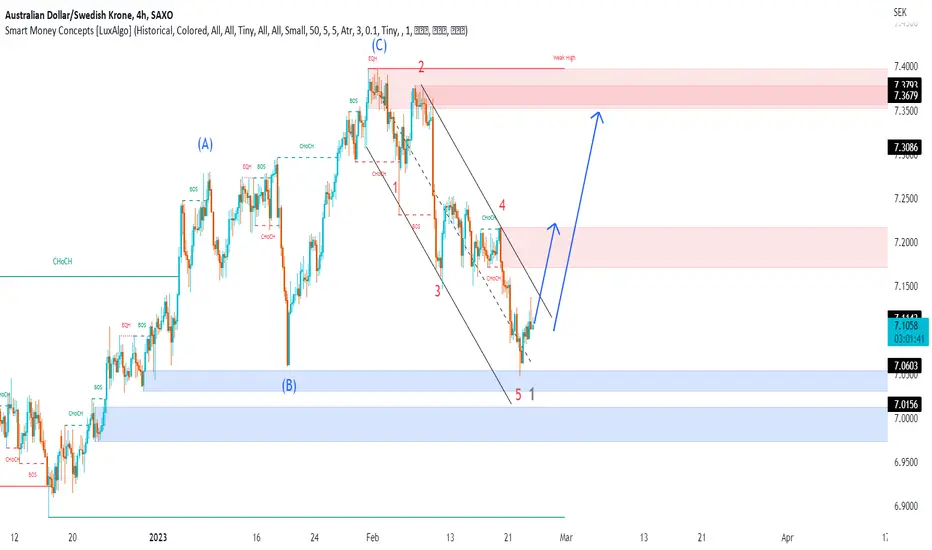
AUDSEK Next Possible MovePair : AUDSEK ( Australian Dollar / Swedish Krone )
Description :
Divergence
Impulse Correction Impulse
Elliot Waves - Completed " ABC " Corrective and Impulsive Waves " 1 ( wxyxz )
Flag Pattern
Break of Structure
BTCUSDT - Trading Range (Retest)2Hour Chart - UTC+1
My best effort attempting to draw a trading range that the price if currently retesting to enter back into the range. Will create a separate chart idea for a possible trading range should we continue to the upside.
Trading range:
Bottom 21,500 Top 24,300 and Middle 22,900. At the time of writing, possible retest of the top of the range. Not having yet hit the weekly at 24,295 could possibly be a signal for a front run however, levels between this weekly and daily levels above seem to be well respected. * The weekly was tapped. Nice reaction, lots a resistance above after recent daily action.
Fibs:
Fib Channel from low on Saturday 14 Jan at 11:00, to low Mon 13 Feb at 17:00, to higgh Thurs 2 Feb at 01:00.
Fib Retracemet from low Mon 13 Feb 2022 at 17:00 to high Thurs 16 Feb at 17:00. Interesting level is 0.618 about mid of the channel including a daily an nPoc.
Assumptions:
All monthly, weekly, daily, and nPoc Horizontal rays act as support and resistance levels. Support when price is above and resistance on price action below. Fib channel also used for indication of past and present possible support/resistance levels.
My bias:
Bullish for a break to the upside. Plenty of price discovery above should the range be broken to the upside. Although bias I'm always trading the levels as they come.

GoldViewFX - Market UPDATEHey Everyone,
This chart is playing out as analysed, giving us enough head start to take action. As shown on the chart, EMA5 broke 1857 and locked on Monday opening the swing range, which we were waiting on before making fresh commitments. The swing range is now complete today.
We got a signal activation on the swing range for a quick 30 pip buy, which we banked. Patience was key!! Like snipers we waited for the swing range.
Any running trades can also be protected should we ride up from here if the swing activates fully. We are looking for EMA5 to create a turn above the swing range for the swing to take place. We will keep a close eye on this challenge. If EMA5 breaks and locks below the swing range then we are likely to see the levels below open up.
We will trade and navigate this range using our EMA5 lock strategy and weighted Goldturns and keep you all updated.
BULLISH TARGETS
1867 - DONE
1872
1876
EMA5 CROSS AND LOCK ABOVE 1884 will open 1896 and 1903
BEARISH TARGETS
1863 - DONE
1857 - DONE
EMA5 CROSS AND LOCK BELOW 1857 WILL OPEN 1853 - DONE. 1849, 1841 and 1833
SWING RANGE
1833 - DONE
As always, we will keep you all updated with regular updates throughout the week and how we manage the active ideas and setups. Please don't forget to like, comment and follow to support us, we really appreciate it!
GoldViewFX
XAUUSD TOP AUTHOR

ETHUSDT - Liquidity zone reached, ready for higher?ETH has faced significant resistance at the key level of $1700, marked by the June 2021 low. Despite repeated attempts we failed to break through this level, leading to a swing failure at the November 2022 high.
This failure has resulted in a retracement to the liquidity zone at $1500 (Key Level), which is also the median line of the channel. Additionally, there is the 200-day MA acting as support at $1440. This retracement has had a significant impact on traders who had entered long positions from January 14th, as many of them may have been forced to exit or are now underwater.
To regain momentum and target for higher prices, it is essential to reclaim the previous low and establish it as our new level of support. Volume will play a crucial role in determining the next move.
As long as ETH remains above $1500 a bullish bias should be maintained. The 200-day MA at $1440 acts as an additional layer of support.

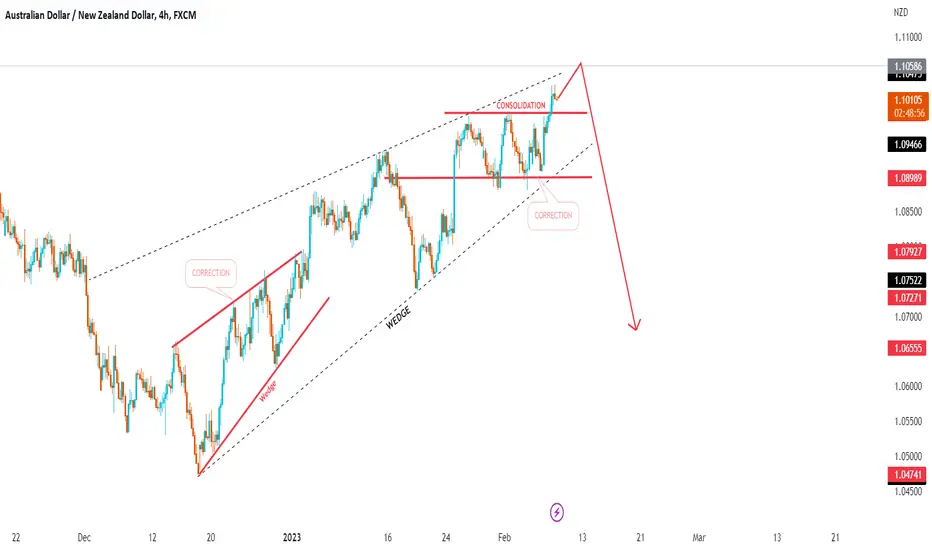
AUDNZD Next Move ? Breakout or RejectPair : AUDNZD ( Australian Dollar / New Zealand Dollar )
Description :
Rising Wedge as a Corrective Pattern in Long Term and Short Term
We have Consolidation Phase and Breakout the Upper Trend Line and Completing the Retracement
S / R Level
Divergence
Fibonacci
EURGBP Next Move ??Pair : EURGBP ( Euro / British Pound )
Description :
Rising Wedge as a Corrective Pattern in Long Time Frame and Rejecting form the Upper Trend Line
Completed Impulsive Wave " 12345 " and Correction " ABC " Wave
Divergence
Descending Triangle
Bullish Channel
S / R Level

OPUSDT - LONG OPPORTUNITYThe market has been stuck in a trading range at its highest levels for more than 10 consecutive days and with the start of a new month, it's a great time to look for potential buying opportunities.
As investors, it's always exciting to explore new opportunities and reap the benefits. In this scenario, it would be beneficial to see if the market tests its lows once again.

ETHUSD - Trading RangeThe market is currently displaying signs of an ABC correction, with the focus being on wave C. Key level to watch is 1500, as a substantial amount of liquidity has been accumulated during the trading range in this area. This could potentially provide an opportunity for traders to enter the market if the long positions are flushed out.
The Fib 0.5 level of the entire impulse wave could be a potential entry point for traders who are seeking a low-risk, high-reward opportunity. However, it is important to keep in mind that the market is constantly evolving and it is crucial to closely monitor any changes or developments to ensure a successful trade.
In conclusion, the current market conditions indicate a potential trading opportunity for those who are able to accurately analyze market trends and make informed decisions. The key to success in any trade is to remain vigilant and adapt to the changing market conditions.

nifty supply zoneas we know market is in crashing mode we have to take extra care n keep the down trend in mind as we mark the supply zone as per option chain data 18000 is good support few days ago now market breeze this level n now it will act as strong resistance.

Five Long-Term VWAPs for BTCPrimary Chart: Five Long-Term VWAPs for BTCUSD with Fibonacci Price Target
SUMMARY:
BTC continues to consolidate and chop in a tight range around $19,246 since mid-September 2022. This range is from $18,232 to $20,225 approximately. Each breakout move to the upside or downside has failed, confounding directional bears and bulls alike.
A longer-term trading range has also been in effect since June 2022. This longer-term range can be identified as between December 2018 and March 2020 VWAPs—$17,929 to $25,486. Or a simple horizontal channel can be drawn at the highs and lows from June 2020 to October 2022, which gives virtually the same range. This 5-month range aligns to some extent with the recent month's price action, which has been in an even tighter range around the $19,246 level.
Price could easily test the longer-term VWAP from December 2018 in the coming weeks. This VWAP lies at $17,929.
Price could easily test the longer-term VWAP from June 2017 in the coming months. This VWAP coincides with the Fibonacci projection at $12,184 discussed as a viable target since summer 2022.
Over the past four to five weeks (over a month), BTC has consolidated around the $19,246 level, which is a Fibonacci level of interest discussed in SquishTrade's prior BTC posts. For example, the following post (and its excerpt quoted below) analyze the specific trading range and how the breakout moves to the upside and downside have failed:
"BTC has chopped above and below this $19,246 level quite a few times, forming a tight consolidation range between and $18,232 and $20,225 approximately. Each breakout move has resulted in a bear or bull trap that fails to follow through with a sharp reversal back to the opposite side of this level."
Here is the chart posted previously showing the failed breakouts and breakdowns:
So the longer-term VWAPs can help place price action in perspective. Like other indicators, they cannot be considered a crystal ball or guarantee. They just help show the broader price environment over a longer term, which can provide a little clarity.
1. The primary trend remains downward. The VWAP anchored to the all-time high remains sloped downward and well above the current price. The average buyer since the all-time high remains well under water. See the Orange VWAP on the Primary Chart.
2. Price remains under the March 2020 anchored VWAP (shown in pink) which is anchored to the pandemic-crash lows. This positioning is bearish. But this is somewhat offset by price trading above the December 2018 anchored VWAP (shown in green). Price is stuck between these two in a sideways range since June 2022. A breakout move to the downside remains a high risk. This sideways action in between these longer-term VWAPS is analogous to the price action in the past month (mid-September to mid-October 2022) showing chop in a range from $18,232 to $20,225.
3. Price remains above the longest anchored VWAPs from the 2017 low and the 2011 all-time low (using all available BITSTAMP data. Price could easily test either of these VWAPs in the coming months given the strength and severity of the downtrend from all-time highs. From a longer-term perspective, these VWAPs can be helpful to watch.
4. The measured move using Fibonacci projections results in a target of $12,184.72, which has been discussed in previous BTC posts.
Supplementary Chart: Measured Move using Fibonacci Projections for Targets
SquishTrade still thinks the $12,184.72 target is viable especially given that price has not reversed the primary downtrend since November 2021. BTC has shown some relative strength compared to other risk assets (e.g., equity indices) by trading in a chop range sideways while the other assets have plummeted in the past month. But until BTC can change the structure materially to at least an uptrend at the primary degree of trend, it remains prudent to assume the current downtrend should be favored to resume at the primary degree of trend. Note that this Fibonacci projection aligns loosely with the VWAP anchored to the June 2017 low with a value of $13,604.01.

Bitcoin Bullish Trend SignalAs you see in the chart, there is a purple bearish trend line and there are 3 red horizontal lines.
The Purple trendline is based on two pivots on days of 30th of March and 10th of November. And the red horizontal lines indicate top and bottom of Trading range that has been made in the past few weeks and the dotted one is showing top of the smaller trading range inside the big one.
I am noticing the first sign of the trend reversal in btc, and that is it has broken the purple trendline and after a nice pullback, has started to rise up.
I am expecting btc to continue to rise in the following days and see two major Resistance up on it's way, which are the two tops of the past trading range.

Dark Pool Buy Zone Patterns: BA ExampleA corporate aggressive stance to accelerate Boeing's recovery from the pandemic created buying activity during the index sell down over the past few days.
BA is one of the few companies on the Dow moving up while the majority of components were being sold down.
This is an example of how quickly a stock can reverse from selling down to resumption of its trading range or bottoming action. This is a range-bound run up. The technical pattern has some pro traders in the mix. The run is above the accumulation level for Dark Pools.

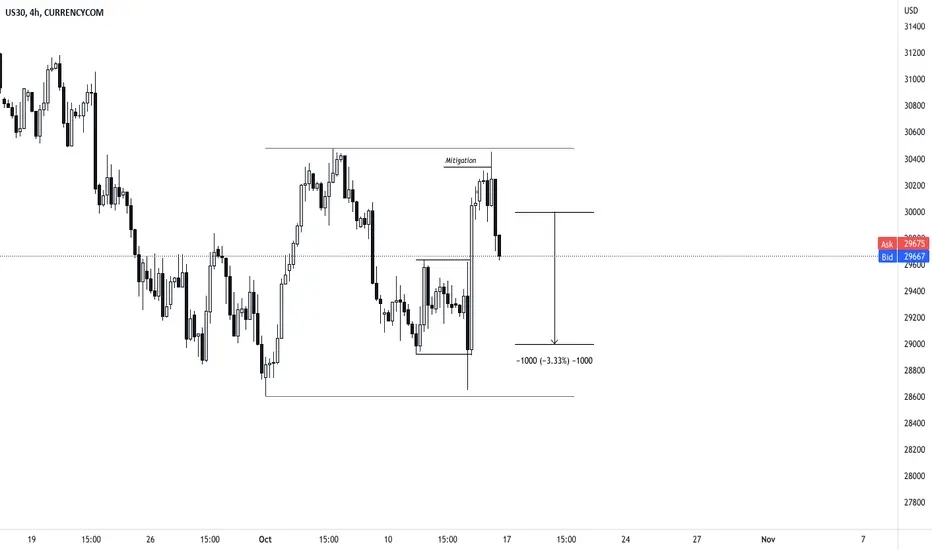
US30 4h Trading RangeUS30 Consolidation in Intraday Trading Range
Formed mitigation at top to fuel push downwards
Price should go to 29000 within the range
UNI MULTIPLE PATTERNSUNI Symmetrical Triangle DTF.
Bull target top of the range and Bear target bottom of the range.
Ascending Triangle leading up to the mid range, lets see if we can break the MID RANGE for continuation.
Nice simple trading setup for long or short trade.

Will BTC Break Its Consolidation Range This Week?Over the past few weeks, BTC has consolidated around the $19,246 level, which is the Fibonacci level of interest discussed in a number of recent posts in the past couple of weeks. See the links embedded in the Primary Chart above.
BTC has chopped above and below this $19,246 level quite a few times, forming a tight consolidation range between and $18,232 and $20,225 approximately. Each breakout move has resulted in a bear or bull trap that fails to follow through with a sharp reversal back to the opposite side of this level. See the intraday Supplementary Chart below for an overview of the past two weeks of price action with some of the prominent failed breakouts highlighted with circles.
Supplementary Chart: Key Fibonacci Level at $19,246 with Multiple False Breakouts in Both Directions
The failed breakouts in both directions have likely been a source of frustration for bulls and bears alike. Each move has been essentially a trap move that failed to follow through, with a sharp reversal to the opposite side of the $19,246. As pressure mounts on major equity indices like the S&P 500 ( SP:SPX ) and NDX 100 ( NASDAQ:NDX / NASDAQ:QQQ ), with many of them undercutting June 2022 lows, BTC is like to follow suit in short order. This does not negate the possibility of BTC yielding a sharp OS bounce in the coming week or two after a trend move lower.
One argument for the bulls is that BTC's sideways chop action has resulted in its relative strength becoming quite impressive. Equity indices have been plummeting sharply since mid-August 2022 with little reprieve. But BTC during this time has largely chopped sideways after losing a few key levels in late August and early September 2022.
BINANCE:BTCUSDT
BITSTAMP:BTCUSD
COINBASE:BTCUSD
KUCOIN:BTCUSDT
KRAKEN:BTCUSD
CME:BTC1!
________________________________________
Author's Comments:
(1) Thank you for reviewing this post and considering its charts and analysis. The author welcomes comments, discussion and debate in the comment section. Shared charts are especially helpful to support any opposing or alternative view.
(2) This technical-analysis view does not constitute a trade recommendation or trade setup. Instead, it attempts to offer technical commentary that describes and analyzes price levels, trends, price action, or the broader technical environment as of the publication date. Technical-analysis commentary does not equate to trade setups or recommendations. Within a given price environment, traders bear responsibility for their own trading strategy, risk tolerance, and time frame, and for any due diligence associated with such trades.
(3) This technical-analysis viewpoint could change at a moment's notice, e.g., when price violates a key level of invalidation for a particular view. Further, proper risk-management techniques are vital to trading success.
(4) To the extent countertrend price moves are discussed, consider that countertrend or mean-reversion trading, e.g., trading a rally in a bear market, remains higher risk and lower probability even for the most experienced traders and investors.
DISCLAIMER: This post contains commentary published solely for educational and informational purposes. This post's content (and any content available through links in this post) and its views do not constitute financial advice or an investment or trading recommendation, and they do not account for readers' personal financial circumstances, or their investing or trading objectives, time frame, and risk tolerance. Readers should perform their own due diligence, and consult a qualified / licensed financial adviser or other financial or investment professional before entering any trade, investment or other transaction.
