This is the resistance on AMC that you want to see broken! 😎Yes, we are inside a range, and it is pretty easy to trade ranges: Buy near 51.87, sell near 64.95. I like to trade ranges because the stop-loss are always so small, and the potential reward are always great.
Now, AMC might hit the 64.95 again. The breakpoint is the 60.23, once broken, this will lead AMC to the upper level of this congestion.
The 20ma is pointing up, and this is very good.
It is pretty rare to see the RSI near 100, and AMC is one example of this weird phenomena. Is there a possibility that it’ll break the 64.95 and fly to the 80s, or even 100s? Yes, and that’s why we must be careful here. Personally, I don’t like to short these stocks, just to buy near supports and see what’s the deal.
The black lines are seen here once again to help us understand what’s going on, and which points we should trade. Now I would wait for AMC break the pivot in the 30min and hit the 64.95 again, before anything else.
If you are holding AMC, the 64.95 is the breakpoint you want to see broken.
If you liked this trading idea, remember to click on the “Follow” button to get more trading ideas like this, and if you agree with me, click on the “Agree” button 😉.
See you soon,
Melissa.
Tradingrange


BTCUSD is still in range tradingBITCOIN reach the bottom of range trading with a bearish trend and may break range trading.

Possible Oversold Rally From Range Bottom IncomingRSI is Moderately oversold at the bottom of a trading range i will be making a small bet that we will rise a little bit from here.
TSLA: This is what we must know about it!Hello traders and investors! Let’s see how Tesla is doing today!
First, yes, we have an accumulation around, and Tesla is trading inside a range between the two black lines. Only a breakout from any of these lines will tell us what Tesla will do next . It seems the $ 571 is a support in the short-term, while the $ 635 is another resistance.
But the daily chart has an interesting pattern too:
We have a Triangle pattern, which is a continuation pattern, but this is not a rule. We see that the volume is higher during the bullish days, and lower during the bearish ones.
Yesterday, Tesla hit its support and now it is about to react. If it does an upwards breakout it’ll probably reverse the trend for good, and defeat the $ 635.42 and seek the $ 715 again. Remember that we have a gap at $ 733, and so far, TSLA filled every single one of its gaps that appeared above the price.
But if Tesla does a downwards breakout I see it at $ 538 again. For now, I’m not working with the possibility of it losing this floor.
TSLA is in a quite decisive moment! Remember to follow me to keep in touch with my updates, and support this idea if it helped you!
Thank you very much!

BTCUSD may break trading rangethere is a flag patter near the top of range trading and it may break both of them ( flag and range). otherwise it will go down after hit the top.

PLTR Trading RangeWe see a clear trading range here for PLTR. If you exclude the extreme pop due to wall street bets it is pretty much trading inside the channel.
Until we see a clear break from this trend we can assume it will continue.

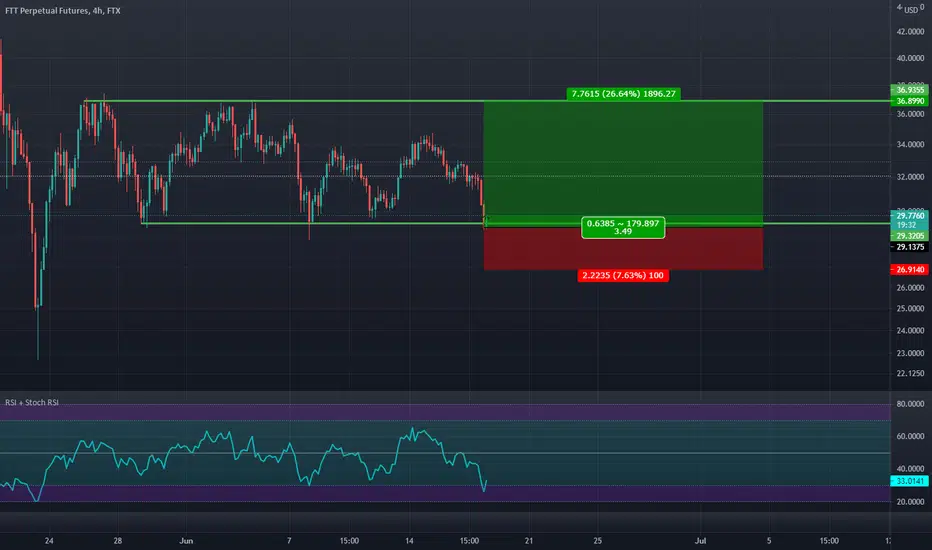
Trading inside a consolidation! 😒Now the situation is getting clearer on NIO to me. I see a consolidation between the 42.34 and the 40.89.
To the side it breaks, we’ll see a good movement next.
If NIO breaks the upper line, then the 46 is the next stop. If NIO breaks downwards, then the 20ma is the target. It seems simple enough to me, but it is not over yet!
The problem is the RSI. We have a small divergence, and it is overbought. This makes me more comfortable with the idea of a downwards breakout to the 20ma. Then the RSI will cool down, and the risk-reward ratio will increase too.
If you liked this trading idea, remember to click on the “Follow” button to get more trading ideas like this, and if you agree with me, click on the “Agree” button 😉.
See you soon,
Melissa.

Absolute Capitulation.... what's the plan now? For those new to trading or Crypto welcome to the big show. These moves are normal and happen more often than we would like. If caught on the wrong side these moments aren't fun, however its these same moves that have provided so much opportunity for great buys that have grown funds and changed many lives. Congrats if you didn't panic and bought yesterday's crash. Those that have put there trust into me and take the time to follow and read my content I say to each of you I'm sorry that I didn't see this sell coming. Had I known I would have helped warn you if I could have. For many of us long time holders we don't sell on those dips but continue to buy more and adjust our timeframes and look to the future. Remember this will pass and good things are yet to come. For those that sold on the dip, its not a total loss. You must learn from each trade and the experience over the years adds to your ability to spot opportunities and not let fear run so much of your trades.
I have outlined the two trading ranges that we are caught in at the moment. Between 30k-40k is a range that could continue for sometime. For obvious reasons a break of 30k would be detrimental and a sure sign of a change in market cycles in my opinion. Taking this one step at a time.. a break up thru the resistance of 42k can be a good sign of moving to trading range 2. Expect this 42k line to be backtested at least 1-3 times as it shows it can be trusted as support. Trading range 2 could be very quick but also could take weeks of sideways action as the demand gets burned up in accumulation. The hopeful path is a move towards the strongest resistance line of them all 48k. IF we can show a break of 48k very good things can happen to Bitcoin. Bitcoin has been on quite the move the last 6 months and we need to remember sometimes sideways is a chance for the engine to rebuild up steam. Hope your all well and staying positive about the things in life we can control. Greatness is not measured by what a man or woman accomplishes, but by the opposition he or she has overcome to reach his goals. Stay humble, Stay kind, Stay Patient. Let's see how the next couple days go for Bitcoin and the rest of Crypto. . I was blessed to buy the bottom of the Covid dip and this last sell off seems so dang similar. Shark still has a hunch our best days are still ahead.

The BTC Trading Range Cheat SheetAs depicted by the chart I have created, BTC finds itself in 3 macro trading ranges.
Each range should be approcahed differently.
BTC is currently entering the oversold region of the chart, signalling that it is time to accumlate.
BTC's fundamentals remain strong with continuous news of insitutional adoption. Weak hands that sell in the days to come will be panic buying in the weeks to follow.

NIO: Trading inside a range!Hello traders and investors! Ok, NIO behaved exactly as we thought it would, and it did the “worst-case scenario” we discussed last week. The link to the previous analysis is below, as usual.
In the 1h chart, it lost our previous support level at $ 37.54, and this made NIO just seek the next support, at $ 34.85 area. In addition, NIO is in a short-term bear trend, doing lower highs/lows , and the 21 ema is above the price (pointing down).
So far, we have no clear reversal sign, but we are above a support level. Let’s look for more clues in the daily chart:
The problem with NIO is that it is inside a congestion , but we have multiple supports/resistances to guide us. It is quite easy to trade ranges: You buy near supports and sell near resistances.
The question is, will NIO stop at $ 34? Or will it seek the $ 32? We can’t tell for sure, as we lack any confirmation. But the volume is looking good already. We have been talking a lot about volume lately, as when NIO drops, it drops with low volume, but when it finds a bottom and starts going up, the volume increases.
Yes, we have some weird signs that are more than enough to make us skeptical about any bearish movement, but again, we need more confirmation. This is the key for a good trade here.
If you liked this analysis, remember to follow me to keep in touch with our daily studies, and support this idea if it helped!
Thank you very much!

XRPUSDT nearing a key resistance zoneHi all,
XRP is looking quite interesting recently, now nearing its first serious area of resistance on the daily chart since it started moving upwards a few weeks back.
If we see a break above the $0.57-$0.60 zone we could expect another run up to the YTD high, which is located at 32% from where the price is situated now and 25% from the upper boundary of the resistance zone.
A 4-hour candle close above $0.59 can be our trigger
Regards

AAPL: Next key points we must keep in mind!Hello traders and investors! Let’s see how AAPL is doing today!
Since my last analysis, AAPL has been accumulating in the range between the red line at $ 136 and the black line at $ 137.98, and as long AAPL keeps there nothing interesting will happen. The link to my last analysis is below, as usual.
But even if Apple loses the red line, we have some support levels that could prevent from a further drop, like the purple trendline , which is better seen from the daily perspective:
In addition to the trendline, we have the 21 ema, so, we are talking about a solid support zone . Apple could easily drop to this level, as the volume is very low, and it is not showing any signs of reaction. But if AAPL defeats the $ 137;98 again, then it might retest the ATH again, and maybe do a quick stop at the $ 142 (previous resistance).
But so far, it is still in a bull trend, and only if it loses the purple trendline this would change. Either way, we’ll have our answer quickly, as this congestion is taking too long now.
Remember to follow me to keep in touch with my daily analyses, and please, support this idea if you liked it! Apple is in a decisive point, and we must be prepared to react to it, when the time comes. Techinical Analysis is all about timing !
Thank you very much!

FB: Weekly double topWe could see a bounce from the low end of the range or we could see a break to the downside which could offer lower timeframe shorts.

VETETH at low of range and ready for a bull leg...Possible falling wedge bottom forming. Markets tend to continue what it's been doing recently so betting on a rally from this support level is reasonable IMO.
Let's see how things pan out.

VETUSDT: 0.0143 back in play. Possible range going forward.Looks like 0.0143 is holding so far. If it holds on a daily and weekly basis, we could see the market ranging between 0.014 and 0.017 for a bit before deciding on a direction.

VETUSD stalling at 0.0174 level but still constructive overall..Said level is a the highest monthly close since the low this year and should be a key level for both bulls and bears. We should see some bullish follow through after a weekly close above that price. Else, market could get into a trading range between 0.0143 and 0.0174 before making a decision to go higher or lower. I still think the bulls still have the edge here in the short term.

Re-accumulation phase for Alibaba before markup I believe BABA has shown us the first levels of its trading range at the $315 level and $255 level and I think this is the range we will see the strong hands start accumulation before the Ant IPO for the markup. I will be swinging BABA in this range until it’s time for the final rally up in its final phase of this range.

Bitcoin is ready to jump very soonDisclaimer
Information is for educational purposes only and is not intended to give specific trading advice. Past performance is no guarantee of future performance. Investment/ trading carries significant risk of loss and you should consult your financial professional before investing or trading.
I think that Bitcoin is an olympic jumper because it jump and jump and never rest. Well after a shakeout I am watching supply exhaustion and therefore I think that Bitcoin will jump again
Disclaimer
Information is for educational purposes only and is not intended to give specific trading advice. Past performance is no guarantee of future performance. Investment/ trading carries significant risk of loss and you should consult your financial professional before investing or trading.

USDUAH New trading range and trend correction !As I have posted last week, Turkish Lira has
started its correction against USD. But not
7.8000 is my support level, which will be
I have announced T1 as the most important
support level for UAH against USD and this
week prices has touched T1 trendline, we
need to realize that this is long term trendline
and little crossing of this trendline can not give
as strong information about trend correction,
but anyway UAH is stable for this and next several
weeks. I expect 27.900-28.200 trading range.
Terms and short forms!
T - Trendlines (T1,T2... etc.)
S - Supprt levels (S1,S2... etc.)
R - Resistance levels (R1,R2... etc.)
TP - Take Profit
SL - Stop Loss
F - Fibo Levels (F23,F61... etc.)
Check out my next stream "What is divergence, why it is important for trading?"
www.tradingview.com

EURUSD trying to move back into trading rangeA daily close above the H&S neckline means we could be back into consolidation or we may see the market attempt a higher high to continue bull trend (see daily chart).
Now also less likely to see the bears carry out a measured move lower (from that H&S pattern).

INSG's weekly chart shows a consolidation pattern for 21 weeks.I anticipate an upward breakout out of the trading range because:
-price increases with higher volume and decreases on lighter volume
-higher support level as range develops
-larger trend is up for the market
Buy zone in the area of the new support level or following breakout and close above the range.
I'd hold for a few months to a year.

EURUSD - TRADE PLANDAILY - Trading in a range, hammer/doji candleat bottom of range (trend is up)
4HR - Double bottom with divergence
TRADE PLAN
1HR:
(1) Price may dip lower and make triple bottom, buy at the support zone
(2) Price may break out of trading range, buy on retest of the resistance turned support.
